In today’s fast-moving real estate market, success depends on understanding your numbers — from property sales and area utilization to regional trends and customer segmentation. The Real Estate Sales Performance Dashboard in Google Sheets is a ready-to-use analytics solution designed to give real estate professionals a complete picture of their performance in real time. 📊🏠
Built entirely in Google Sheets, this dynamic dashboard brings together your property sales, costs, client types, and regional performance into one easy-to-navigate platform. It’s ideal for real estate developers, agents, and brokers who want to make data-driven decisions — without complex tools or expensive software.
🔑 Key Features of the Real Estate Sales Performance Dashboard in Google Sheets
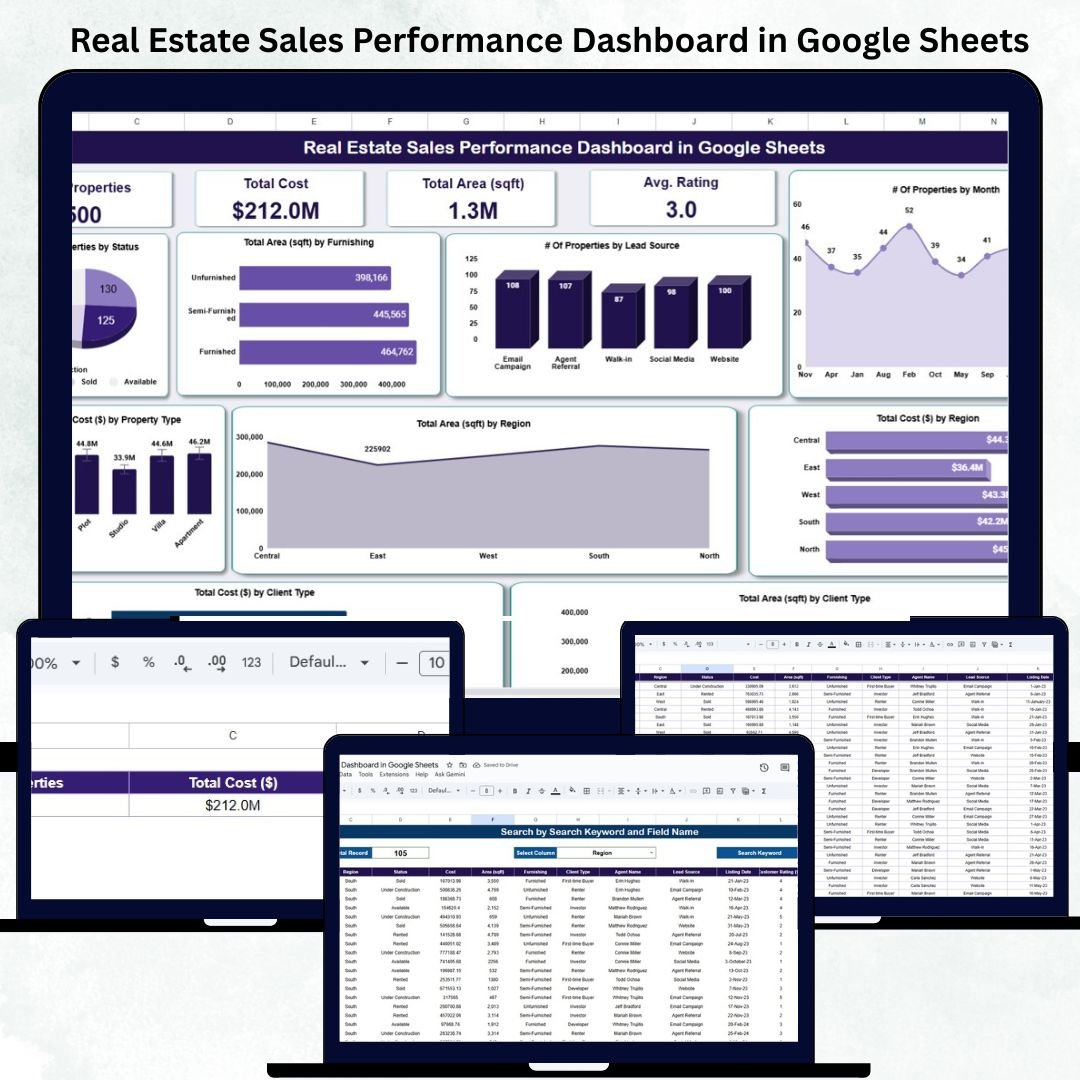
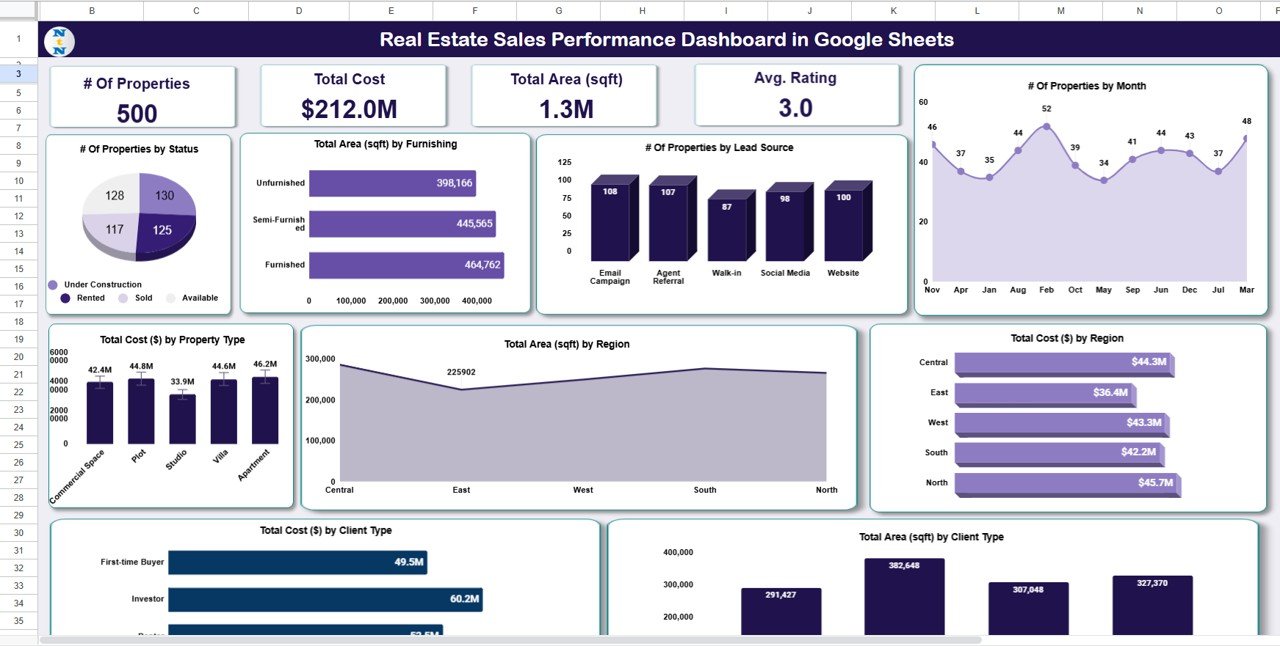
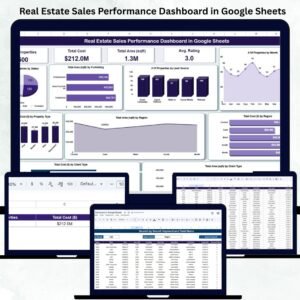
📋 Dashboard Sheet Tab (Main Dashboard)
This is the central hub where all analytics are displayed through KPIs and dynamic charts. It instantly updates when new data is added, allowing users to monitor performance effortlessly.
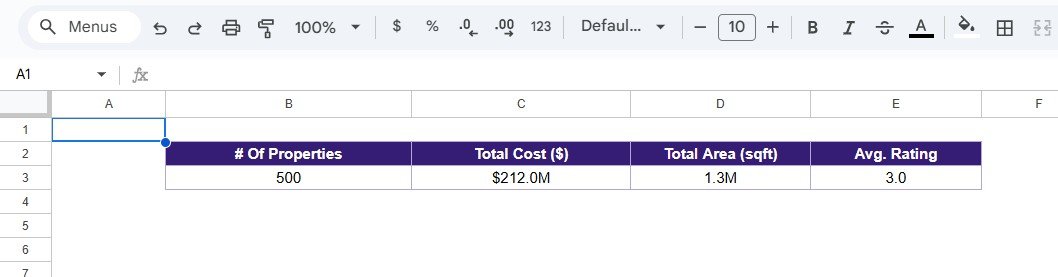
Cards Displayed:
-
🏠 # of Properties: Total number of properties tracked in the system.
-
💰 Total Cost ($): Combined sales value or total property valuation.
-
📏 Total Area (sqft): Aggregate area of all listed or sold properties.
-
🌟 Average Rating: Measures customer satisfaction or property rating.
Charts Included:
-
📈 # of Properties by Status (Sold, Under Construction, Available)
-
🛋️ Total Area (sqft) by Furnishing (Furnished, Semi-Furnished, Unfurnished)
-
🔍 # of Properties by Lead Source (Website, Agent, Referral, Ads)
-
📅 # of Properties by Month (Seasonal performance trends)
-
🌍 Total Cost ($) by Region (East, West, North, South, etc.)
-
🏢 Total Area (sqft) by Region (Compare locations side by side)
-
🏘️ Total Cost ($) by Property Type (Residential, Commercial, Industrial)
-
👥 Total Area (sqft) by Client Type (New Buyer, Investor, Renter)
-
💼 Total Cost ($) by Client Type (Analyze profitability per segment)
These visuals help decision-makers instantly identify top-performing regions, property types, and lead sources while highlighting underperforming areas that need focus.
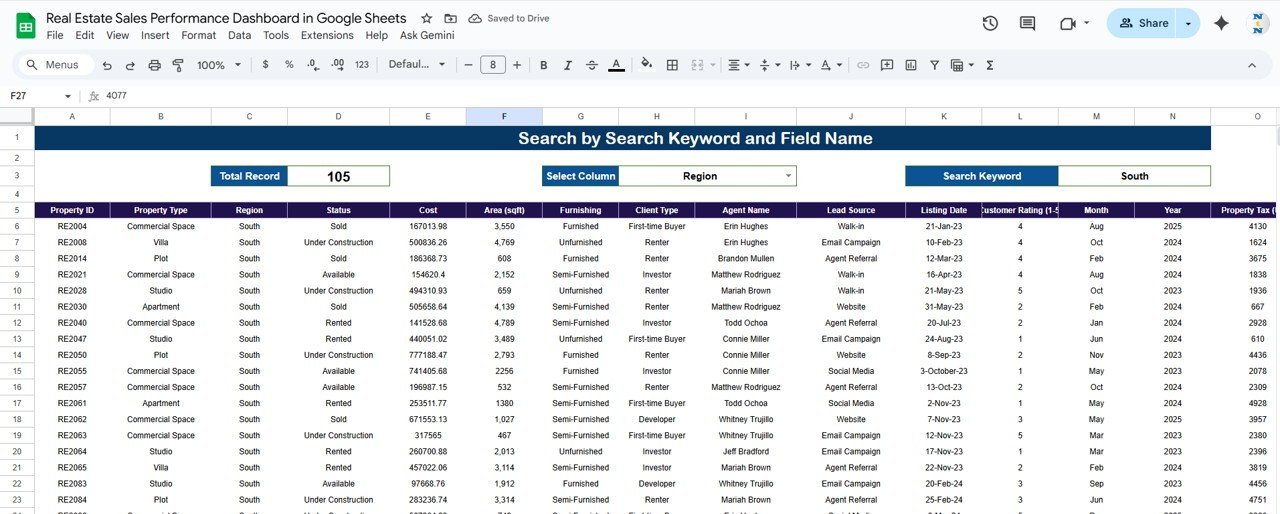
🔍 Search Sheet Tab (Smart Filtering System)
The search tab makes it easy to locate property details and records without manual scrolling.
Examples:
-
Type “Region = East” → View all properties in the East zone.
-
Type “Status = Sold” → Display all completed transactions.
-
Type “Lead Source = Agent” → Filter leads received through brokers.
This search functionality makes report generation faster and more efficient — perfect for sales meetings and client presentations.
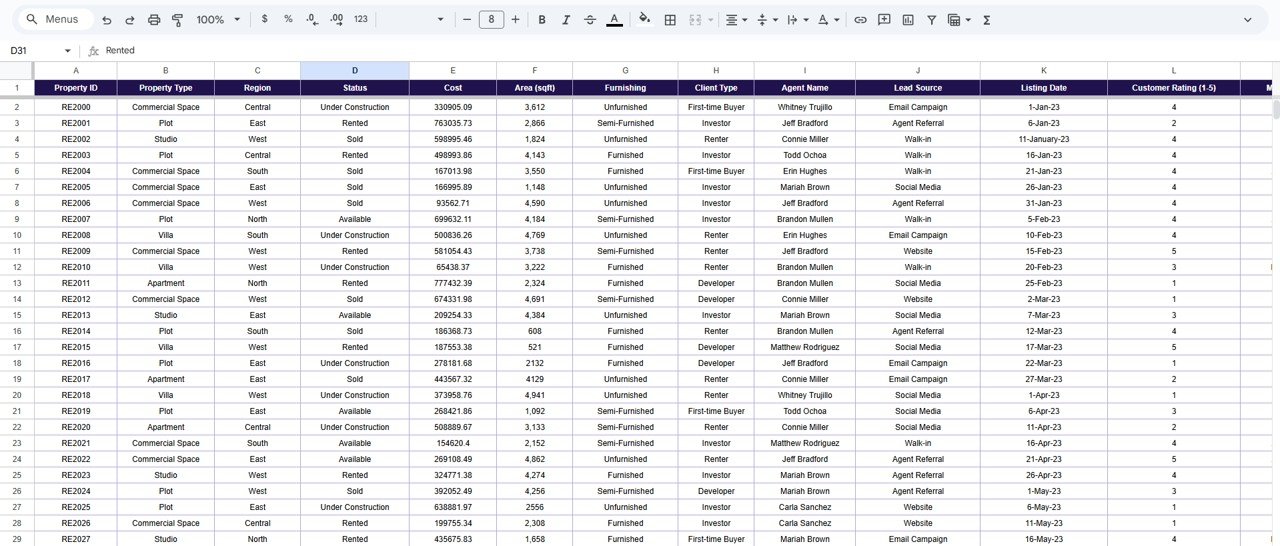
📊 Data Sheet Tab (Core Data Engine)
This tab is the backbone of the dashboard. All property information, including cost, size, furnishing, and region, is recorded here.
Columns Include:
-
Property ID
-
Property Name
-
Status
-
Region
-
Client Type
-
Lead Source
-
Furnishing
-
Total Cost ($)
-
Total Area (sqft)
-
Rating
The dashboard automatically aggregates these values into KPIs and charts, ensuring 100% accuracy and zero manual effort.
⚙️ Support Sheet Tab (Backend Setup)
The support sheet powers dropdown lists, color formatting, and data validation — ensuring consistent data entry and error-free analytics.
Users should avoid altering this sheet to maintain formula integrity.
📦 What’s Inside the Dashboard
✅ Auto-updating dashboard with live charts
✅ KPIs for property count, cost, and total area
✅ Segmentation by region, property type, and client category
✅ Search-enabled reporting
✅ MTD/YTD ready for trend analysis
✅ 100% editable Google Sheets template
✅ Multi-user access and collaboration support
🧑💼 Who Can Use This Dashboard
🏠 Real Estate Agencies: Monitor sales volume, client types, and regions.
🏢 Developers & Builders: Track project-wise performance.
💼 Property Managers: Analyze area utilization and cost breakdowns.
👥 Sales Teams: Identify top-performing agents and lead sources.
📊 Analysts & Executives: Make data-backed strategic decisions.
Whether you’re selling apartments, villas, or office spaces, this dashboard delivers real-time insights to help you plan better, sell faster, and maximize profits.
⚙️ Opportunities for Improvement
Enhance your dashboard by:
-
Integrating Google Forms to auto-capture new property leads.
-
Adding Month-over-Month Trend Charts for growth analysis.
-
Including a Profit Margin KPI for financial performance.
-
Connecting to Google Data Studio for interactive visual reports.
-
Setting Automated Email Alerts for low-performing regions or leads.
🧠 Best Practices
✅ Keep your data updated weekly.
✅ Protect formula and chart ranges from edits.
✅ Use consistent region and furnishing names.
✅ Validate property IDs to avoid duplication.
✅ Review regional performance monthly for strategic planning.
🌟 Why Choose the Real Estate Sales Performance Dashboard
-
📊 Gain full visibility over your property sales and trends.
-
🏘️ Analyze regional, client, and furnishing performance instantly.
-
⚙️ 100% automated and Google Sheets-based — no coding required.
-
☁️ Cloud collaboration for teams and brokers.
-
🧩 Fully customizable KPIs and charts.
The Real Estate Sales Performance Dashboard in Google Sheets turns complex data into clear insights, helping you manage your real estate business with precision and confidence.
🔗 Click here to read the Detailed blog post
Watch the step-by-step video Demo:


Reviews
There are no reviews yet.