


Managing real estate development projects requires precision, transparency, and continuous tracking. Without structured monitoring, projects often face delays, cost overruns, and inefficiencies that reduce profitability. That’s where the Real Estate Development KPI Dashboard in Excel comes in—a powerful, ready-to-use solution for developers, project managers, and investors.
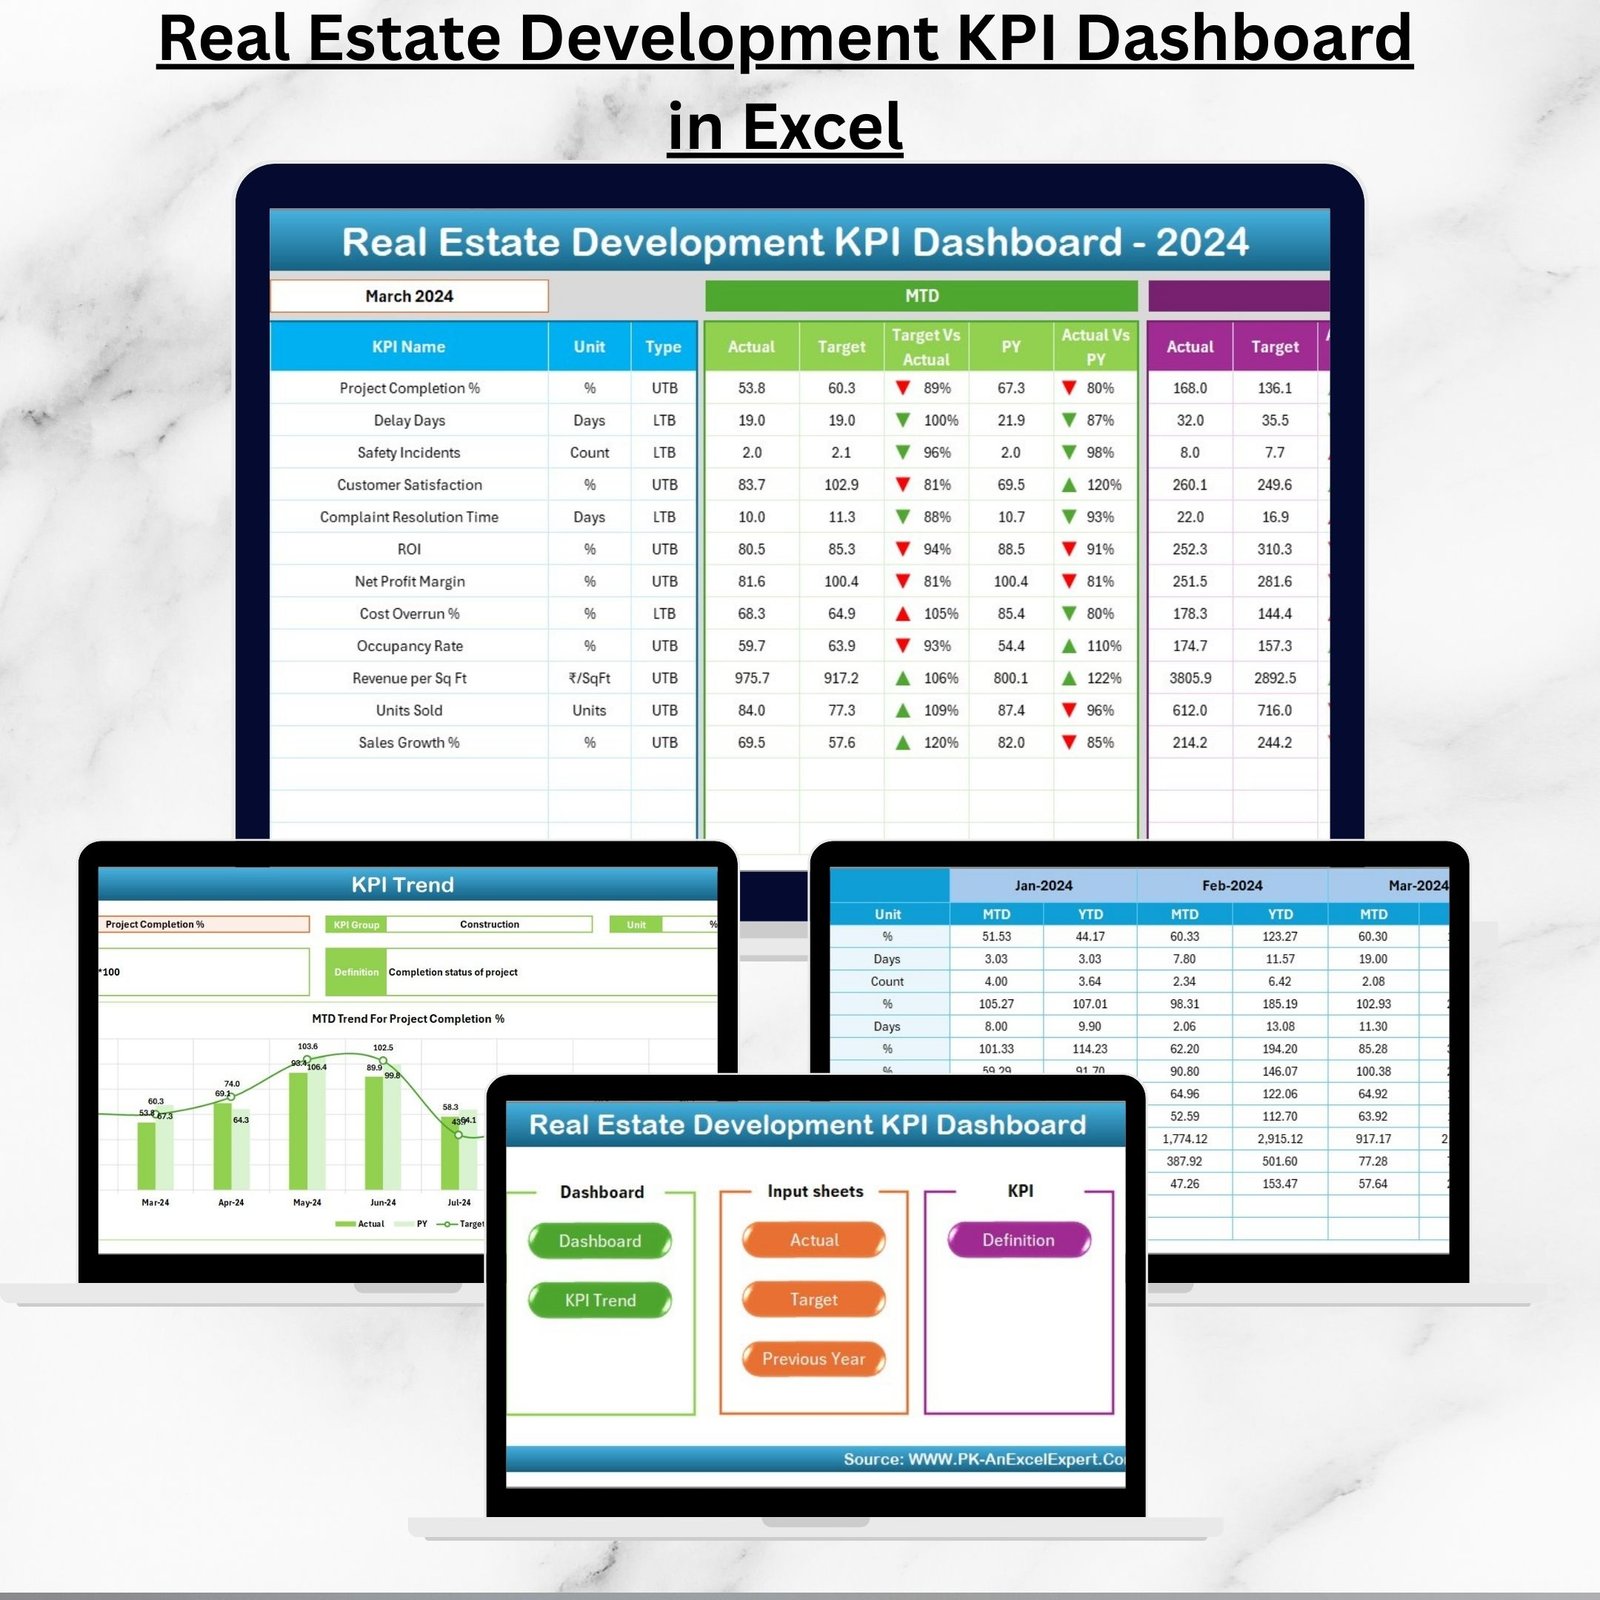
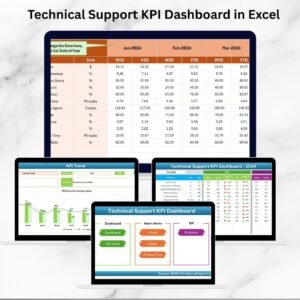
This Excel-based dashboard transforms raw data into actionable insights, giving decision-makers instant access to Month-to-Date (MTD) and Year-to-Date (YTD) KPIs, comparisons with targets, and benchmarks against previous years. Unlike traditional spreadsheets, this tool is dynamic, interactive, and designed to highlight performance gaps in real time.
Whether you’re working on a residential project, commercial space, or large-scale mixed-use development, this dashboard ensures you stay in control of costs, sales, timelines, and customer satisfaction.
✨ Key Features of Real Estate Development KPI Dashboard in Excel
-
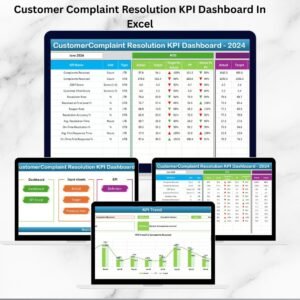
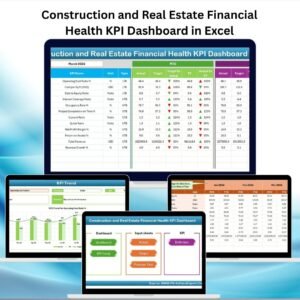
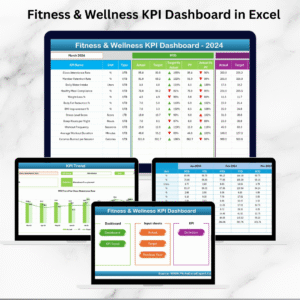
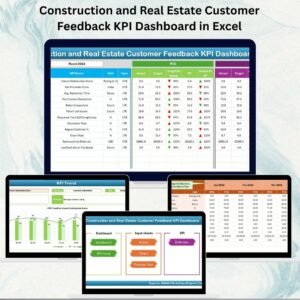
📊 Centralized Dashboard – Track financial, operational, and sales KPIs in one place.
-
⏳ MTD & YTD Comparisons – Monitor short-term and long-term progress instantly.
-
📈 Trend Analysis – Visualize KPI trends with dynamic charts for deeper insights.
-
✔ Conditional Formatting – Red/green arrows instantly highlight underperformance or achievements.
-
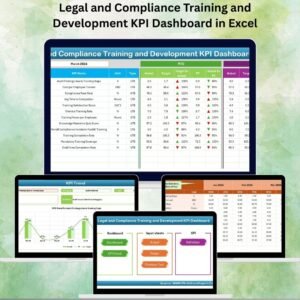
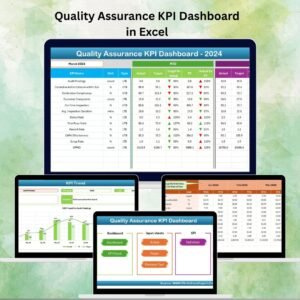
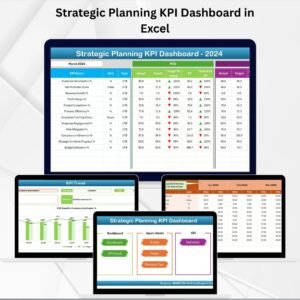
📂 Structured Worksheets – Dedicated tabs for Actuals, Targets, Previous Year Data, Trends, and KPI Definitions.
-
🎯 Customizable KPIs – Add or remove metrics based on your unique project needs.
-
💡 User-Friendly – Simple navigation with drop-down menus, no advanced training required.
-
💸 Cost-Effective – Professional reporting without expensive BI software.
📦 What’s Inside the Real Estate Development KPI Dashboard
This prebuilt template is structured into seven interactive worksheets, each with a unique function:

-
Home Sheet – An index page with navigation buttons for smooth access.
-
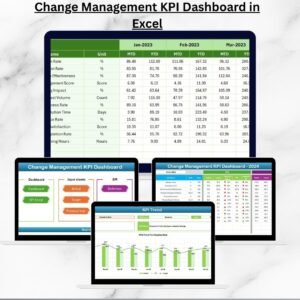
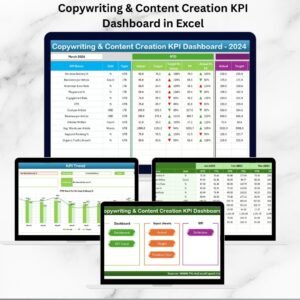
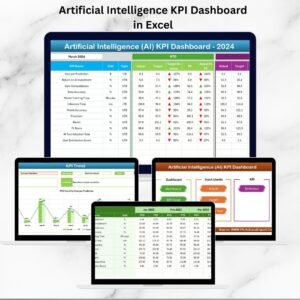
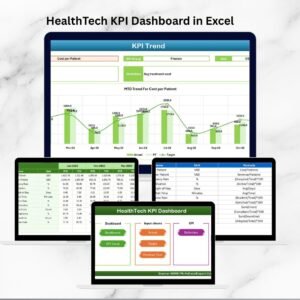
Dashboard Sheet – High-level overview with MTD/YTD performance vs target & PY.
-
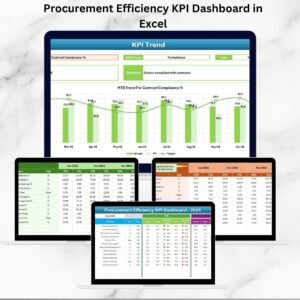
KPI Trend Sheet – Select any KPI to analyze performance trends with charts.
-
Actual Numbers Input Sheet – Enter MTD and YTD project data consistently.
-
Target Sheet – Define monthly and yearly goals for each KPI.
-
Previous Year Sheet – Compare current performance with historical benchmarks.
-
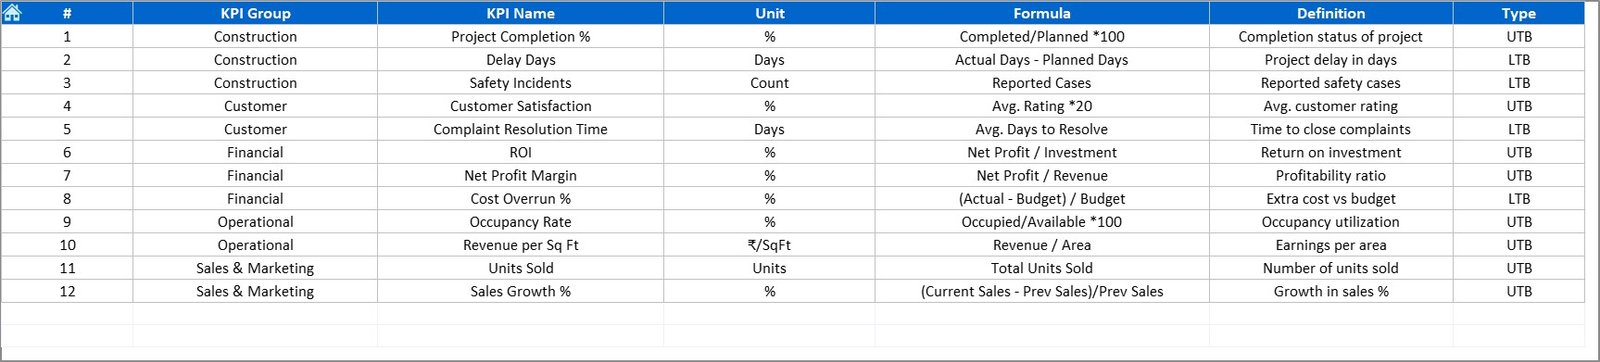
KPI Definition Sheet – Reference library with KPI name, group, unit, formula, and definition.
This structure ensures accuracy, clarity, and complete transparency across your real estate projects.
🛠 How to Use the Real Estate Development KPI Dashboard
-
Enter Actual Data – Record monthly project data in the Actual Numbers sheet.
-
Set Targets – Define benchmarks in the Target sheet for each KPI.
-
Compare vs Previous Year – Track growth trends with YoY comparisons.
-
Review Dashboard – Use the main dashboard for MTD/YTD performance at a glance.
-
Analyze Trends – Identify long-term patterns with the KPI Trend sheet.
-
Take Action – Use insights to adjust budgets, timelines, and sales strategies.
With just a few updates, you’ll have a professional-grade reporting system ready for management and investor presentations.
👥 Who Can Benefit from This Real Estate Development KPI Dashboard
-
🏗 Developers & Project Managers – Track costs, timelines, and construction progress.
-
🏢 Real Estate Companies – Monitor multiple projects with clarity.
-
📊 Financial Analysts – Evaluate project profitability and budget adherence.
-
🏠 Residential Builders – Track unit sales, occupancy, and customer satisfaction.
-
🏬 Commercial Developers – Monitor leasing rates, revenue, and efficiency.
-
💼 Investors & Stakeholders – Gain transparent insights into project performance.
This tool is ideal for both small-scale projects and large enterprises.
📖 Click here to read the Detailed blog post
Visit our YouTube channel to learn step-by-step video tutorials


Reviews
There are no reviews yet.