Are you struggling to manage real estate data across multiple spreadsheets? Finding it difficult to track property listings, analyze regional trends, and monitor agent performance in real time?
Real Estate Dashboard in HTML!
This modern, interactive, and ready-to-use HTML dashboard is designed for real estate professionals, brokers, and analysts who want to simplify data management and gain powerful insights. Instead of dealing with scattered data and manual reports, this dashboard brings everything into one clean, web-based interface.
With dynamic charts, responsive design, and interactive filters, you can instantly analyze property performance, track leads, and monitor sales trends. As a result, you can make faster, smarter, and data-driven decisions that improve efficiency and boost revenue.
🔑 Key Features of Real Estate Dashboard in HTML
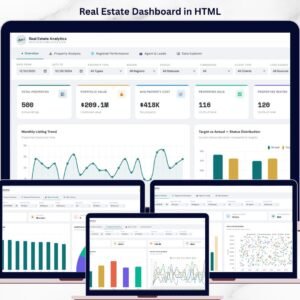
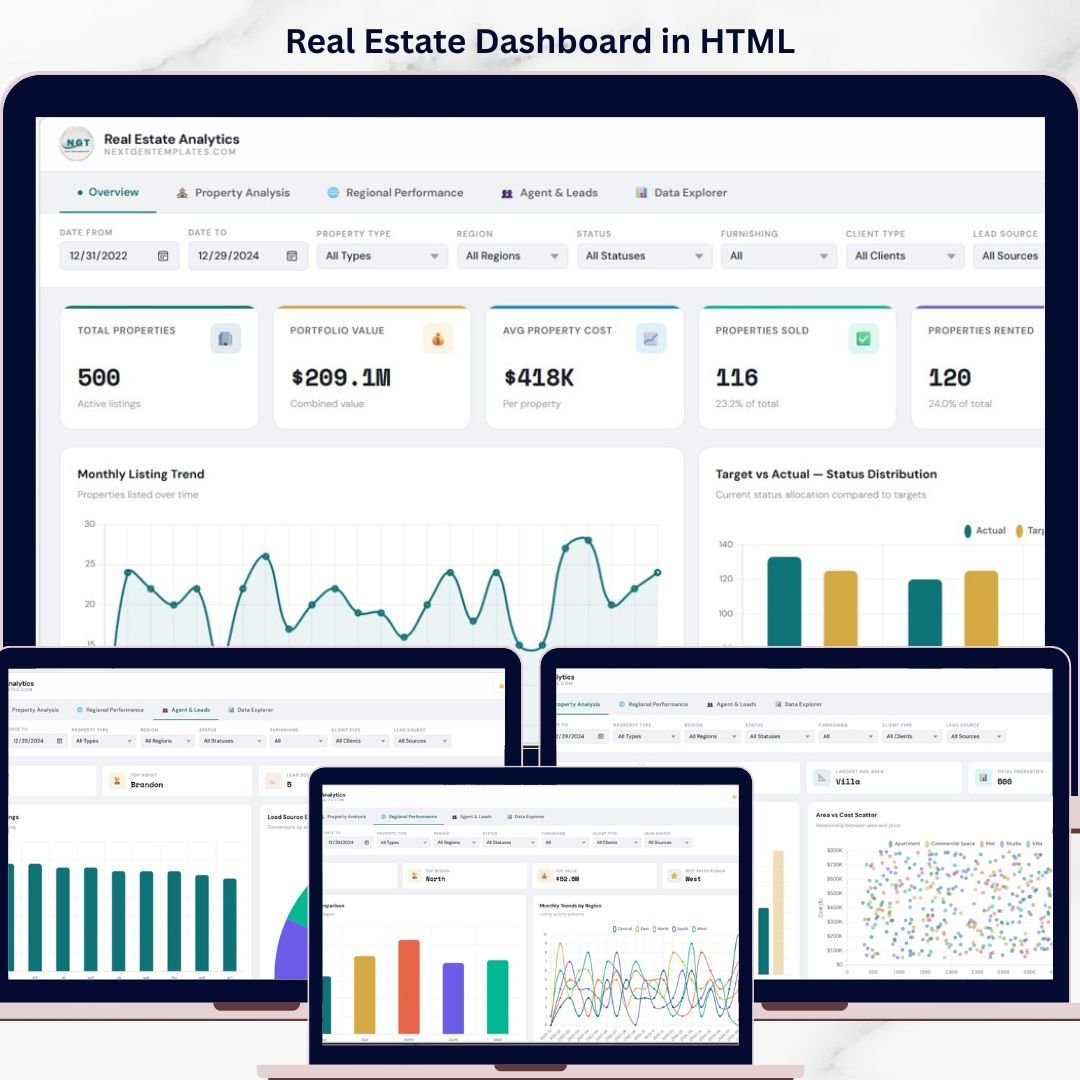
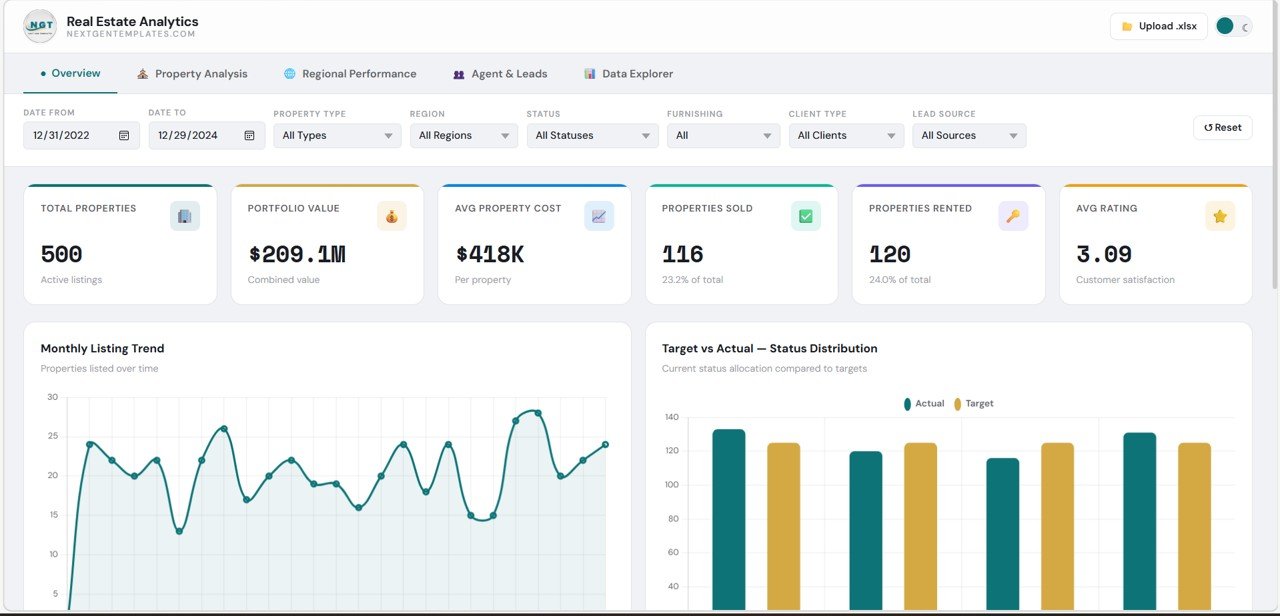
✨ 🏡 Interactive Overview Dashboard – Get a complete snapshot of properties, portfolio value, sales, rentals, and ratings.
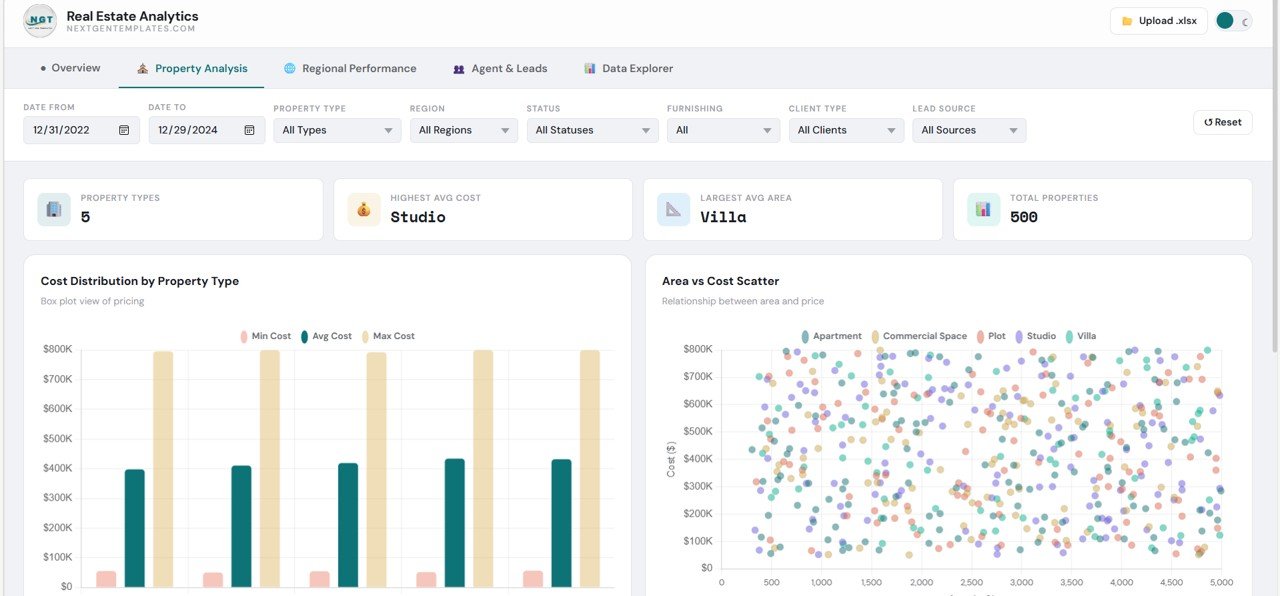
✨ 📊 Property Performance Analysis – Analyze property types, cost distribution, and area vs cost relationships.
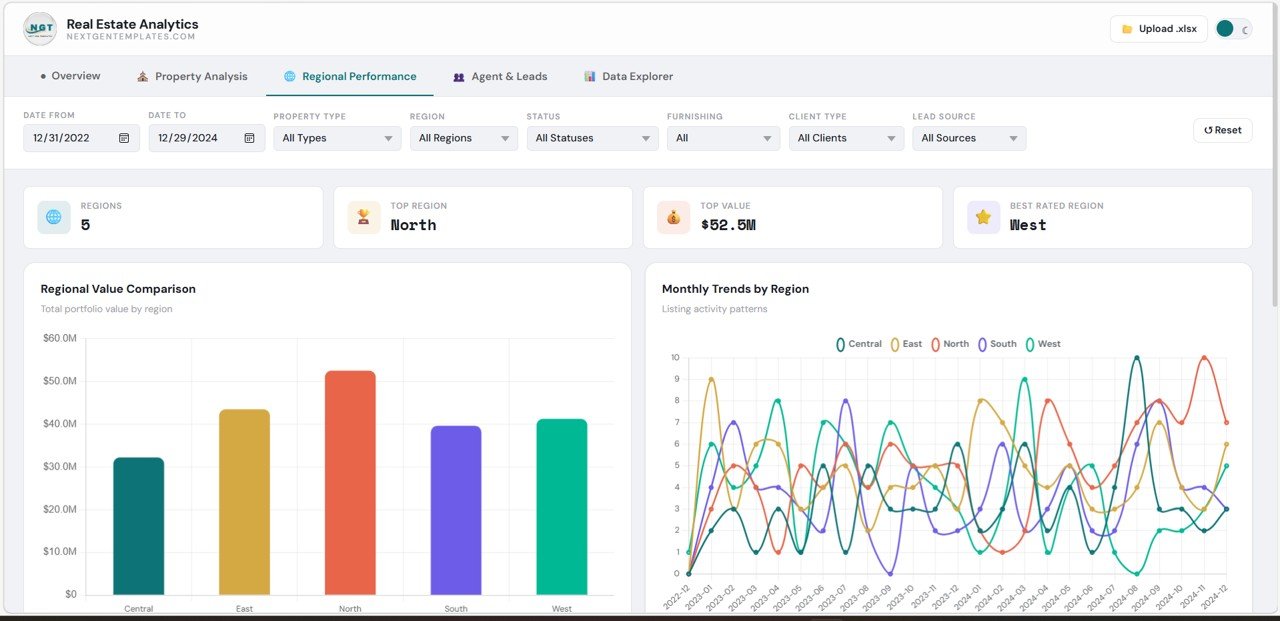
✨ 🌍 Regional Insights – Compare performance across regions and identify top-performing locations.
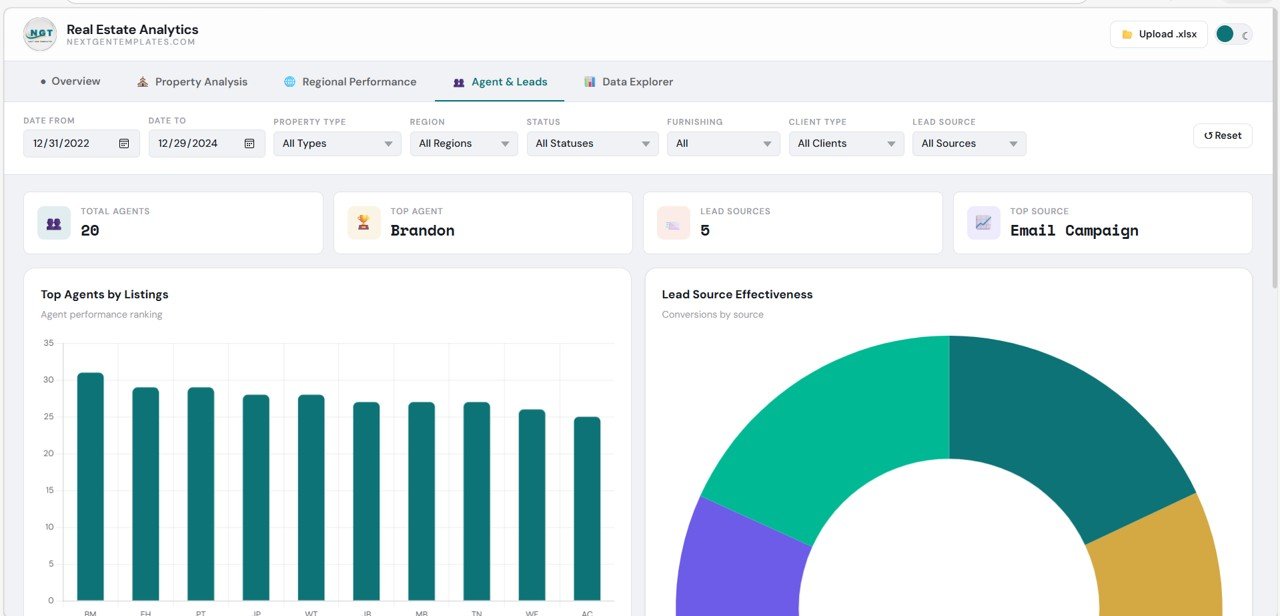
✨ 👥 Agent & Lead Tracking – Monitor agent productivity, lead sources, and conversion performance.
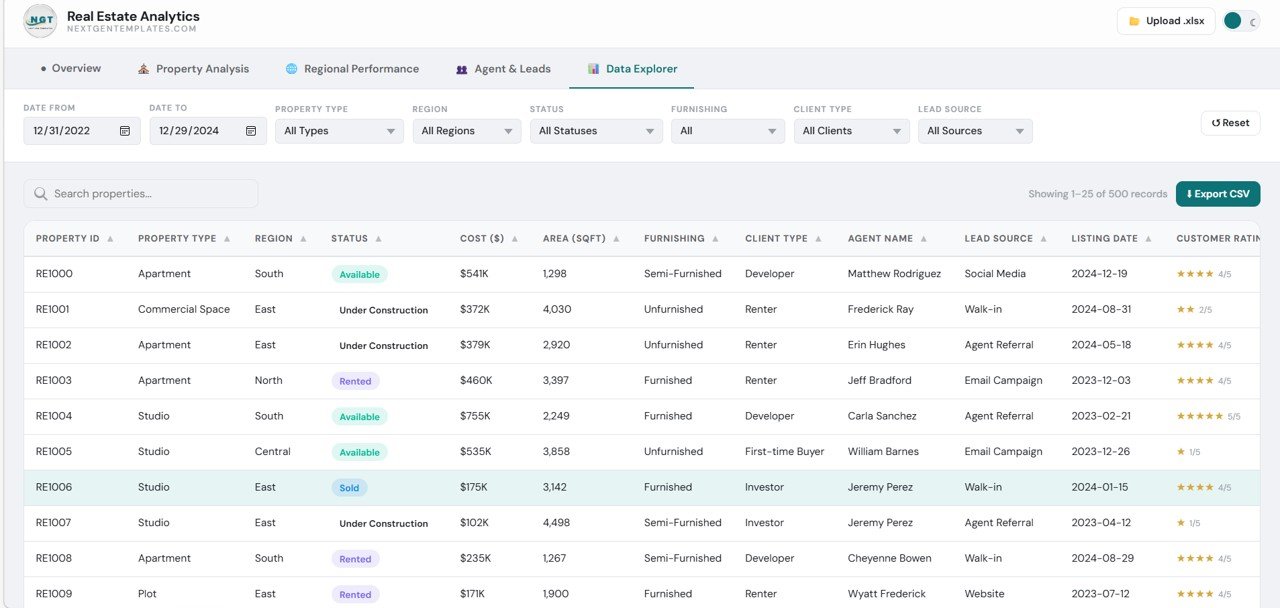
✨ 🔍 Data Explorer Tool – Search, filter, and explore detailed property-level data with ease.
✨ ⚡ Dynamic Filters & Charts – Apply filters instantly to analyze data in real time.
✨ 🎯 Modern Web-Based Design – Clean, responsive, and user-friendly interface for better experience.
📂 What’s Inside the Real Estate Dashboard in HTML
📁 Overview Section – KPI cards and charts showing business performance and trends.
📁 Property Analysis Section – Detailed insights into property types, cost distribution, and area analysis.
📁 Regional Performance Section – Analyze location-based trends and regional comparisons.
📁 Agent & Leads Section – Track agent performance and lead generation sources.
📁 Data Explorer Section – Advanced table with filtering, searching, and CSV export features.
📁 Responsive HTML Interface – Fully interactive and visually appealing dashboard design.
🛠️ How to Use the Real Estate Dashboard in HTML
👉 Step 1: Upload or connect your dataset
👉 Step 2: Open the dashboard in your browser
👉 Step 3: Apply filters (region, property type, date)
👉 Step 4: Analyze KPIs, charts, and trends
👉 Step 5: Export data or insights if needed
💡 No complex setup required—simple, fast, and powerful!
👥 Who Can Benefit from This Real Estate Dashboard in HTML
✔️ Real Estate Companies – Monitor overall business performance
✔️ Brokers & Agents – Track listings, leads, and sales performance
✔️ Business Analysts – Analyze trends and generate insights
✔️ Property Managers – Manage property data efficiently
✔️ Investors – Identify profitable opportunities and trends
This dashboard is more than just a reporting tool—it’s a complete real estate analytics solution. It helps you identify top-performing regions, optimize property strategies, and improve lead conversions with ease.
If you want to reduce manual work, gain real-time insights, and grow your real estate business faster, this dashboard is the perfect choice.