

The Push Notification KPI Dashboard in Excel is a must-have tool for digital marketers, product managers, and app developers who want to track and optimize the performance of their push notification campaigns. This customizable Excel-based dashboard helps you monitor key performance indicators (KPIs) related to your push notifications, allowing you to evaluate engagement, reach, click-through rates (CTR), and conversion rates.
With real-time data tracking, this dashboard provides insights into how your push notifications are performing and where improvements can be made. Whether you are sending promotional offers, updates, or reminders, this tool ensures you can easily measure the effectiveness of your campaigns and improve customer engagement over time.
Key Features of the Push Notification KPI Dashboard in Excel
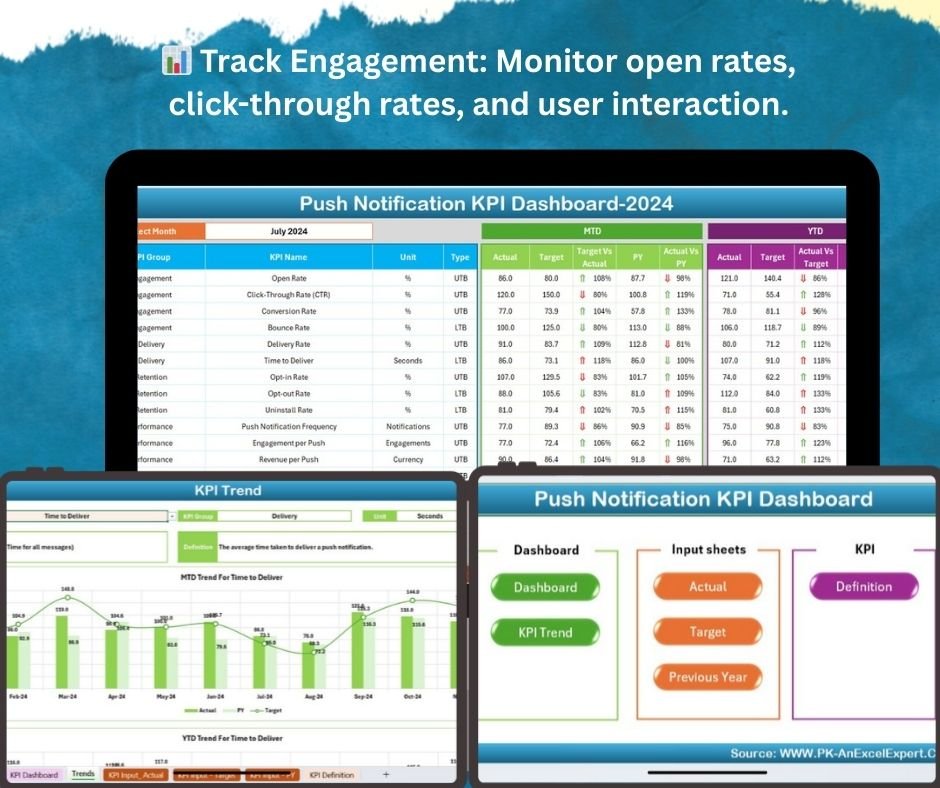
📊 Track Engagement Metrics
Monitor key KPIs like open rates, click-through rates (CTR), and engagement levels for each push notification. Track how users are interacting with your notifications to improve future campaigns.
📅 Campaign Performance Monitoring
Track performance across multiple campaigns and compare results to see which campaigns are driving the most engagement. Assess user behavior patterns and optimize notifications for better results.
📈 Real-Time Analytics
Get real-time data on push notification performance. See how many notifications were sent, how many were opened, and how many resulted in a conversion, all updated automatically for up-to-date analysis.
🔍 Conversion Rate Tracking
Track conversions from push notifications, such as app installs, purchases, or other key actions. Measure the impact of each notification on your business objectives and optimize your strategy accordingly.
🖥️ User Segmentation & Targeting
Visualize the performance of push notifications across different user segments, such as demographics, user behavior, or geographic location. Understand which segments are engaging the most with your notifications.
📊 Visual Data Insights & Reports
Use graphs and charts to visualize push notification trends, compare KPIs, and generate reports to share with stakeholders or use in presentations. Data is displayed in an easy-to-understand format.
Why You’ll Love the Push Notification KPI Dashboard in Excel

✅ Optimize Push Notification Campaigns
Track the performance of your push notifications and adjust your strategy based on real-time insights. Improve user engagement and conversion rates by analyzing key metrics.
✅ Gain Data-Driven Insights
Make informed decisions by tracking how users interact with your notifications. Use the data to fine-tune your messaging, timing, and targeting to achieve better results.
✅ Increase Engagement & Conversions
Understand which push notifications are working and why. Use these insights to optimize your content and improve user engagement, ultimately driving higher conversion rates.
✅ Simplify Campaign Reporting
Generate quick and easy reports on the performance of your push notification campaigns. Share insights with your team or stakeholders using visually appealing graphs and data visualizations.
✅ Customizable & Scalable
Tailor the dashboard to fit the specific needs of your campaigns. Whether you’re tracking one notification or managing multiple campaigns, this template adapts to your growing needs.
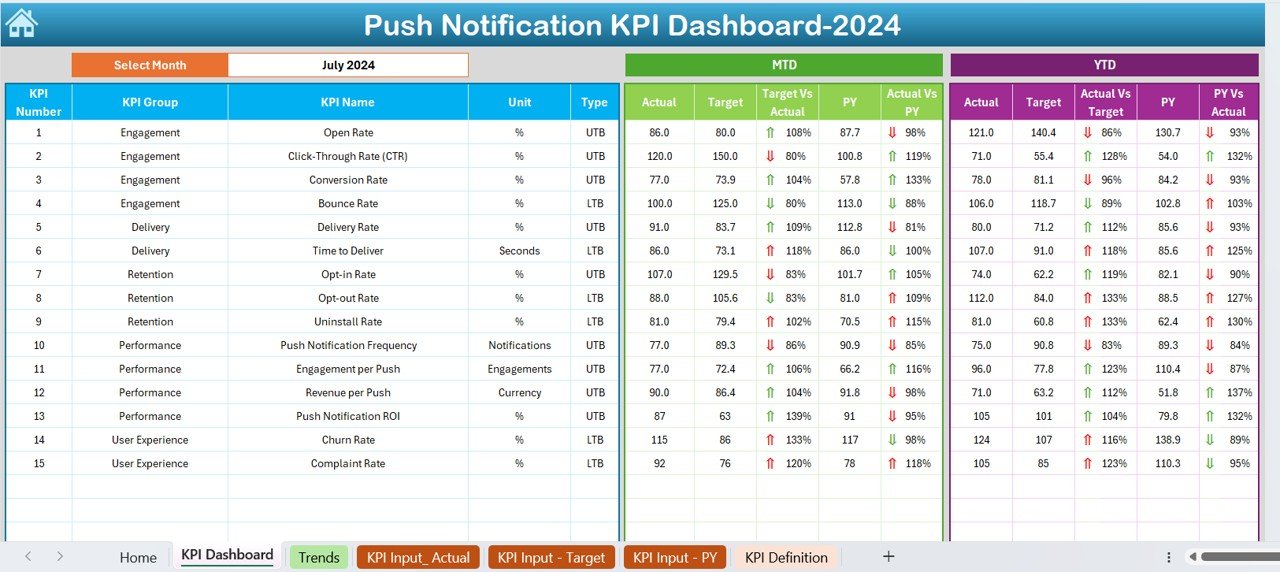
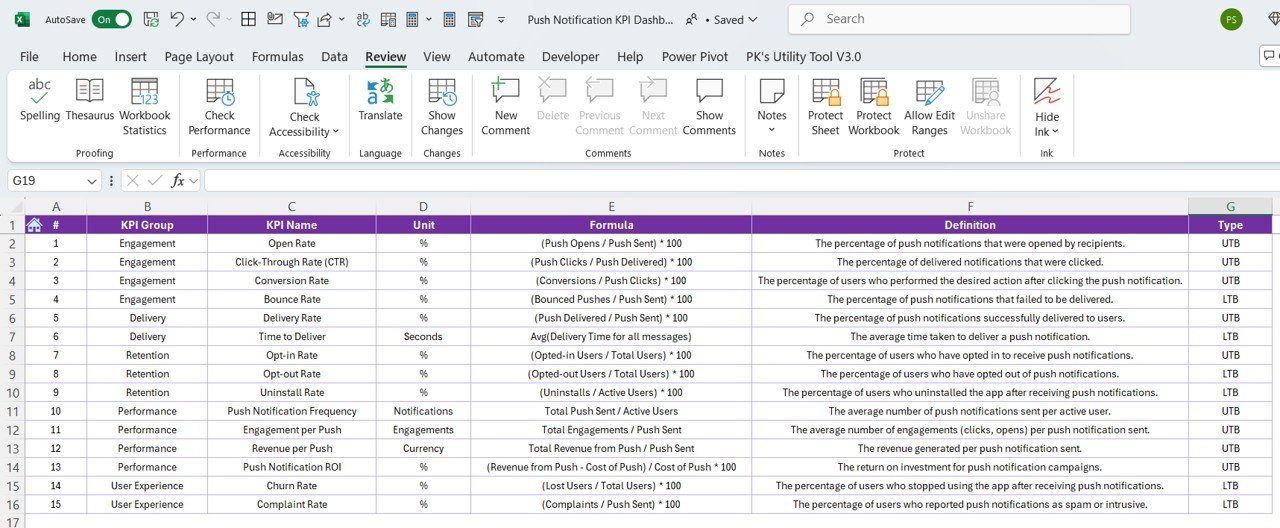
What’s Inside the Push Notification KPI Dashboard Template in Excel?
- Engagement Metrics: Track KPIs such as open rates, CTR, and user interactions.
- Campaign Performance: Compare the performance of multiple push notification campaigns.
- Conversion Tracking: Measure how many conversions occurred due to push notifications.
- User Segmentation: Visualize performance across different user segments.
- Real-Time Data & Reports: Get real-time insights and generate automated reports.
- Customizable KPIs: Modify KPIs and reporting fields to match your specific notification goals.
How to Use the Push Notification KPI Dashboard in Excel
1️⃣ Download the Template: Gain immediate access to the Push Notification KPI Dashboard in Excel.
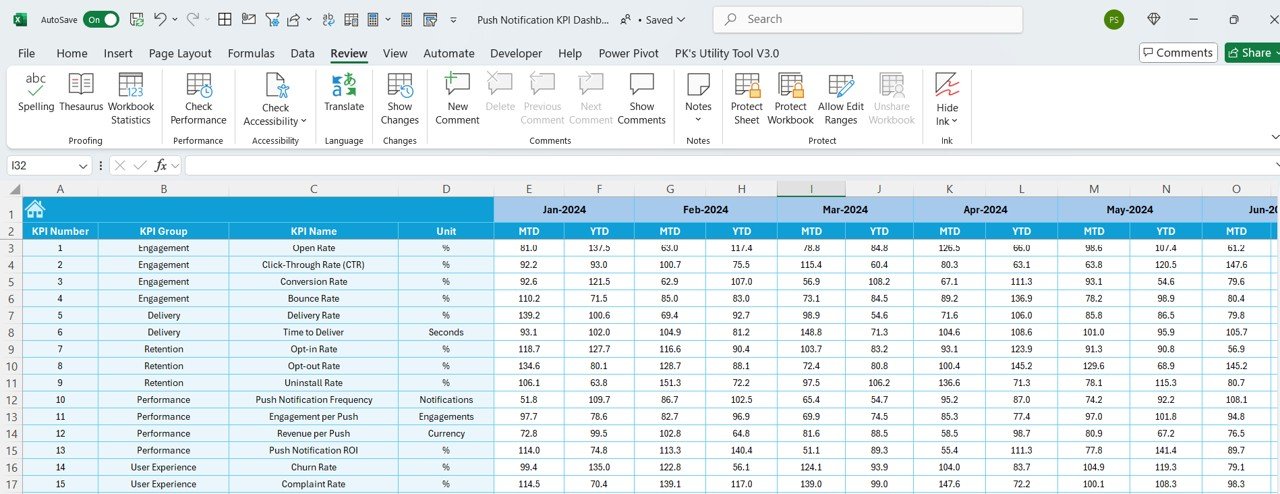
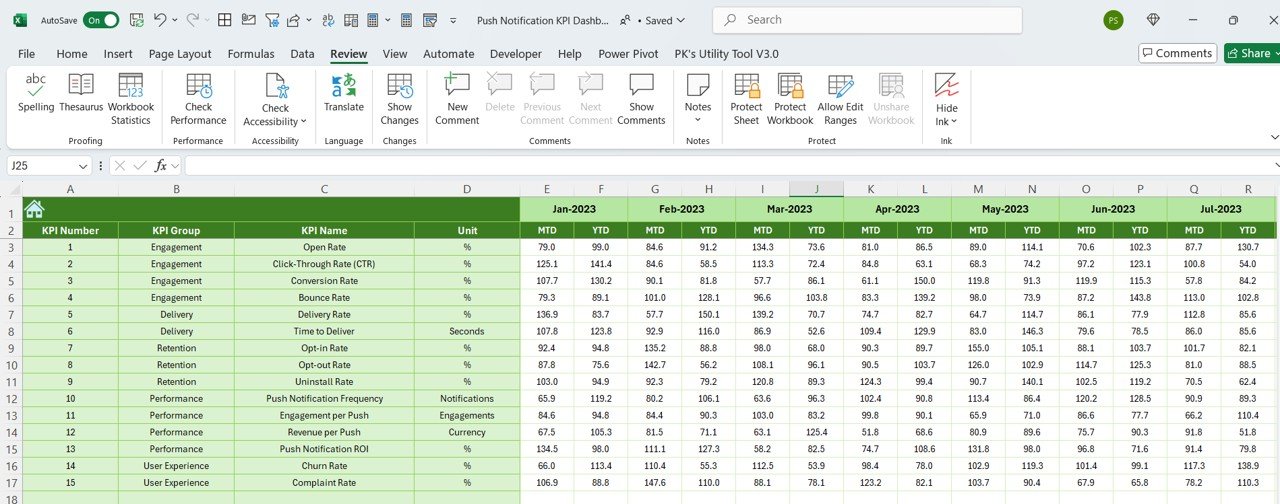
2️⃣ Input Campaign Data: Enter your push notification data, including open rates, CTR, conversions, and more.
3️⃣ Track & Monitor KPIs: Use the dashboard to track key metrics for each push notification campaign.
4️⃣ Analyze & Optimize: Identify high-performing campaigns and optimize those that need improvement.
5️⃣ Generate Reports & Share Insights: Use the reports and charts to present campaign performance to your team or stakeholders.
Who Can Benefit from the Push Notification KPI Dashboard in Excel?
🔹 Digital Marketers & Campaign Managers
🔹 Product Managers & App Developers
🔹 Mobile App Teams & SaaS Companies
🔹 Marketing Analysts & Consultants
🔹 E-commerce & Retail Businesses
🔹 Customer Engagement & Retention Teams
Measure and improve the effectiveness of your push notifications with the Push Notification KPI Dashboard in Excel. Track key metrics, optimize campaigns, and drive better user engagement and conversions.
Click here to read the Detailed blog post
Visit our YouTube channel to learn step-by-step video tutorials
Youtube.com/@PKAnExcelExpert


Reviews
There are no reviews yet.