
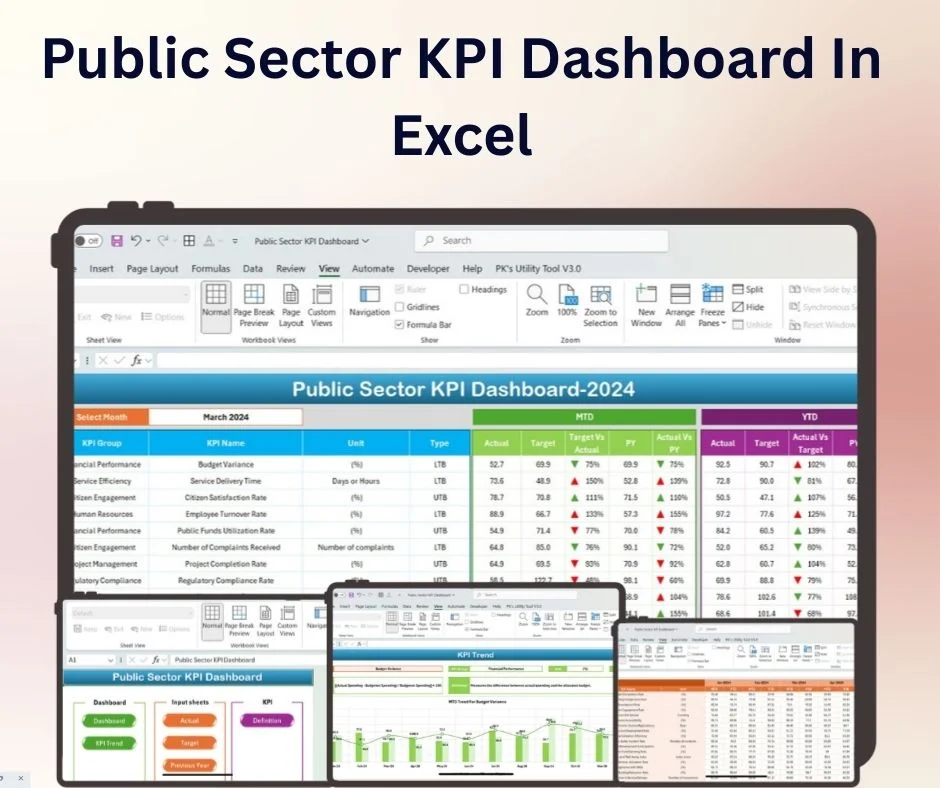

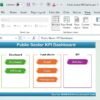
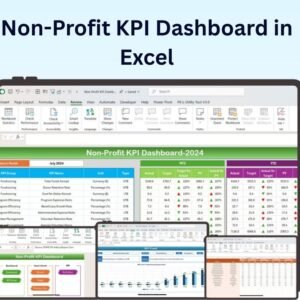
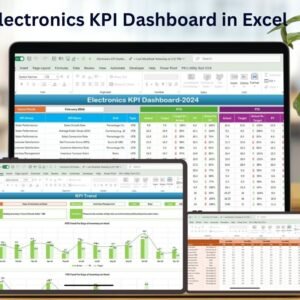
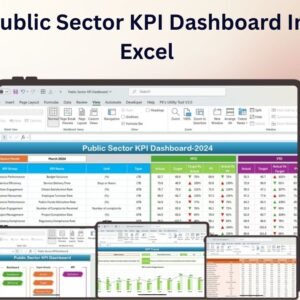
The Public Sector KPI Dashboard in Excel is a comprehensive and user-friendly tool designed specifically for public sector organizations to effectively track and analyze key performance indicators (KPIs). Whether you’re a government agency, non-profit organization, or public service provider, this Excel dashboard offers a clear, data-driven approach to improving performance and driving accountability.
By using this dashboard, public sector professionals can easily monitor vital metrics such as budget allocation, service delivery effectiveness, public satisfaction, and resource utilization. With visually intuitive charts, real-time data updates, and customizable features, this dashboard helps you make informed decisions, optimize operations, and enhance public service delivery.

Key Features of the Public Sector KPI Dashboard in Excel:
 Real-Time KPI Tracking
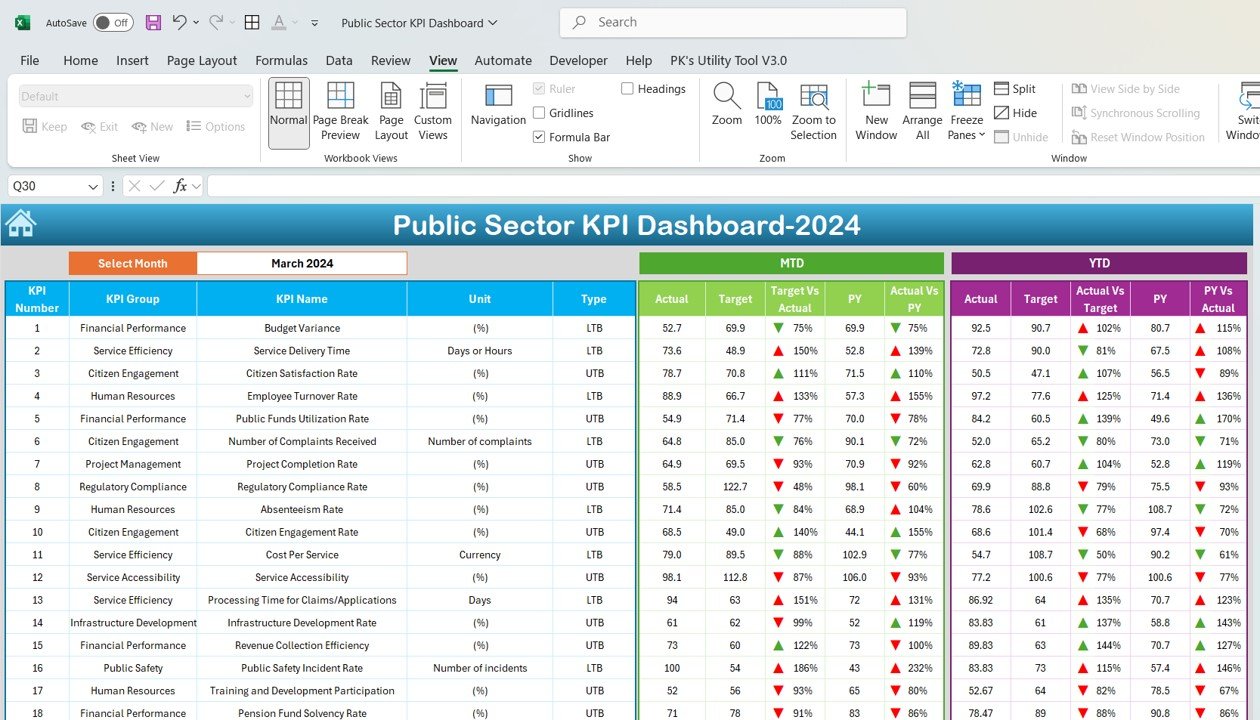
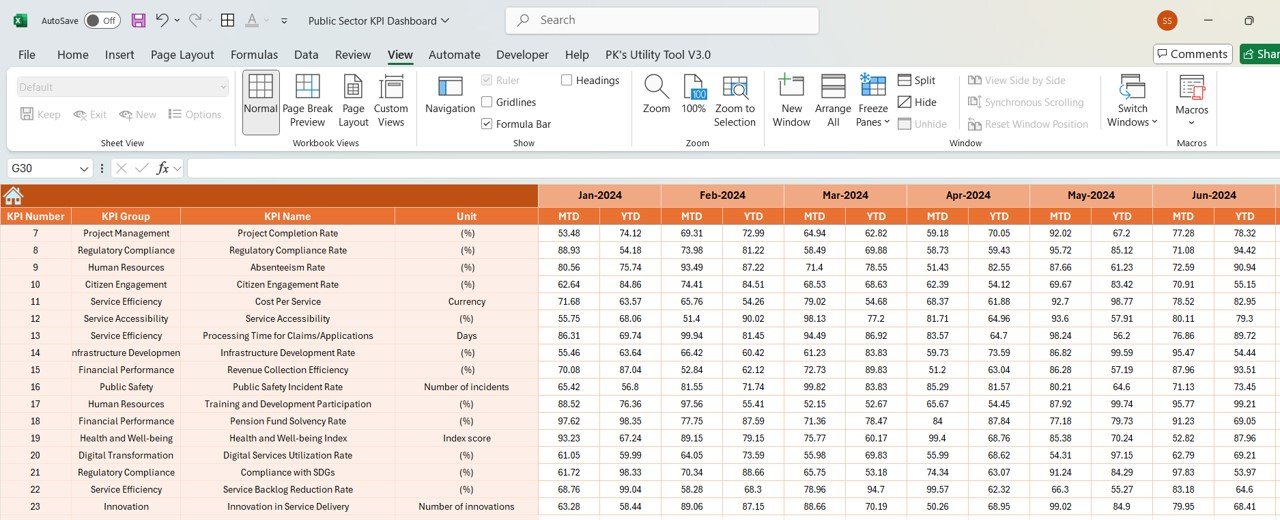
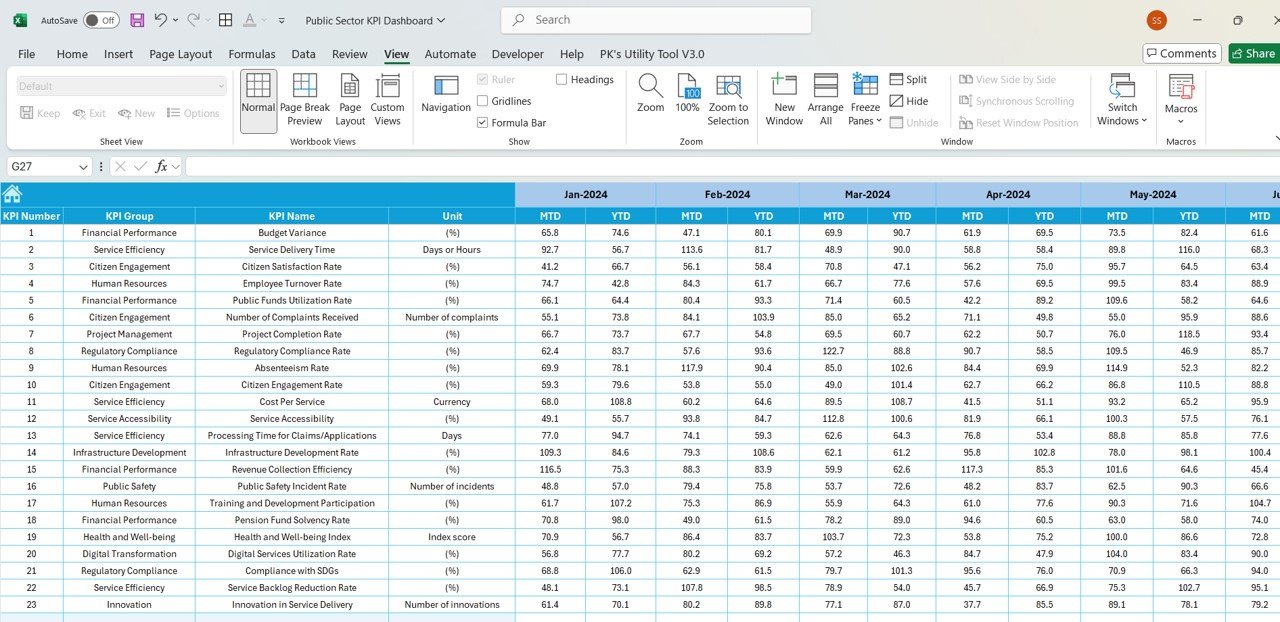
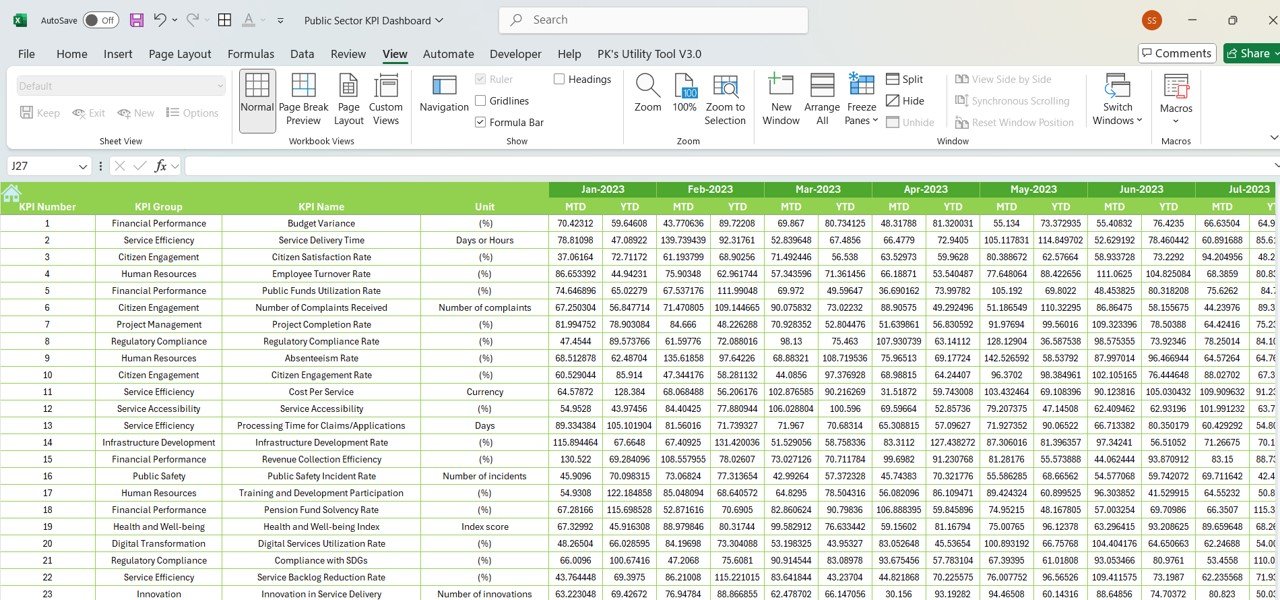
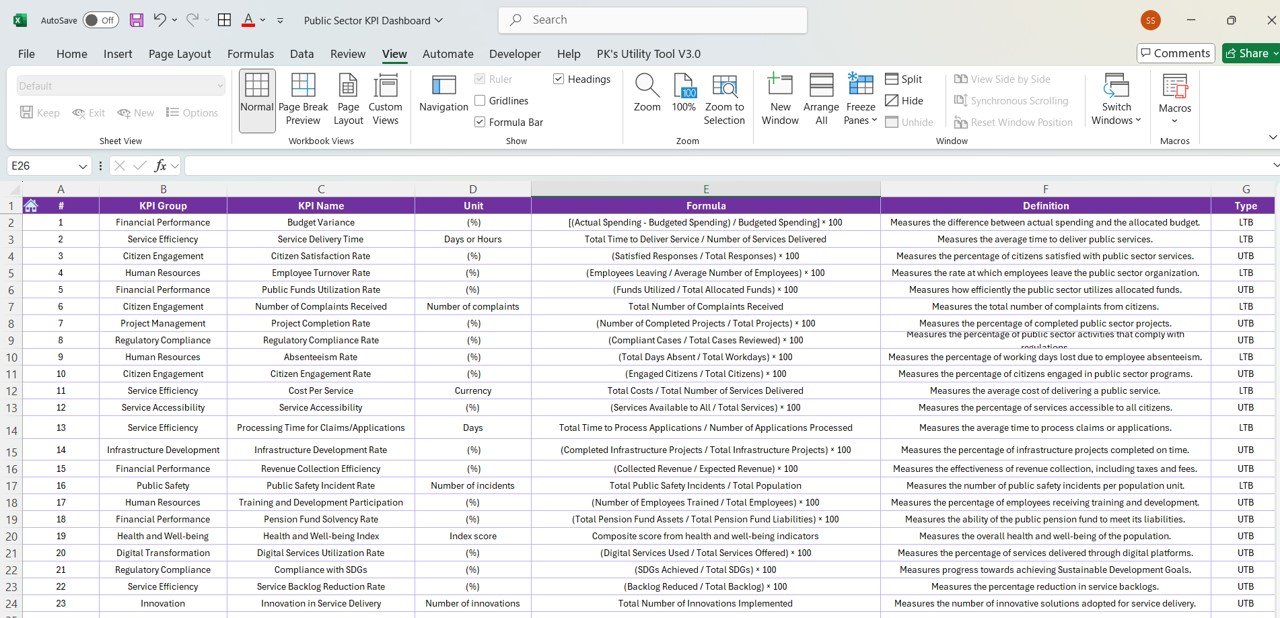
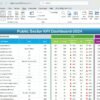
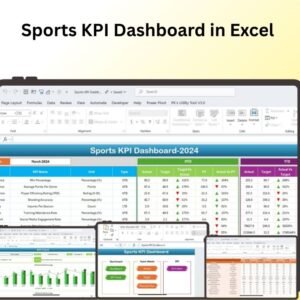
Track a wide range of public sector KPIs, such as budget utilization, project completion rates, public satisfaction, and resource allocation—all in one easy-to-use dashboard.
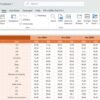
 Month-to-Date (MTD) and Year-to-Date (YTD) Analysis
Get a detailed, up-to-date view of your organization’s performance throughout the year, and track how you’re meeting goals and objectives.
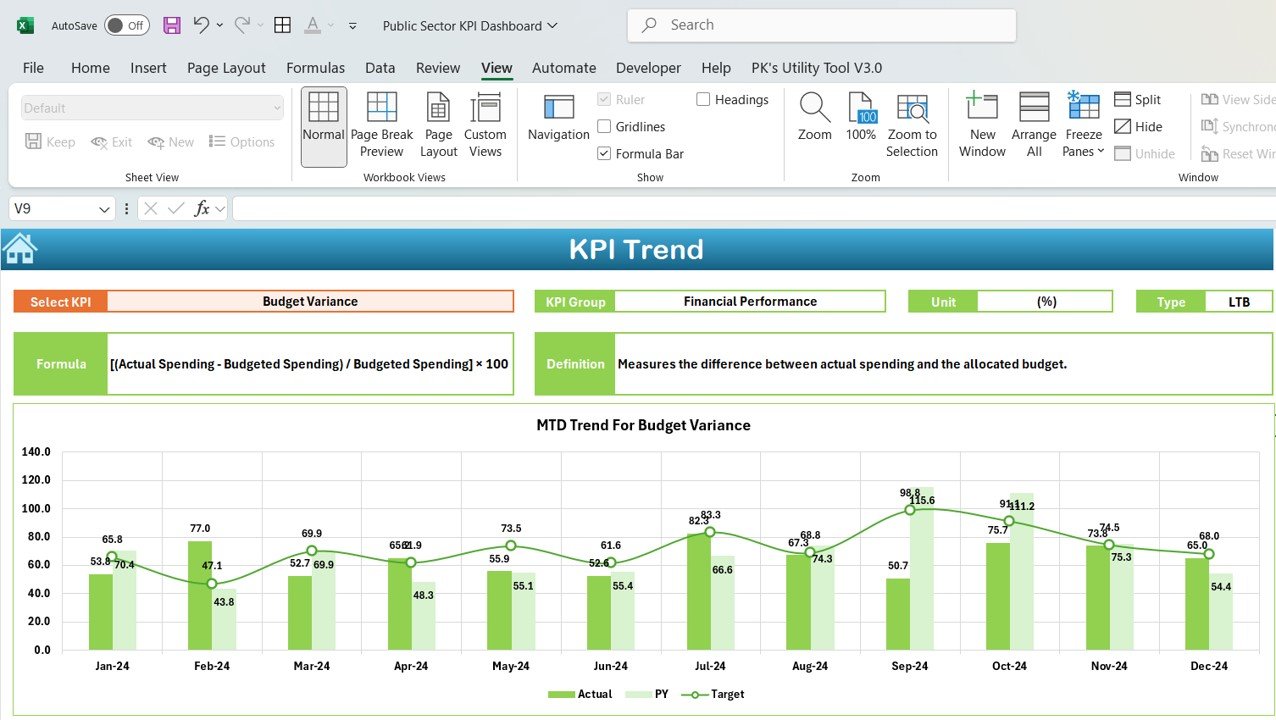
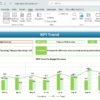
 Interactive Trend Analysis
Visualize trends over time with dynamic charts and graphs, making it easier to see patterns, identify areas for improvement, and spot potential issues.
 Goal Setting & Performance Comparison
Set specific targets for each KPI and compare them to actual performance. This feature helps ensure that your public sector projects are on track to meet their objectives.
 Customizable Inputs
Tailor the dashboard to suit your organization’s specific goals by adjusting the KPIs and data inputs to match your unique performance metrics.
 Conditional Formatting Alerts
Automatically receive color-coded alerts to quickly identify areas where performance is exceeding expectations (green), meeting expectations (yellow), or falling behind (red).
 Budget and Resource Management
Track budget allocation and resource utilization to ensure that funds are being spent efficiently and that resources are being utilized optimally.
 Why You’ll Love the Public Sector KPI Dashboard in Excel:
 Data-Driven Decision Making – Empower public sector professionals to make informed, data-driven decisions with up-to-date, accurate performance tracking. Improved Accountability – Clearly track progress towards goals and ensure that all public sector projects stay on track and within budget. Enhanced Public Service Delivery – Optimize the efficiency and effectiveness of public sector programs by identifying areas for improvement. User-Friendly Design – The intuitive layout makes it easy for non-technical users to understand and operate, ensuring quick adoption. Fully Customizable – Modify the dashboard to track any KPIs that are unique to your public sector organization’s needs.
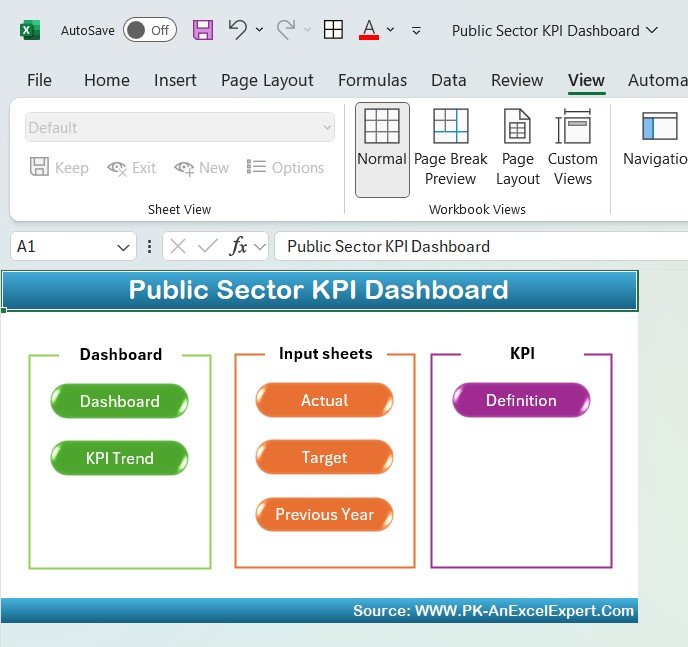
What’s Inside the Public Sector KPI Dashboard in Excel:
- Budget Utilization KPI: Track the expenditure against the allocated budget to ensure that funds are being used appropriately.
- Service Delivery KPI: Measure the effectiveness of public service delivery by tracking the completion of projects, services rendered, and efficiency.
- Public Satisfaction KPI: Assess the level of satisfaction among citizens or stakeholders by tracking surveys and feedback.
- Resource Allocation KPI: Monitor the distribution and utilization of resources to ensure that they are being used efficiently.
- Project Completion Rate KPI: Track the percentage of completed projects against planned projects to evaluate overall performance.
How to Use the Public Sector KPI Dashboard in Excel:
 Download the Template – Gain instant access to the Excel file upon purchase.
 Input Your Data – Enter your public sector data into the pre-designed input fields in the template.
 Set Targets – Define your KPI targets and goals based on your organization’s objectives.
 Track Progress – Monitor your progress in real time and adjust strategies as needed to meet your targets.
 Generate Reports – Use the dashboard to generate detailed reports for internal reviews or stakeholder presentations.
Who Can Benefit from the Public Sector KPI Dashboard in Excel:
- Government Agencies
- Non-Profit Organizations
- Public Service Providers
- City Planners and Local Governments
- Public Sector Managers and Administrators
- Public Health Organizations
- Policy Makers
This Public Sector KPI Dashboard in Excel is an invaluable tool for any public sector organization looking to improve performance, drive efficiency, and increase accountability. Stay on top of key metrics and make data-backed decisions to better serve the public.
Click here to read the Detailed blog post
https://www.pk-anexcelexpert.com/public-sector-kpi-dashboard-in-excel/
Visit our YouTube channel to learn step-by-step video tutorials
Youtube.com/@PKAnExcelExpert


Reviews
There are no reviews yet.