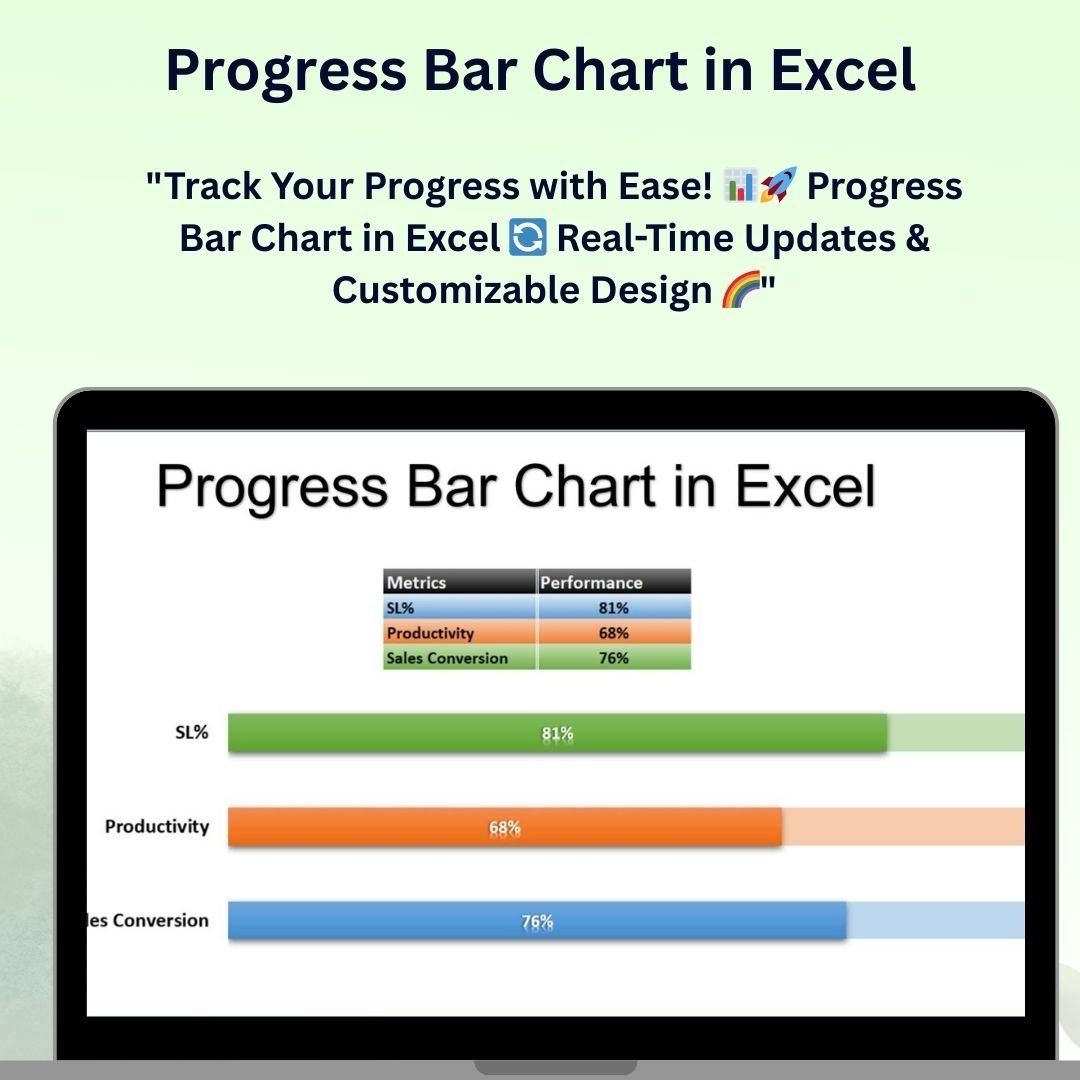
The Progress Bar Chart in Excel is an intuitive and visually impactful tool designed to help you track and display progress towards specific goals or milestones. Whether you’re monitoring project progress, sales targets, or team performance, this chart provides a simple yet effective way to visualize progress in real-time. With fully customizable features, you can tailor the chart to fit your specific needs, making it an ideal solution for individuals, businesses, and teams.
The Progress Bar Chart is created using Excel’s built-in features, allowing you to track performance, monitor completion percentages, and compare progress across different tasks or goals. Its clean and straightforward design ensures that you can easily interpret the data and communicate progress to stakeholders with clarity.
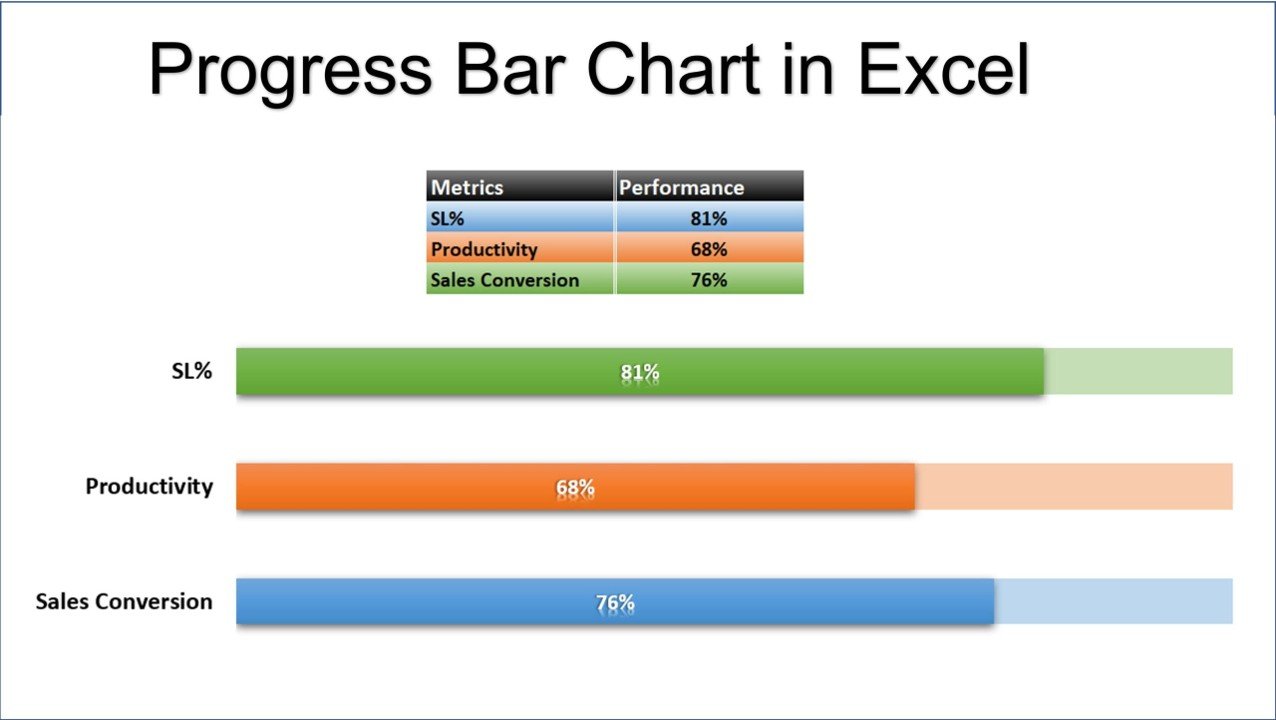
Key Features of the Progress Bar Chart in Excel
📌 Simple and Effective Progress Tracking
Easily track progress towards goals or milestones with a simple, visual progress bar. Whether for individual tasks, projects, or team goals, this chart provides an easy way to monitor progress and see how close you are to achieving your target.
🛠 Customizable Design
The progress bar chart is fully customizable, allowing you to adjust the design, colors, and layout to suit your needs. You can choose colors to represent different stages (e.g., red for low progress, green for high progress) or match the chart to your company’s branding.
💡 Real-Time Data Updates
As you input new data, the progress bar automatically updates, giving you a real-time view of your progress. This feature ensures that you always have the most up-to-date information without needing to manually adjust the chart.
🔢 Track Multiple Goals or Tasks
You can create multiple progress bars in one Excel sheet, allowing you to track and compare progress across several goals, tasks, or projects. This is perfect for teams or individuals working on several objectives simultaneously.
🚀 Clear and Simple Visuals
The chart is designed to be clean and easy to understand. With a simple progress bar layout, you can quickly assess the status of any goal, making it easier to communicate progress in reports or meetings.
📊 No Additional Software Required
The progress bar chart is built entirely within Excel using its native features, so there’s no need for additional software or plugins. This makes it a cost-effective and easy-to-implement solution.
⚙ Easy Setup and Customization
Setting up the progress bar chart is quick and simple. With clear instructions provided, you can create your chart in minutes and customize it to fit your needs.
🚀 Why You’ll Love the Progress Bar Chart in Excel
✅ Track Progress Visually – Easily track goals, tasks, and project milestones with a visual progress bar. ✅ Real-Time Updates – The progress bar automatically adjusts as new data is entered. ✅ Customizable Design – Modify colors, labels, and data points to fit your specific needs. ✅ Track Multiple Goals – Compare progress across different projects, tasks, or goals. ✅ Simple and Easy to Use – Quick setup and easy-to-follow instructions for fast implementation.
📂 What’s Inside the Progress Bar Chart in Excel?
- Progress Bar Chart: A visual representation of progress towards goals or milestones.
- Customizable Features: Adjust colors, labels, and layouts to fit your specific needs.
- Real-Time Data Updates: Watch the chart adjust automatically as data is entered.
- Multiple Progress Bars: Track several tasks, projects, or goals in one sheet.
- Simple Setup Instructions: Easy-to-follow steps to get the chart up and running quickly.
🔍 How to Use the Progress Bar Chart in Excel
1️⃣ Download the Template – Instant access to the Excel file upon purchase. 2️⃣ Input Your Data – Enter your progress data, and watch the chart update in real-time. 3️⃣ Customize the Chart – Modify the color scheme, labels, and layout to match your needs. 4️⃣ Track and Monitor Progress – Use the progress bar to track and compare progress across multiple goals or tasks. 5️⃣ Present and Share – Use the progress bar chart in reports, presentations, or dashboards to showcase progress.
🎯 Who Can Benefit from the Progress Bar Chart in Excel? 🔹 Project Managers
🔹 Business Owners
🔹 Sales Teams
🔹 Marketing Teams
🔹 HR and Operations Teams
🔹 Anyone tracking goals, projects, or performance metrics
Track your goals, projects, and tasks with the Progress Bar Chart in Excel. With real-time updates, easy customization, and visual progress tracking, this tool will help you stay on top of your objectives and keep your team focused on achieving success.
Click here to read the Detailed blog post
https://www.pk-anexcelexpert.com/progress-bar-chart-in-excel/


&url=https://nextgentemplates.com/product/info-graphics-with-column-chart-part-1/&media=https://nextgentemplates.com/wp-content/uploads/2025/03/Info-graphics-with-Column-chart-Part-1-1024x1024.jpg)
&url=https://nextgentemplates.com/product/spotlight-visualization-in-excel-part-1/&media=https://nextgentemplates.com/wp-content/uploads/2025/03/Spotlight-Visualization-in-Excel-Part-1-1024x1024.jpg)
&url=https://nextgentemplates.com/product/info-graphics-with-column-chart-part-2/&media=https://nextgentemplates.com/wp-content/uploads/2025/03/Info-graphics-with-Column-chart-Part-2-1024x1024.jpg)
&url=https://nextgentemplates.com/product/analog-clock-in-excel-pie-chart-doughnut-chart/&media=https://nextgentemplates.com/wp-content/uploads/2025/03/Analog-Clock-in-Excel-Pie-Chart-Doughnut-Chart-1-1.jpg)
&url=https://nextgentemplates.com/product/informative-kpi-indicator-chart-version-1/&media=https://nextgentemplates.com/wp-content/uploads/2025/03/Informative-KPI-Indicator-Chart-Version-1-1024x1024.jpg)
&url=https://nextgentemplates.com/product/informative-kpi-indicator-chart-version-2/&media=https://nextgentemplates.com/wp-content/uploads/2025/03/Informative-KPI-Indicator-Chart-Version-2-1024x1024.jpg)
&url=https://nextgentemplates.com/product/spotlight-visualization-in-excel-part-2/&media=https://nextgentemplates.com/wp-content/uploads/2025/03/Spotlight-Visualization-in-Excel-Part-2.jpg)
Reviews
There are no reviews yet.