Launching a new product is exciting. However, without structured tracking, even the most innovative product can struggle to succeed. Many businesses collect launch data, yet they fail to convert it into meaningful insights. As a result, teams delay decisions, miss growth opportunities, and lose competitive advantage.
That is exactly why the Product Launch KPI Dashboard in Google Sheets is an essential tool for modern businesses.
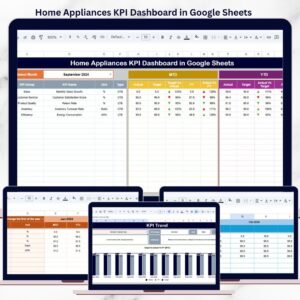
This powerful, ready-to-use dashboard gives you a centralized and interactive system to monitor your product launch performance in real time. Instead of managing scattered spreadsheets, you can track sales, marketing impact, operational efficiency, and customer response — all from one dynamic Google Sheets interface.
Because the dashboard is built in Google Sheets, your teams can collaborate live from anywhere, ensuring faster alignment and smarter decisions.
🚀 Key Feature of Product Launch KPI Dashboard in Google Sheets
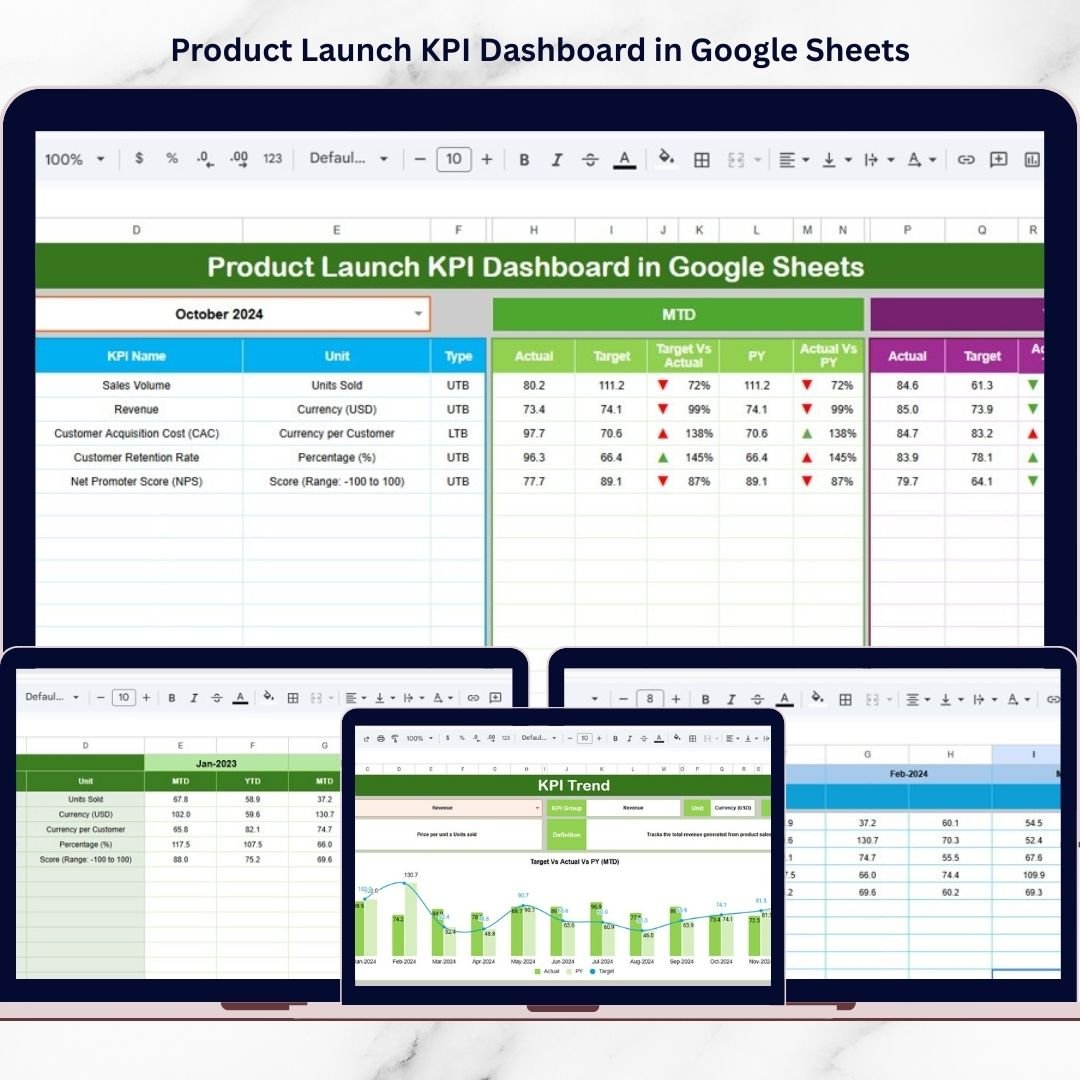
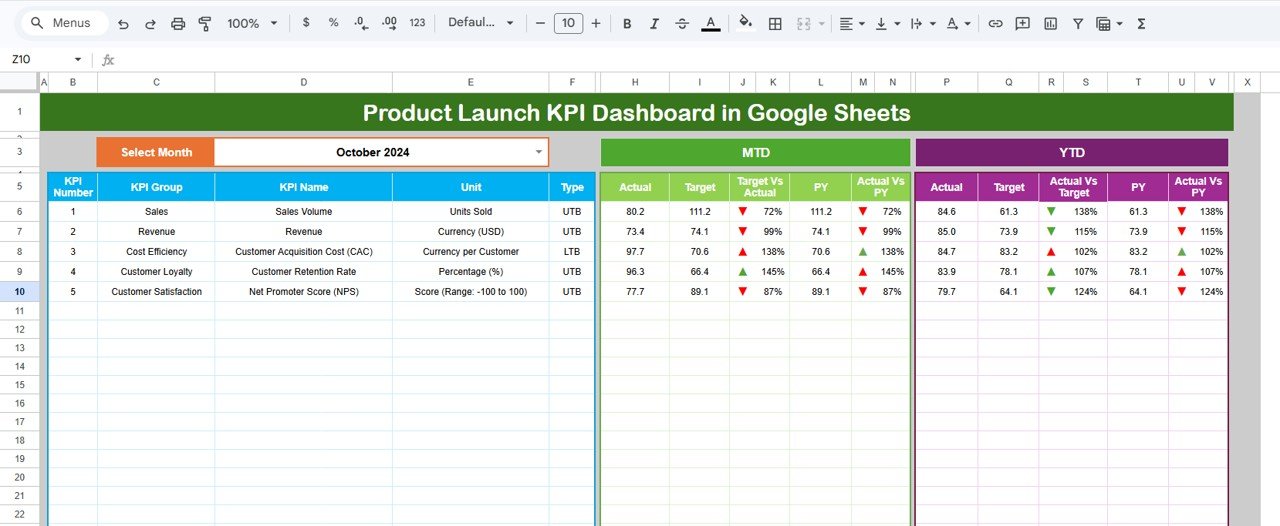
✅ Interactive Monthly Dashboard – Select the month in cell D3 and watch the entire dashboard update instantly.
✅ MTD & YTD Tracking – Monitor both short-term and long-term launch performance.
✅ Target vs Actual Comparison – Instantly identify performance gaps and growth opportunities.
✅ Previous Year Comparison – Evaluate launch growth trends year-over-year.
✅ Conditional Formatting Indicators – Up/down arrows highlight KPI performance status clearly.
✅ Dynamic KPI Intelligence Panel – View KPI group, unit, formula, definition, and type (LTB/UTB).
✅ Real-Time Google Sheets Collaboration – Work seamlessly with cross-functional teams.
Because of these features, your product launch moves from guesswork to precision-driven execution.
📦 What’s Inside the Product Launch KPI Dashboard in Google Sheets
This professionally designed solution includes 6 structured worksheets that create a complete launch monitoring system.
1️⃣ Dashboard Sheet – Main Control Center
Your central performance view showing:
-
Month dropdown (cell D3)
-
Automatic dashboard refresh
-
MTD metrics
-
YTD metrics
-
Target vs Actual comparison
-
Previous Year vs Actual comparison
-
Smart visual performance arrows
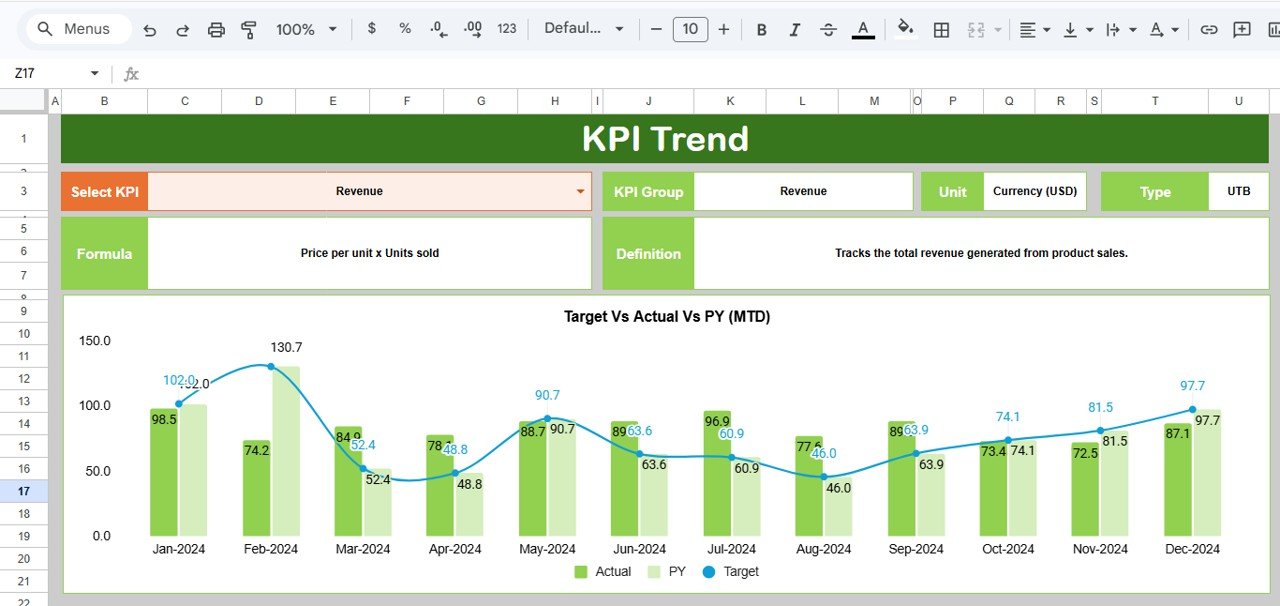
2️⃣ KPI Trend Sheet – Deep KPI Insights
Select any KPI from dropdown (cell C3) to see:
-
KPI Group
-
Unit of measurement
-
KPI Type (Lower the Better / Upper the Better)
-
KPI Formula
-
KPI Definition
-
Monthly trend charts
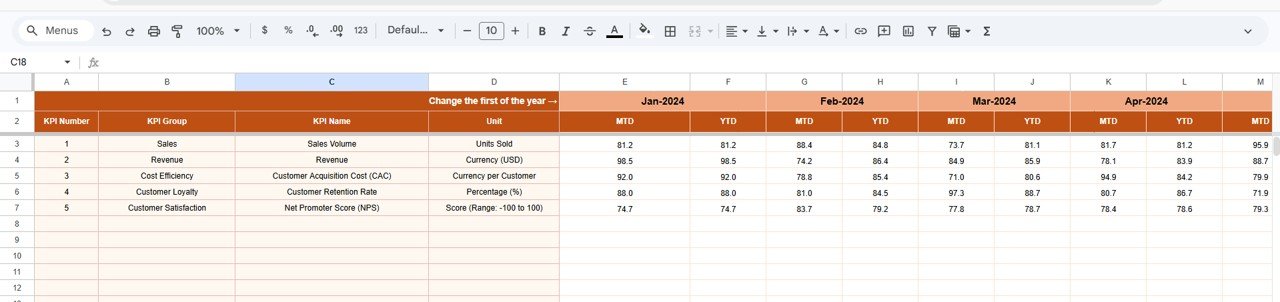
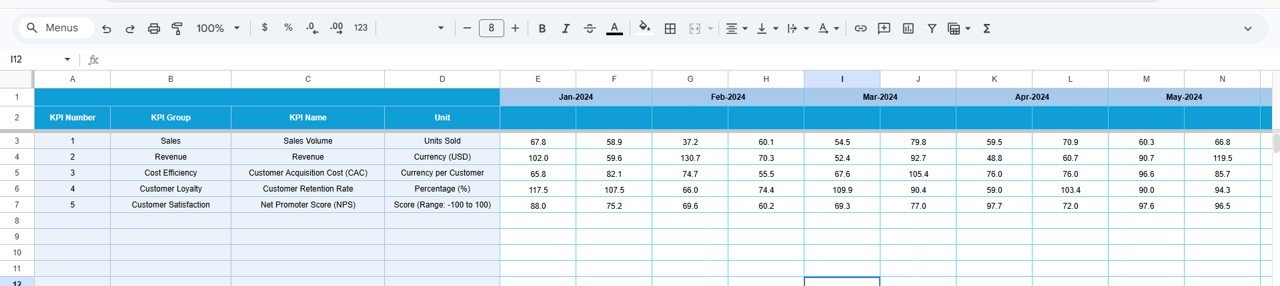
3️⃣ Actual Number Sheet – Current Data Entry
Enter MTD and YTD actual values here. Change month in cell E1 to control reporting.
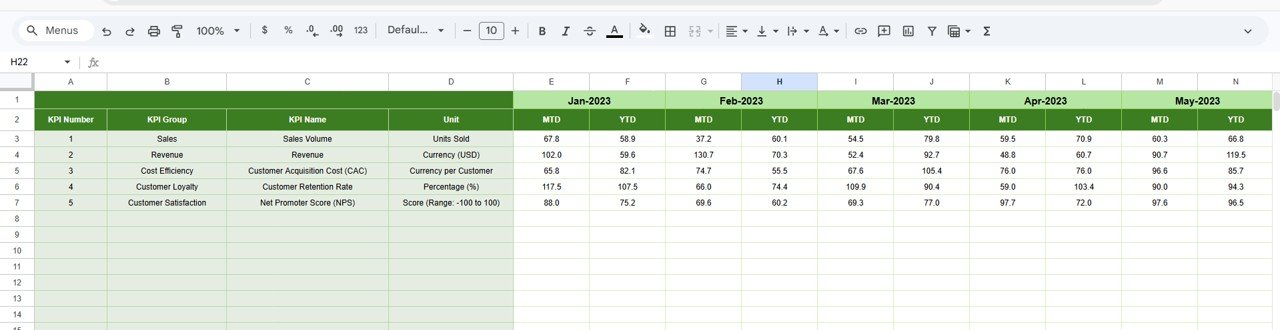
4️⃣ Target Sheet – Launch Goals
Define monthly MTD and YTD targets to measure success accurately.
5️⃣ Previous Year Number Sheet – Historical Engine
Input last year’s data to unlock powerful growth comparisons.
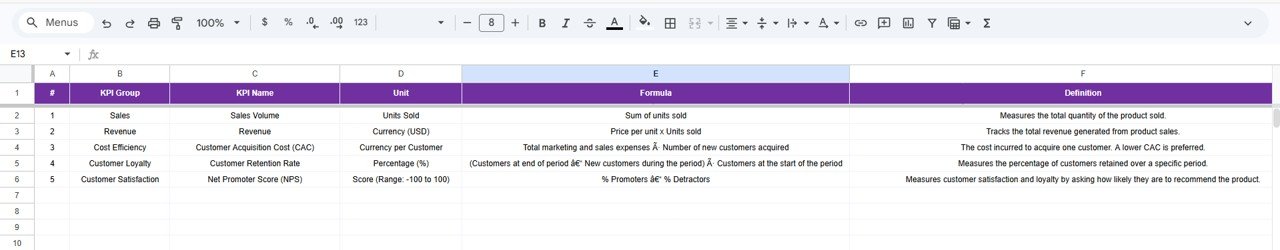
6️⃣ KPI Definition Sheet – KPI Foundation
Standardizes all KPI logic by storing name, group, unit, formula, and performance type.
Together, these sheets create a structured launch performance management framework.
⚙️ How to Use the Product Launch KPI Dashboard in Google Sheets
Getting started is simple:
-
Open the Google Sheets template
-
Define KPIs in the KPI Definition sheet
-
Enter targets in the Target sheet
-
Add previous year numbers
-
Input current MTD and YTD data
-
Select the desired month on the Dashboard
-
Review instant performance insights
Within minutes, your product launch data becomes actionable business intelligence.
👥 Who Can Benefit from This Product Launch KPI Dashboard in Google Sheets
This dashboard is built for cross-functional product teams.
Perfect for:
-
🚀 Product Managers
-
📊 Marketing Teams
-
💰 Sales Leaders
-
🏢 Business Owners
-
📈 Growth Managers
-
🧠 Strategy Teams
-
📦 Operations Managers
Because the dashboard runs in Google Sheets, collaboration becomes effortless.
By implementing the Product Launch KPI Dashboard in Google Sheets, your organization gains:
-
Real-time performance visibility
-
Faster decision-making
-
Clear target tracking
-
Improved marketing ROI analysis
-
Better sales monitoring
-
Historical performance comparison
-
Data-driven launch optimization
In today’s competitive market, product launches must be measured precisely. Reactive reporting is risky and costly.
This dashboard ensures your launch strategy stays sharp, measurable, and successful.
🔗 Click here to read the Detailed blog post
Watch the step-by-step video tutorial: