
Managing procurement becomes challenging when data is scattered across emails, spreadsheets, and multiple tools. Teams spend more time collecting numbers and less time analyzing them. That’s where the Procurement Spend Analysis Dashboard in Excel becomes a game-changing solution. This ready-to-use dashboard brings every cost, category, region, and department onto one clean and interactive interface—allowing businesses to make smart, data-driven decisions instantly.
This dashboard is designed for professionals who want clarity, speed, and full control over procurement performance. With dynamic charts, slicers, and structured insights, you get a complete 360° view of your procurement operations without needing any complex software.Procurement Spend Analysis Dashboard in Excel
✨ Key Features of the Procurement Spend Analysis Dashboard in Excel
The dashboard is loaded with powerful features that simplify procurement monitoring and help teams take action quickly. Below are the major highlights you will get inside this tool:
🔹 Complete Procurement Overview
Track total spending, budget allocation, variance, average lead time, and key performance indicators from one place.
🔹 Category-Level Cost Analysis
Identify high-spending categories, monitor delayed orders, and find bottlenecks affecting supplier performance.
🔹 Department-Wise Performance Insights
Compare total orders, cost distribution, processing efficiency, and lead times across departments.
🔹 Region-Wise Spend & Performance Tracking
Understand budget usage, delays, and procurement performance across regional operations.
🔹 Monthly Trends & Forecasting Support
Analyze month-wise spending, pending orders, seasonal patterns, and lead-time changes.
🔹 100% Editable Excel File
Customize charts, add new fields, modify slicers, and tailor the dashboard to meet your business needs.
📂 What’s Inside the Procurement Spend Analysis Dashboard
This dashboard includes multiple interactive sheets designed for deep and structured procurement analysis:
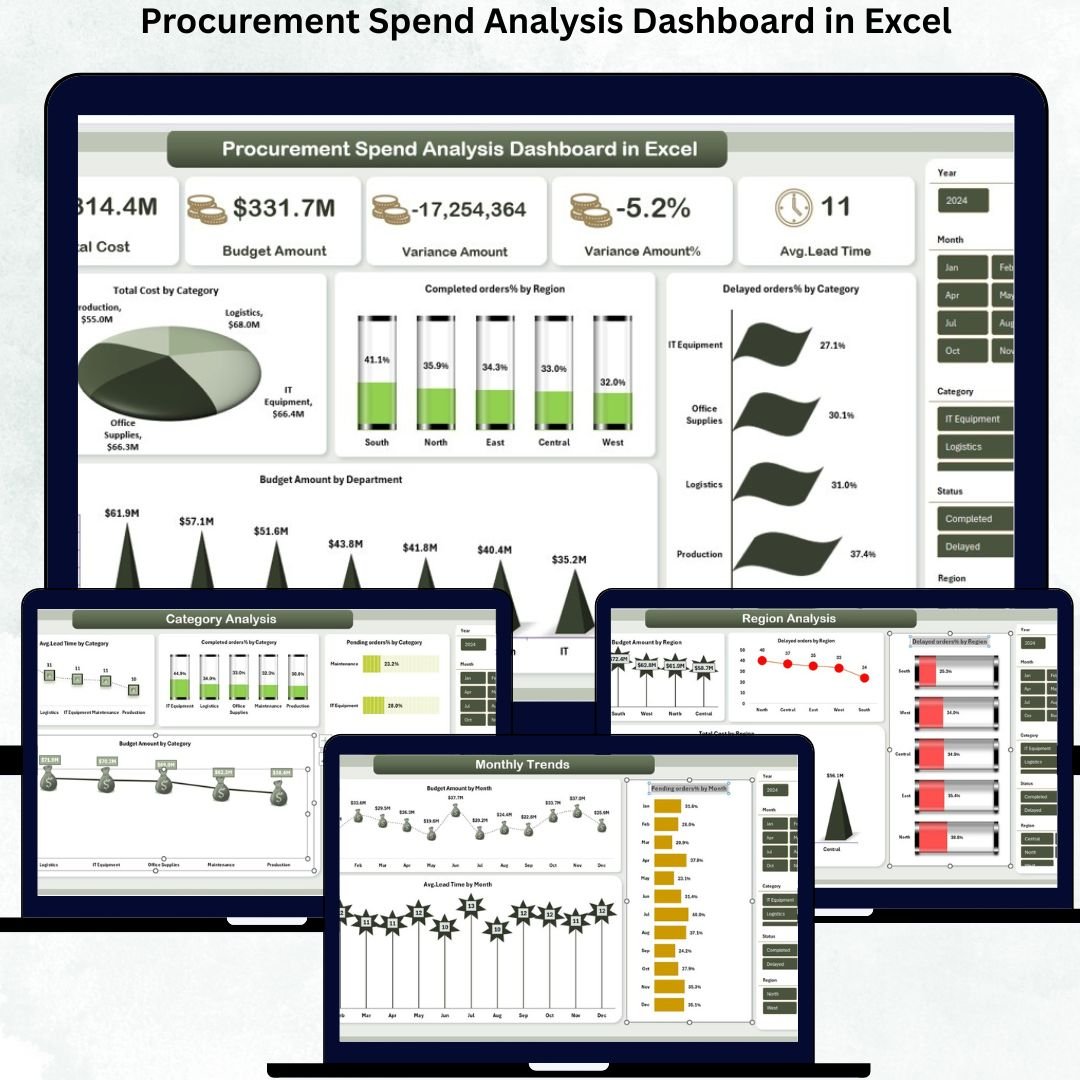
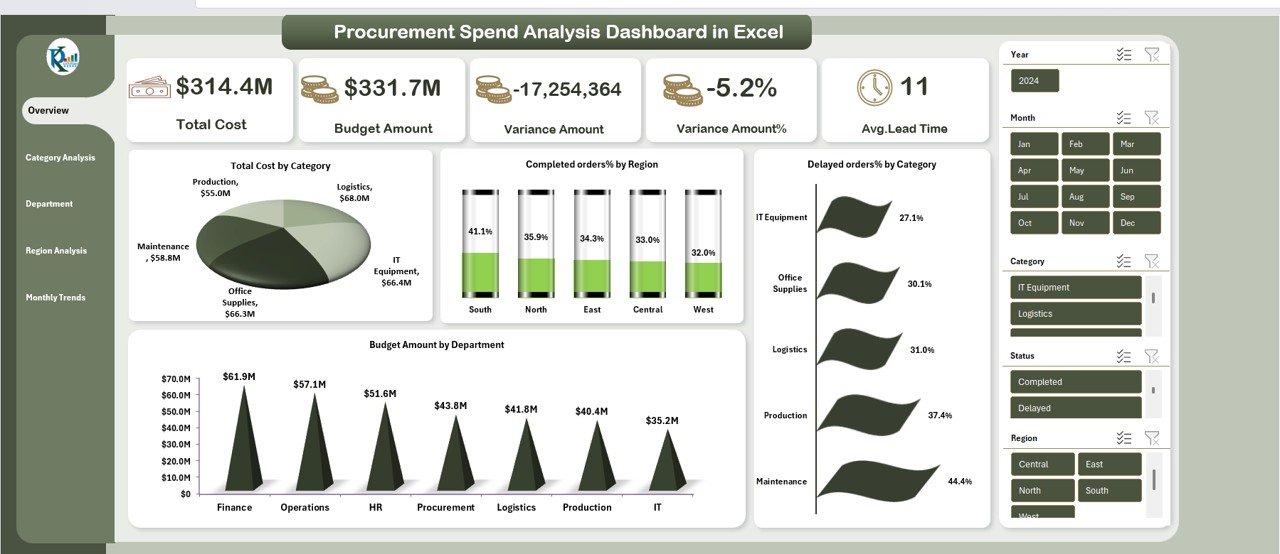
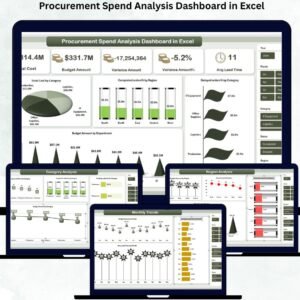
📌 1. Overview Sheet Tab
A snapshot of your complete procurement performance including:
-
Total Cost
-
Budget Amount
-
Variance Amount & Variance %
-
Avg. Lead Time
-
Total Cost by Category
-
Completed Orders % by Region
-
Budget by Department
-
Delayed Orders % by Category
This page helps you make immediate and informed decisions.
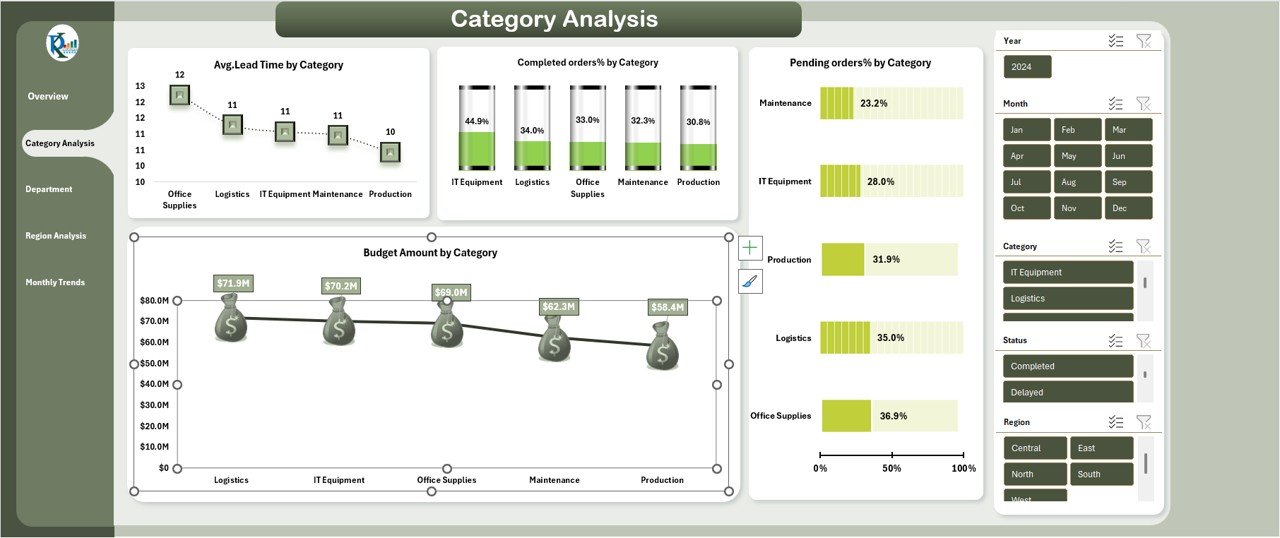
📌 2. Category Analysis Page
Analyze spending and performance by category with:
-
Avg. Lead Time by Category
-
Budget Amount by Category
-
Estimated Working Hours by Employee
Perfect for identifying high-cost or slow-moving procurement categories.
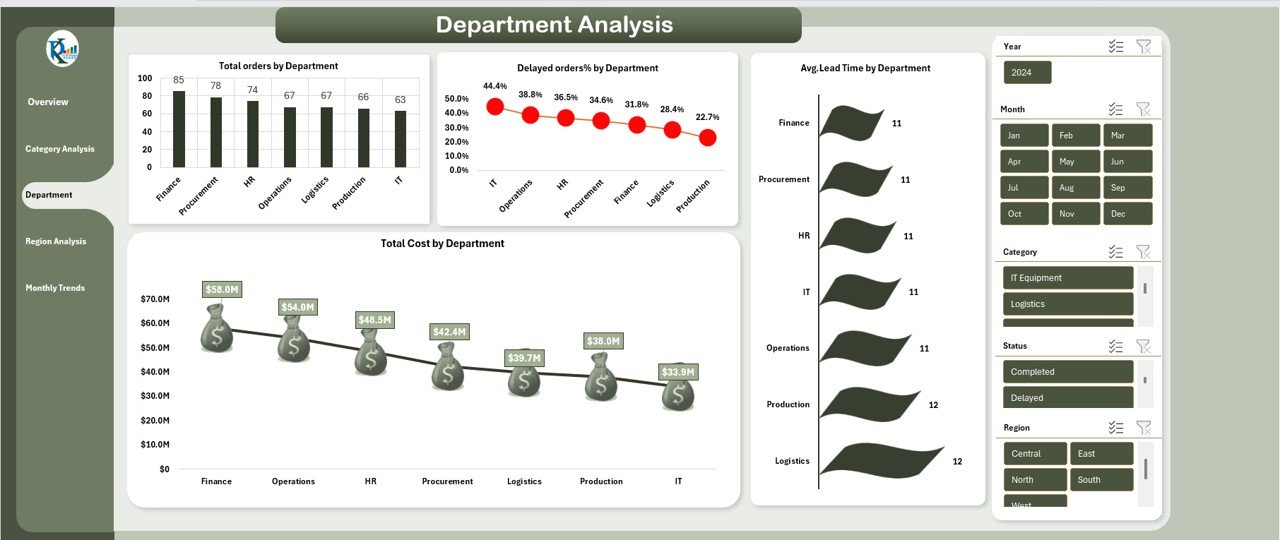
📌 3. Department Analysis Page
Get clear insights on department-level performance:
-
Total Orders by Department
-
Total Cost by Department
-
Avg. Lead Time
-
Delayed Orders %
Ideal for strategic planning and resource optimization.
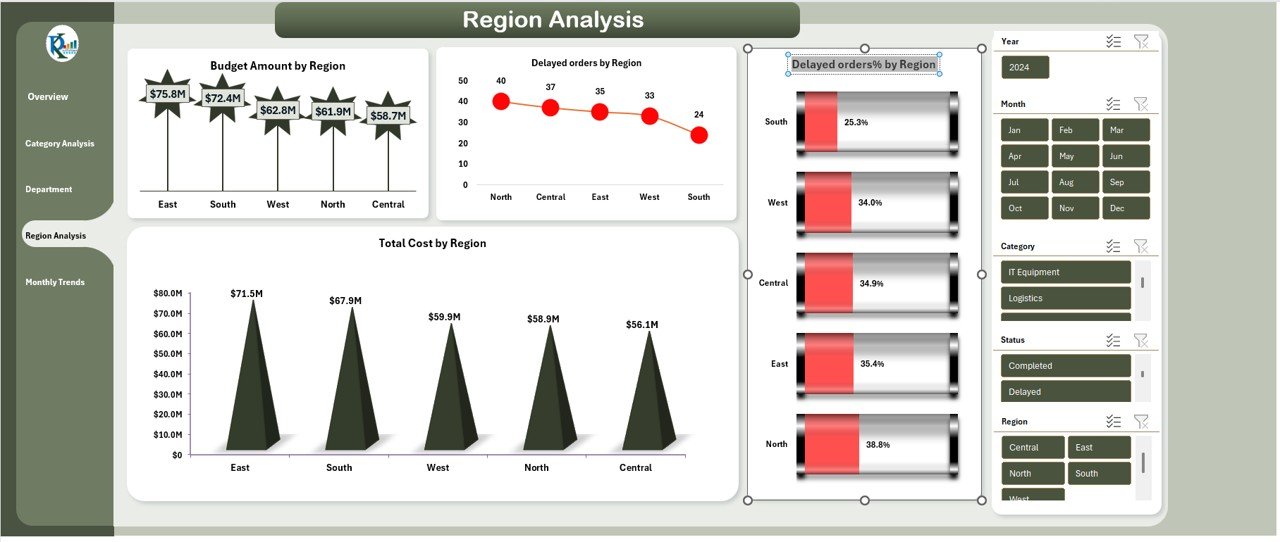
📌 4. Region Analysis Page
Understand regional procurement patterns with:
-
Budget Amount by Region
-
Total Cost by Region
-
Delayed Orders by Region
-
Delayed Orders %
Helps businesses operating across multiple locations make region-specific improvements.
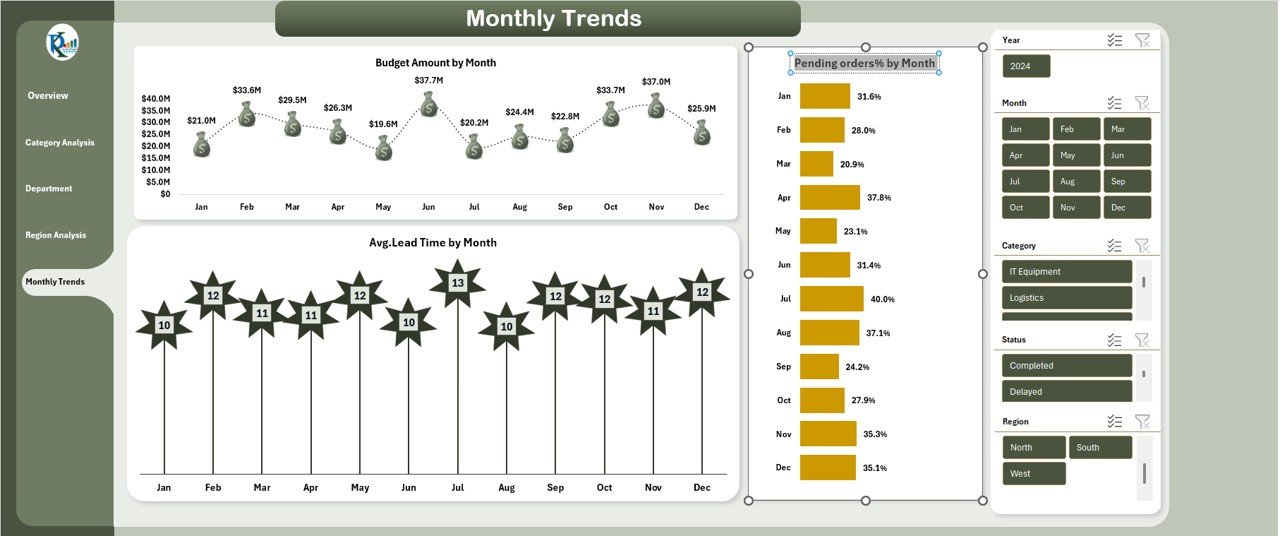
📌 5. Monthly Trends Page
Track month-wise performance using:
-
Budget Amount by Month
-
Avg. Lead Time by Month
-
Pending Orders %
Useful for forecasting, planning, and seasonal analysis.
🧭 How to Use the Procurement Spend Analysis Dashboard in Excel
Using the dashboard is simple—even for beginners:Procurement Spend Analysis Dashboard in Excel
▶️ Step 1: Update the Raw Data
Enter or paste your procurement data in the source table.
▶️ Step 2: Refresh the Pivot Tables
Click “Refresh All” to update all visuals instantly.
▶️ Step 3: Apply Slicers & Filters
Filter data by category, region, vendor, or department for deep insights.
▶️ Step 4: Analyze & Compare
Use charts and cards to review cost trends, delays, and performance metrics.
▶️ Step 5: Customize as Needed
Add your own formulas, visuals, or new fields based on the requirements of your business.
🎯 Who Can Benefit from This Procurement Spend Analysis Dashboard?
👨💼 Procurement Managers
Track spending patterns, evaluate vendors, and detect delays instantly.
🧾 Finance & Budgeting Teams
Monitor budget variance and find cost-saving opportunities.
🏢 Business Owners & Executives
Understand procurement health in a single view for better decision-making.
🧑💻 Analysts & Reporting Teams
Use ready-made visuals and interactive insights for fast reporting.
🏭 Operations & Supply Chain Teams
Improve procurement cycles and remove bottlenecks using performance metrics.
This dashboard is perfect for any organization—small or large—that wants to improve cost control and procurement efficiency.
### Click here to read the Detailed blog post
Watch the step-by-step video tutorial:


Reviews
There are no reviews yet.