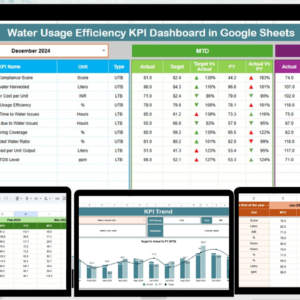
Procurement efficiency plays a direct role in controlling costs, improving supplier performance, and strengthening overall business profitability. Every delayed purchase order, missed saving opportunity, or inefficient supplier interaction increases operational risk. However, many procurement teams still depend on manual spreadsheets, static reports, or delayed summaries. As a result, leaders struggle to gain real-time visibility into procurement performance and make timely decisions.
That is exactly why the Procurement Efficiency KPI Dashboard in Google Sheets becomes a critical performance management solution.
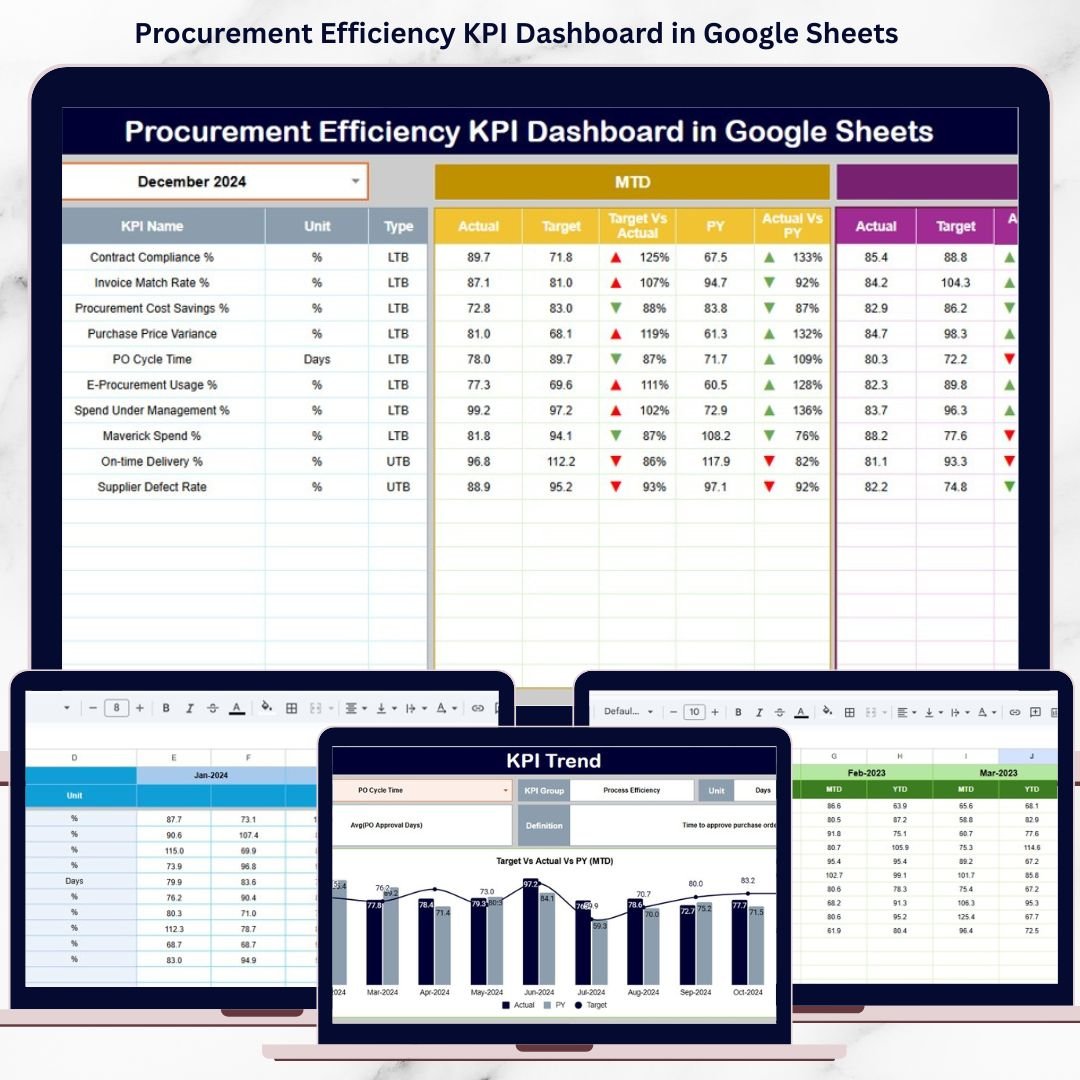
This ready-to-use dashboard transforms raw procurement data into structured KPIs, performance comparisons, and trend insights. It helps procurement managers, sourcing teams, finance leaders, and operations managers track efficiency, reduce cycle times, monitor supplier outcomes, and identify savings opportunities—all within one centralized Google Sheets dashboard. Instead of reacting after problems occur, teams gain proactive, data-driven insights to optimize procurement operations.
Because the dashboard is built in Google Sheets, it remains simple, collaborative, and accessible without expensive BI tools or complex system integrations.

✨ Key Features of the Procurement Efficiency KPI Dashboard in Google Sheets
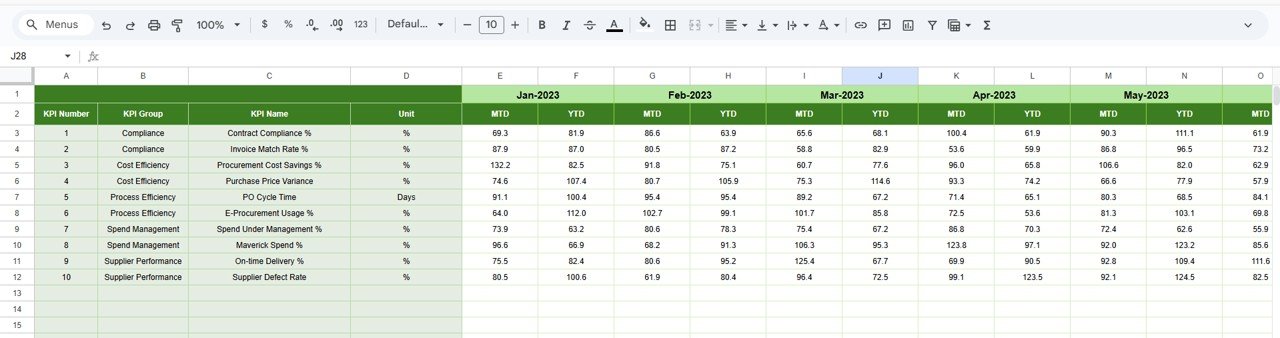
📊 1. MTD & YTD Procurement Performance Tracking
Monitor Month-to-Date and Year-to-Date KPIs to evaluate short-term efficiency and long-term procurement effectiveness.
🎯 2. Target vs Actual & Previous-Year Comparison
Compare actual procurement performance against defined targets and historical benchmarks to identify gaps and improvements.
📈 3. Visual Performance Indicators
Conditional formatting arrows provide instant clarity:
🟢 Green arrow → favorable procurement performance
🔴 Red arrow → inefficiency or decline
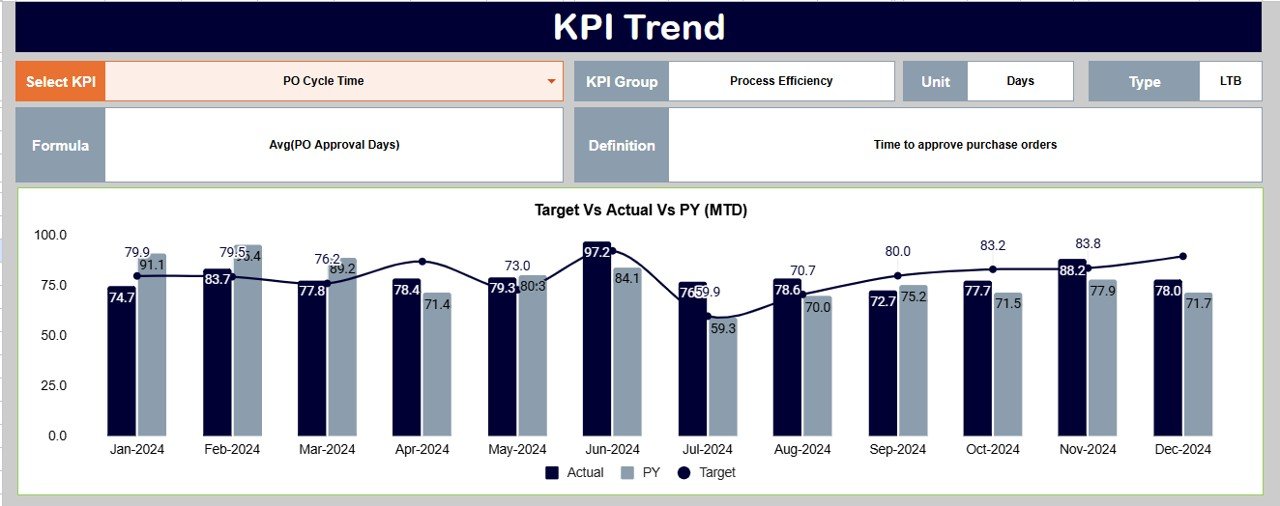
📉 4. KPI Trend Analysis
Track month-wise KPI movement to detect bottlenecks, supplier issues, or process delays early.
☁️ 5. Google Sheets-Based Collaboration
Enable real-time collaboration between procurement, finance, and operations teams using a single shared dashboard.
📦 What’s Inside the Procurement Efficiency KPI Dashboard in Google Sheets
🖥️ Dashboard Sheet Tab (Executive Overview)
This is the main summary page used during procurement and leadership reviews.
Month Selector
-
Located in cell D3
-
Automatically refreshes all KPIs
MTD Metrics Displayed
-
Actual
-
Target
-
Previous Year
-
Target vs Actual
-
Previous Year vs Actual
YTD Metrics Displayed
-
Actual
-
Target
-
Previous Year
-
Target vs Actual
-
Previous Year vs Actual
This layout gives leadership an instant snapshot of procurement efficiency.
📊 KPI Trend Sheet Tab
This sheet supports deeper analysis of individual procurement KPIs.
How It Works
-
Select a KPI from the dropdown in cell C3
Details Displayed
-
KPI Group
-
KPI Unit
-
KPI Type (Upper the Better / Lower the Better)
-
KPI Formula
-
KPI Definition
Trend Visualization
-
Month-wise KPI movement
-
Process efficiency trends
-
Early warning signals
This sheet helps teams understand why procurement performance changes over time.
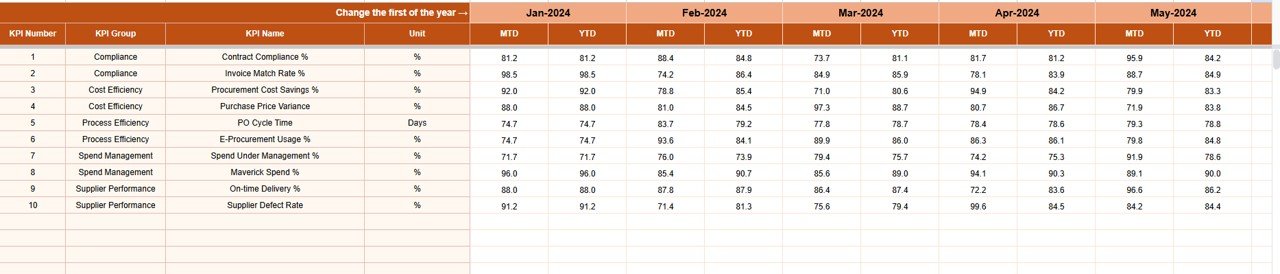
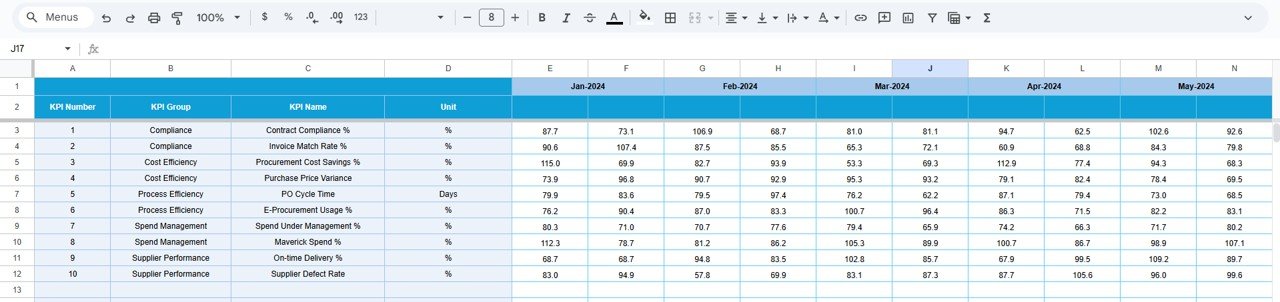
📋 Actual Number Sheet Tab
This is the structured data-entry sheet for real procurement results.
-
Enter MTD Actual values
-
Enter YTD Actual values
-
Define the first month of the year in cell E1
All KPIs and dashboard visuals update automatically.
🎯 Target Sheet Tab
This sheet stores procurement goals and benchmarks.
-
Monthly (MTD) targets
-
Annual (YTD) targets
Targets align procurement activities with cost-saving and efficiency objectives.
📆 Previous Year Number Sheet Tab
Stores last year’s procurement data to support:
-
Year-over-year efficiency analysis
-
Seasonal trend identification
-
Long-term performance evaluation
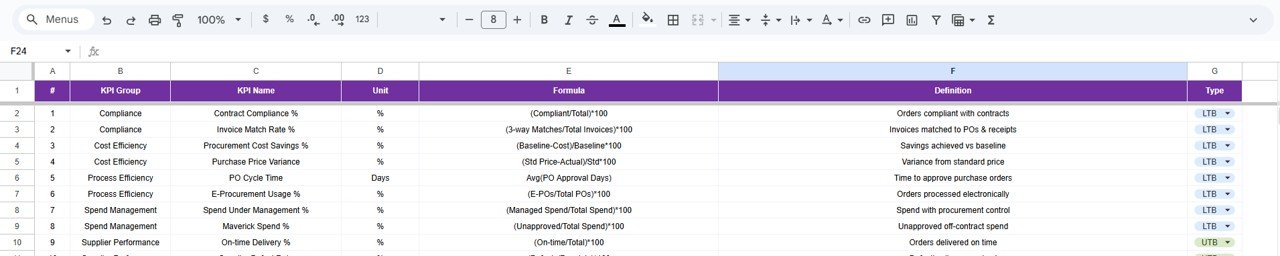
📘 KPI Definition Sheet Tab
This is the governance foundation of the dashboard.
It contains:
-
KPI Name
-
KPI Group
-
Unit
-
Formula
-
KPI Definition
-
KPI Type (UTB / LTB)
This ensures consistent KPI interpretation across procurement teams.
🎯 Who Can Benefit from This Procurement Efficiency KPI Dashboard
🛒 Procurement & Sourcing Teams
Track cycle times, savings, and supplier performance clearly.
💰 Finance Teams
Monitor cost control and procurement-driven savings.
🏭 Operations Teams
Understand procurement delays and operational impact.
🏢 Leadership & Executives
Gain real-time visibility into procurement efficiency.
🚀 Organizations of Any Size
Improve procurement maturity without complex tools.
### Click here to read the Detailed blog post
Watch the step-by-step video tutorial:


Reviews
There are no reviews yet.