
The Procurement Dashboard in Power BI is a powerful data visualization tool designed to help businesses track and analyze procurement operations in real-time. With a user-friendly interface, dynamic filtering, and detailed insights, this dashboard enables procurement managers, finance teams, and decision-makers to streamline purchasing processes, evaluate supplier performance, and monitor financial expenditures.

Key Features and Benefits:
1. Interactive Navigation for Seamless User Experience
The dashboard features a multi-page navigation pane, allowing users to switch between different analytical views, including:
- Overview Dashboard – A snapshot of total orders, costs, payments, and procurement trends.
- Supplier Performance Dashboard – Evaluate supplier efficiency based on cost, order completion, and on-time delivery rates.
- Order Status Dashboard – Monitor the status of all procurement orders, including pending, delivered, or delayed.
- Payment Analysis Dashboard – Identify overdue, unpaid, and paid invoices to maintain financial transparency.
- Category Analysis Dashboard – Breakdown procurement costs by category, helping in better budgeting and planning.
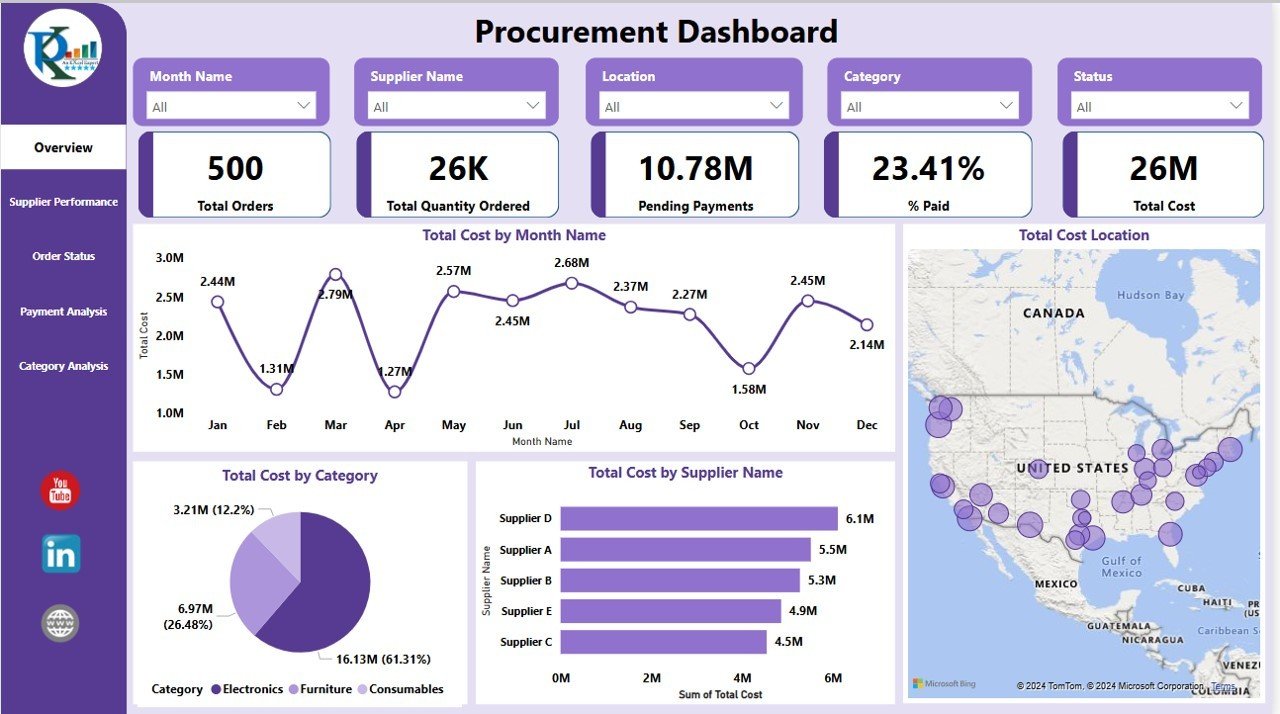
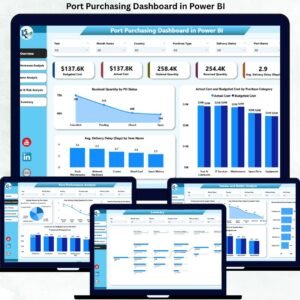
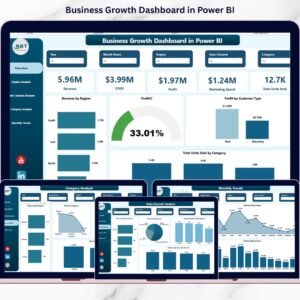
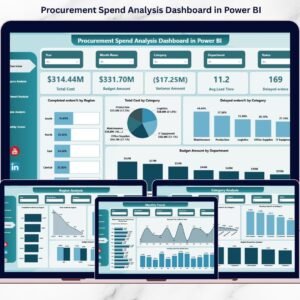
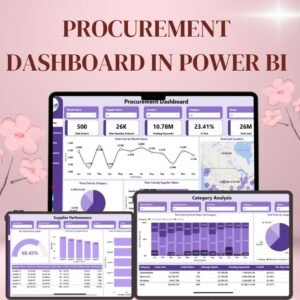
2. Overview Dashboard – Real-Time Procurement Summary
The Overview Page provides a comprehensive summary of procurement activities.
🔹 Key Metrics:
- Total Orders: Displays the total number of procurement orders.
- Total Quantity Ordered: Shows the total number of items ordered across all suppliers.
- Pending Payments: Highlights unpaid invoices and outstanding supplier payments.
- % Paid: Indicates the proportion of total payments made.
- Total Procurement Cost: Summarizes the overall spending on procurement.
📊 Visual Representations:
- Total Cost by Month Name (Line Chart): Shows monthly spending trends.
- Total Cost by Category (Pie Chart): Breaks down procurement expenses into categories such as Electronics, Furniture, and Consumables.
- Total Cost by Supplier (Bar Chart): Identifies the top suppliers in terms of total spending.
- Geographical Cost Mapping: Displays procurement costs distributed across different locations.
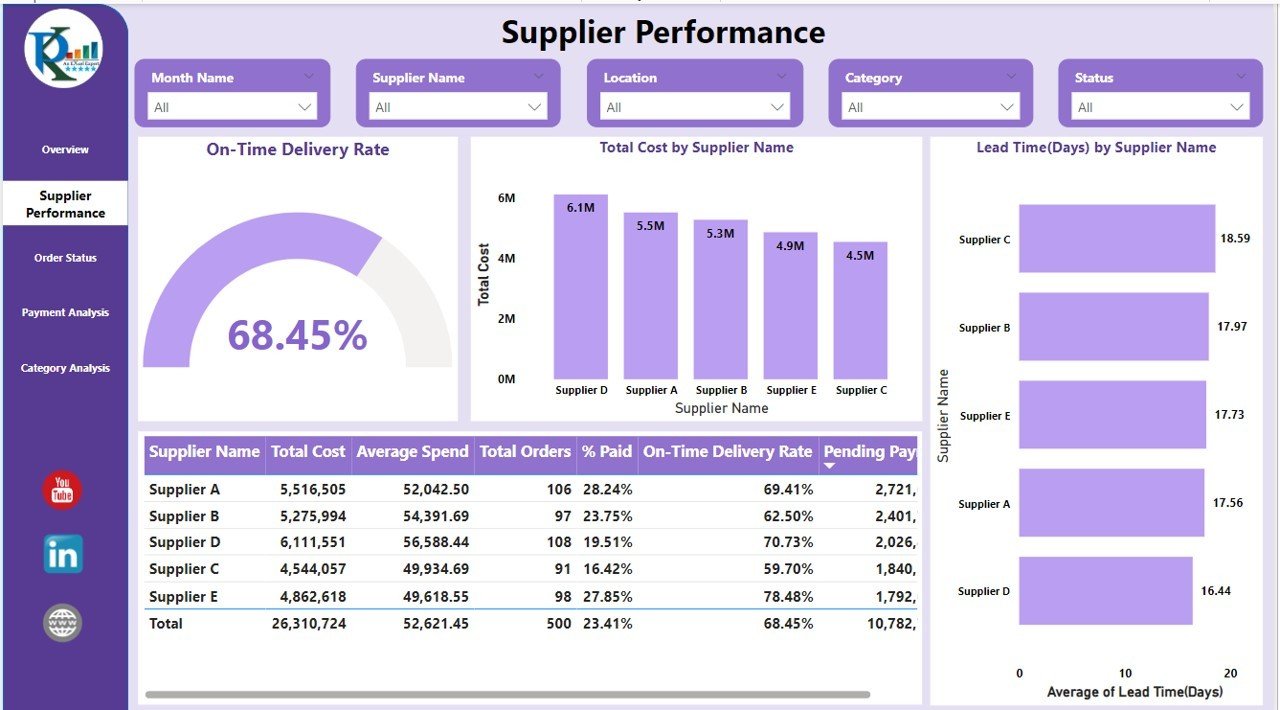
3. Supplier Performance Dashboard – Evaluating Supplier Efficiency
This page helps procurement managers analyze supplier performance using:
- On-Time Delivery Rate (%) – Measures how often suppliers meet delivery deadlines.
- Total Cost by Supplier (Bar Chart) – Ranks suppliers based on procurement spending.
- Average Spend per Supplier – Shows cost distribution among different suppliers.
- Lead Time by Supplier (Bar Chart) – Displays the average number of days each supplier takes to deliver orders.
🔎 Actionable Insights:
- Identify underperforming suppliers with high delivery delays.
- Compare supplier costs and optimize vendor selection.
- Monitor supplier reliability with on-time delivery metrics.
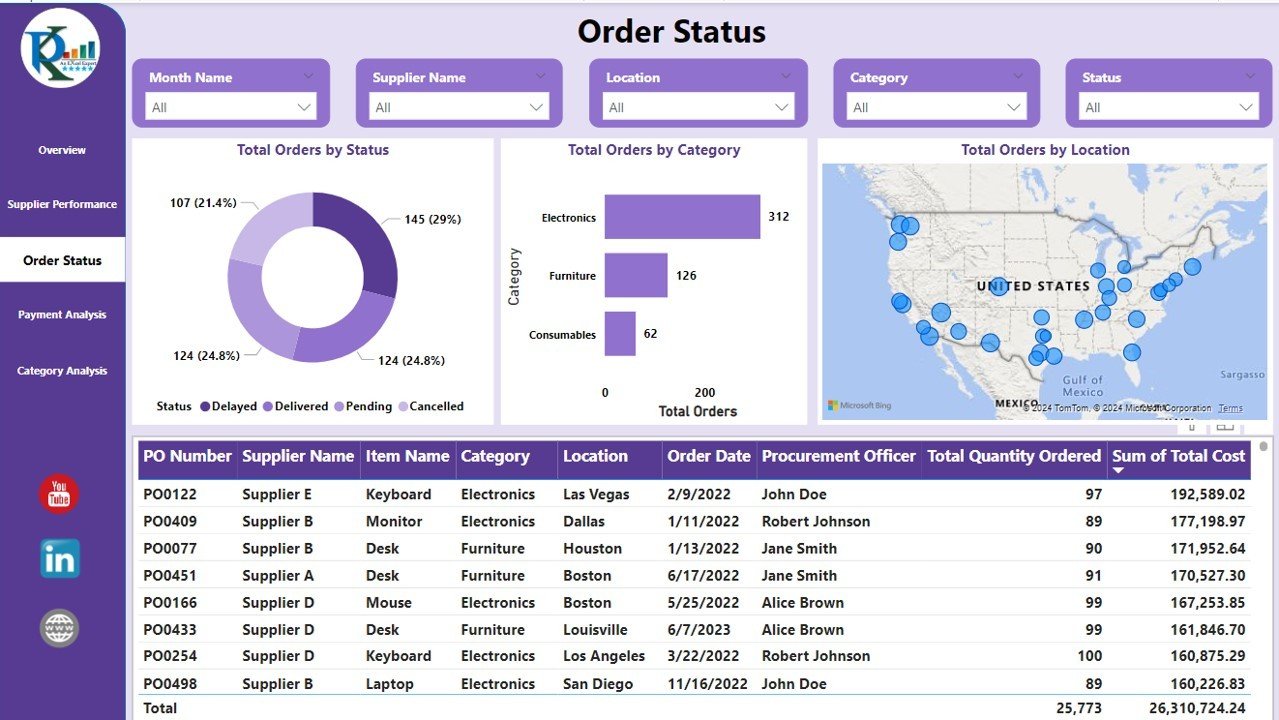
4. Order Status Dashboard – Track and Manage Orders Effectively
This section provides real-time tracking of procurement orders, ensuring better control over the supply chain.
📌 Insights Available:
- Total Orders by Status (Pie Chart): View breakdowns of pending, delayed, delivered, and canceled orders.
- Total Orders by Category (Bar Chart): Understand procurement spending across product categories.
- Total Orders by Location (Geographical Map): Analyze where procurement expenses are concentrated.
✅ Benefits:
- Easily monitor pending orders.
- Detect order delays and act proactively.
- Optimize procurement strategies based on order trends.
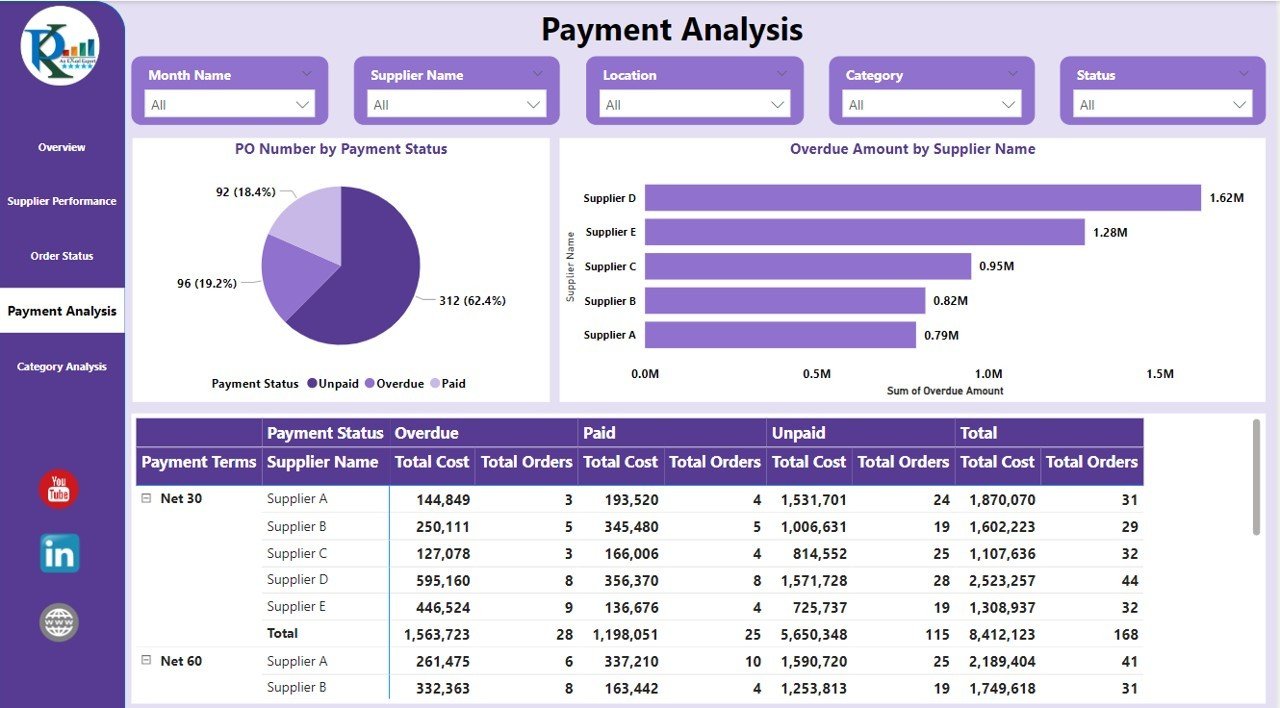
5. Payment Analysis Dashboard – Ensure Financial Transparency
This page provides a detailed payment analysis, helping businesses track invoices and manage outstanding payments. 📊 Metrics Covered:
- Payment Status (Pie Chart): Breakdown of invoices marked as paid, unpaid, or overdue.
- Overdue Amount by Supplier (Bar Chart): Identifies suppliers with the highest unpaid amounts.
- Payment Terms Comparison: View overdue payments categorized by Net 30, Net 60, and other terms.
💰 Key Advantages:
- Reduce overdue payments with timely follow-ups.
- Improve cash flow visibility.
- Ensure better financial planning for procurement costs.
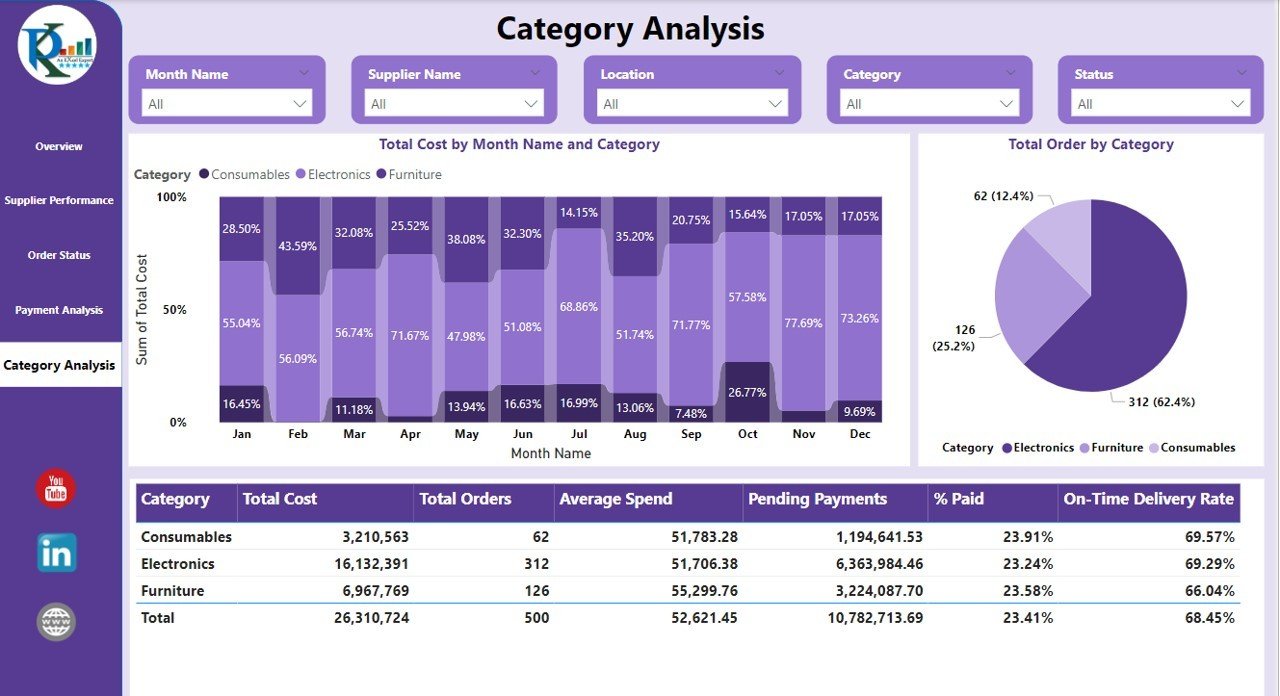
6. Category Analysis Dashboard – Optimize Procurement Spending
Gain deeper insights into procurement spending with the Category Analysis section. 📊 What’s Included:
- Total Cost by Month and Category (Stacked Chart): View monthly procurement trends per category.
- Total Orders by Category (Pie Chart): Get a percentage-based breakdown of procurement spending.
- Pending Payments by Category: Analyze outstanding supplier payments.
🚀 How This Helps:
- Allocate budgets effectively.
- Identify high-expenditure categories.
- Optimize spending across procurement categories.
Why Choose This Procurement Dashboard?
✔ Real-time tracking – Get up-to-date procurement data anytime, anywhere.
✔ Data-driven decisions – Improve supplier negotiations & cost efficiency.
✔ Financial transparency – Ensure better cash flow and payment tracking.
✔ Visual reports – Easy-to-understand charts and graphs for quick insights.
✔ Custom filtering – Adjust reports based on date, category, supplier, or location.
Click here to read the detailed blog
Visit our YouTube channel to learn step-by-step video tutorials
Watch the step-by-step video tutorial:
Also check our Quality Analysis Dashboard in Power BI


Reviews
There are no reviews yet.