
The Process Dashboard in Excel is an intuitive and interactive data visualization tool designed to help businesses and teams track key performance indicators efficiently. Whether you are managing customer interactions, sales, or revenue, this dashboard provides a comprehensive overview of your process performance in an easy-to-analyze format.
This Excel-based solution brings together real-time analytics, dynamic charts, and interactive filters, allowing users to visualize trends and optimize decision-making. From tracking calls and sales to monitoring conversion rates and revenue, this dashboard streamlines performance analysis without requiring any coding knowledge. Process Dashboard in Excel
Key Features: Process Dashboard in Excel
📊 Diverse Metrics Visualization
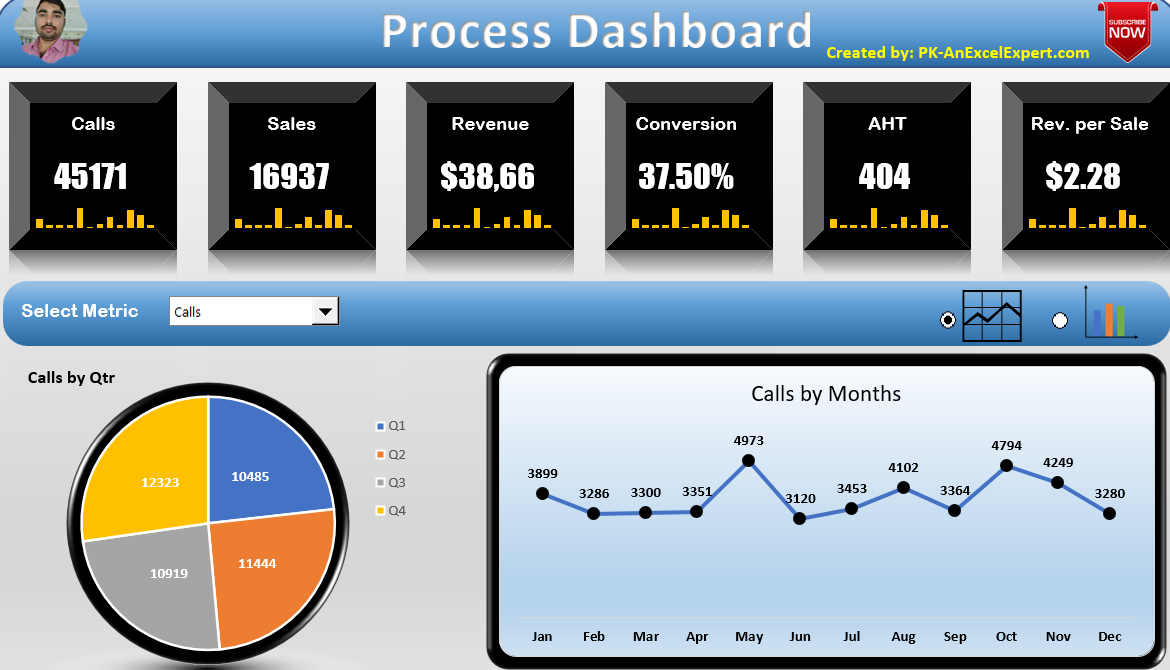
- The dashboard displays critical KPIs such as Calls, Sales, Revenue, Conversion Rate, Average Handling Time (AHT), and Revenue per Sale in a visually appealing layout.
- Each metric card includes mini spark-line charts to highlight trends over 12 months, making it easy to spot performance variations.
📅 Flexible Timeframe Analysis
- The built-in time-based analytics allows you to view data by quarter and month, helping you understand seasonal trends and performance fluctuations.
- Spark-lines provide a quick snapshot of performance trends, enabling proactive decision-making.
🛠️ Interactive Controls for Easy Navigation
- A dynamic metric drop-down selector enables users to switch between different KPIs effortlessly, ensuring a customized view of the data.
- Option buttons allow users to toggle between line and column charts, offering flexibility in visualizing trends.
- The dashboard’s interactive elements make data exploration user-friendly and efficient, even for those with minimal Excel experience.
📈 Detailed Performance Breakdown
- A Quarterly Performance Pie Chart provides a visual representation of metrics distribution across four quarters, helping users identify key trends.
- A Monthly Performance Monitor displays metric-specific line or column charts, ensuring granular performance analysis based on the selected KPI.
🎓 Step-by-Step Tutorials & Support
- Get the most out of this dashboard with detailed video tutorials available on our YouTube channel.
- The step-by-step guides walk you through how to customize, update, and analyze data using the Process Dashboard in Excel.
How This Dashboard Can Help You:
✅ Save Time: Automate performance tracking with pre-built formulas and visualizations.
✅ Enhance Decision-Making: Identify top-performing months and quarters to optimize strategies.
✅ Boost Productivity: Monitor sales, calls, and revenue trends in real-time.
✅ Improve Reporting: Present data in a visually compelling and easy-to-understand format.
No coding required! Just input your data and get instant insights.
Click here to read the detailed blog post
Watch the step-by-step video tutorial:
Also check our Inventory Management Form in Excel


Reviews
There are no reviews yet.