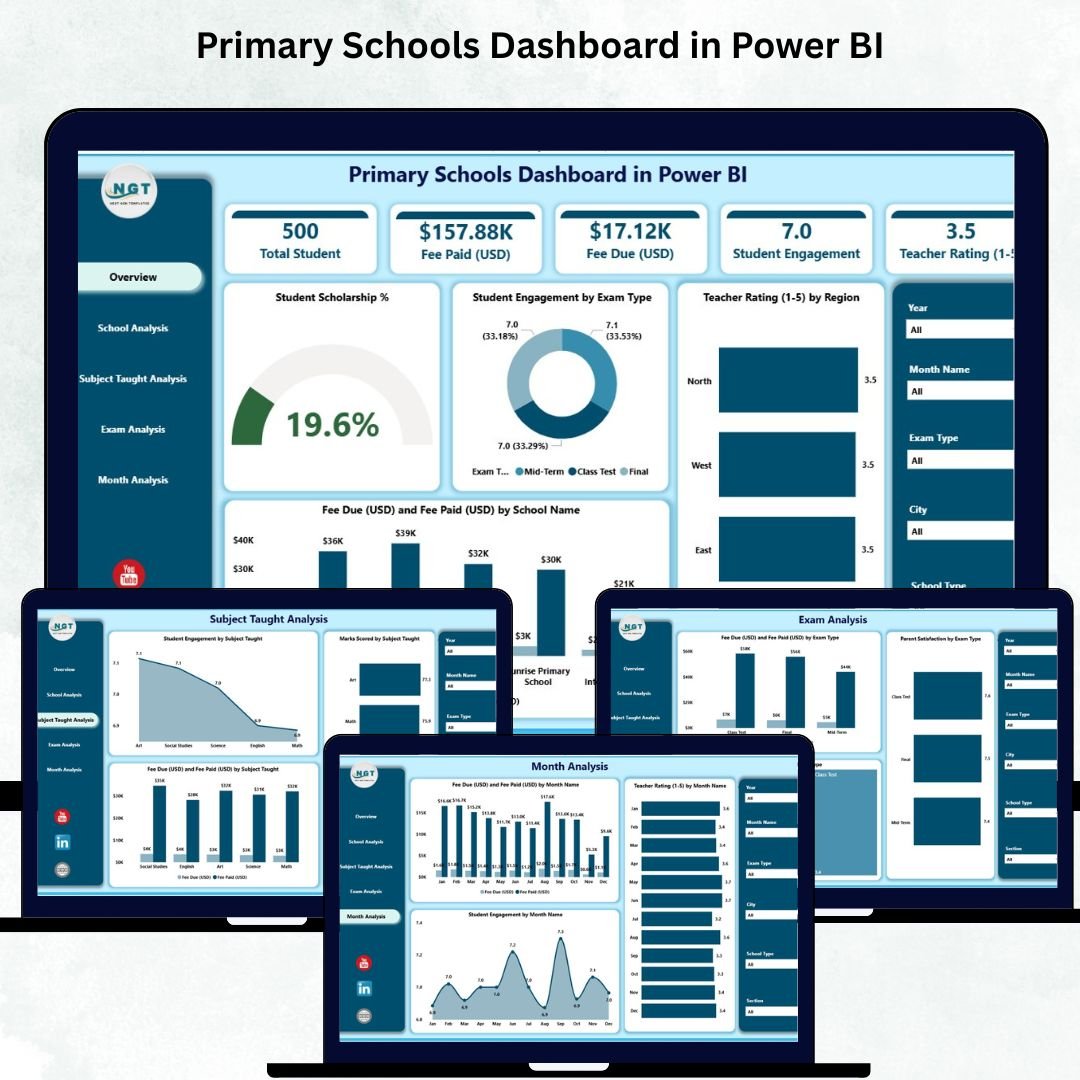
Running a primary school involves much more than classrooms and exams. School leaders must track student engagement, teacher performance, fee status, exam results, subject outcomes, parent satisfaction, and monthly academic patterns—every single day. When this information stays scattered across multiple files, decision-making becomes slow and unclear. That’s why the Primary Schools Dashboard in Power BI is the perfect solution for modern schools seeking clarity, speed, and organized reporting. 🎒📊
This ready-to-use dashboard brings all essential academic and administrative KPIs into one interactive platform. With dynamic slicers, automated visuals, and structured pages, schools can analyze performance in real time. From fee collection to exam outcomes and subject trends, everything becomes clearer and easier to monitor. Power BI delivers instant insights using engaging charts, making this dashboard simple for teachers, principals, coordinators, and admin teams.
Whether you manage a single school or multiple branches, this dashboard helps you make data-driven decisions and improve the overall learning experience.
✨ Key Features of Primary Schools Dashboard in Power BI
This dashboard is designed to support academic quality, administrative transparency, and strategic planning.
📊 Clear KPI Tracking
Monitor essential indicators including:
-
Student Scholarship %
-
Student Engagement %
-
Teacher Rating
-
Fee Summary (Paid & Due)
These KPIs help school leaders assess performance instantly.
🏫 School, Subject & Exam Analysis
Understand how each school branch performs, which subjects need attention, and how exam types influence engagement and satisfaction.
🎛️ Smart Slicers & Filters
Filter by month, year, exam type, region, or school type with one click. Every visual updates automatically for quick comparisons.
📈 Beautiful Charts & Interactive Pages
Each page includes simplified visuals to help academic and administrative teams make faster, clearer decisions.
⚡ Zero Manual Reporting
Just update your data source—Power BI refreshes everything automatically.
📦 What’s Inside the Primary Schools Dashboard in Power BI
This dashboard includes five powerful analytical pages, each offering unique insights.
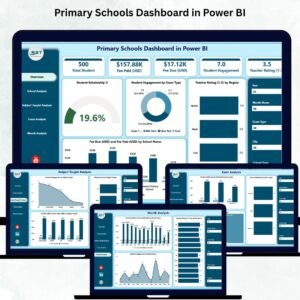
1️⃣ Overview Page — Quick School-Wide Insights
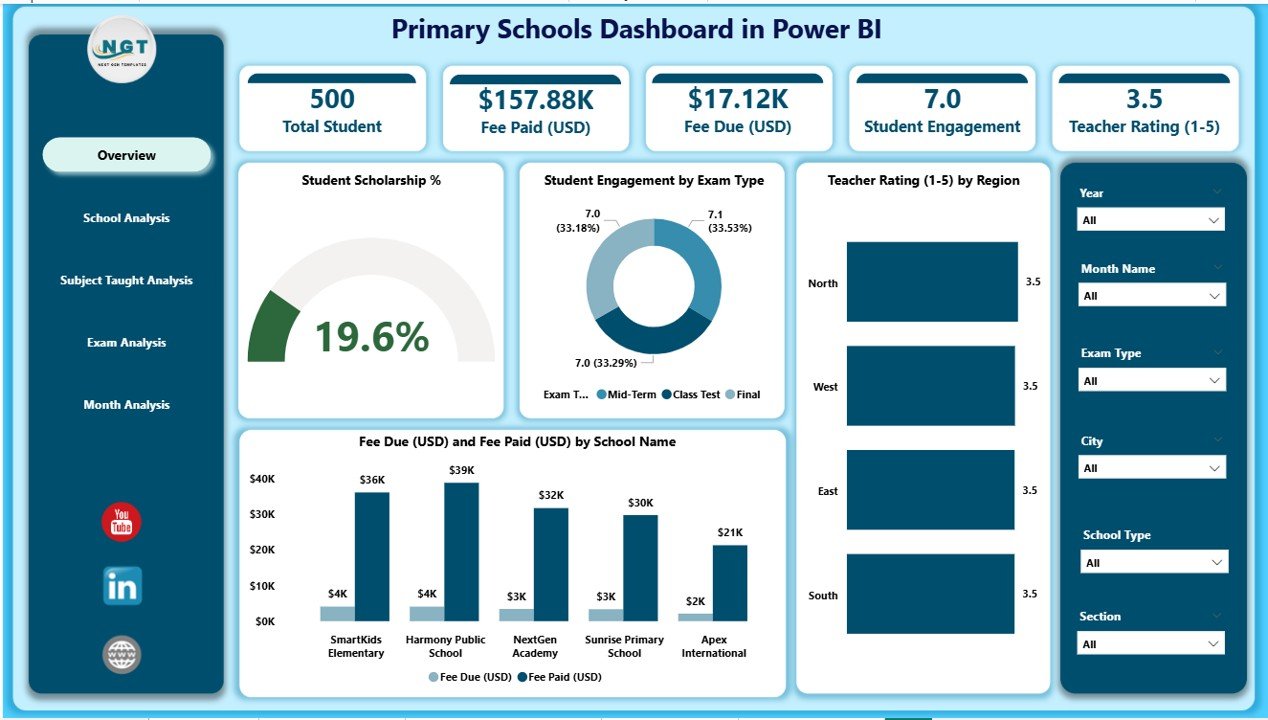
The Overview Page acts as the central hub. It includes:
-
Slicers for month, year, exam type & school type
-
Four KPI cards
-
Charts showing:
-
Student Scholarship %
-
Student Engagement by Exam Type
-
Teacher Rating by Region
-
Fee Paid vs. Fee Due by School Type
-
This page is perfect for board meetings, weekly reviews, and quick performance checks.
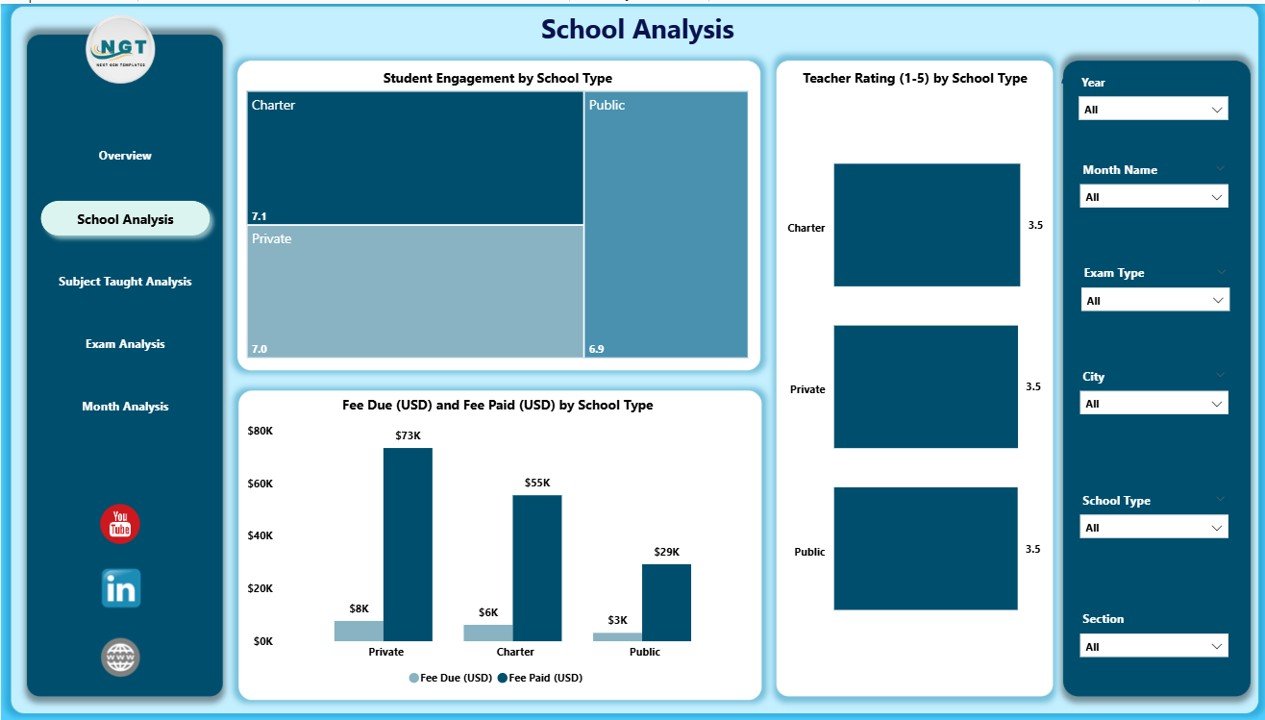
2️⃣ School Analysis Page — Compare Branch Performance
This page helps leaders understand how each school location performs using three main charts:
-
Student Engagement by School Name
-
Teacher Rating by School Name
-
Fee Paid vs. Fee Due by School Name
Ideal for multi-school operations and identifying improvement areas.
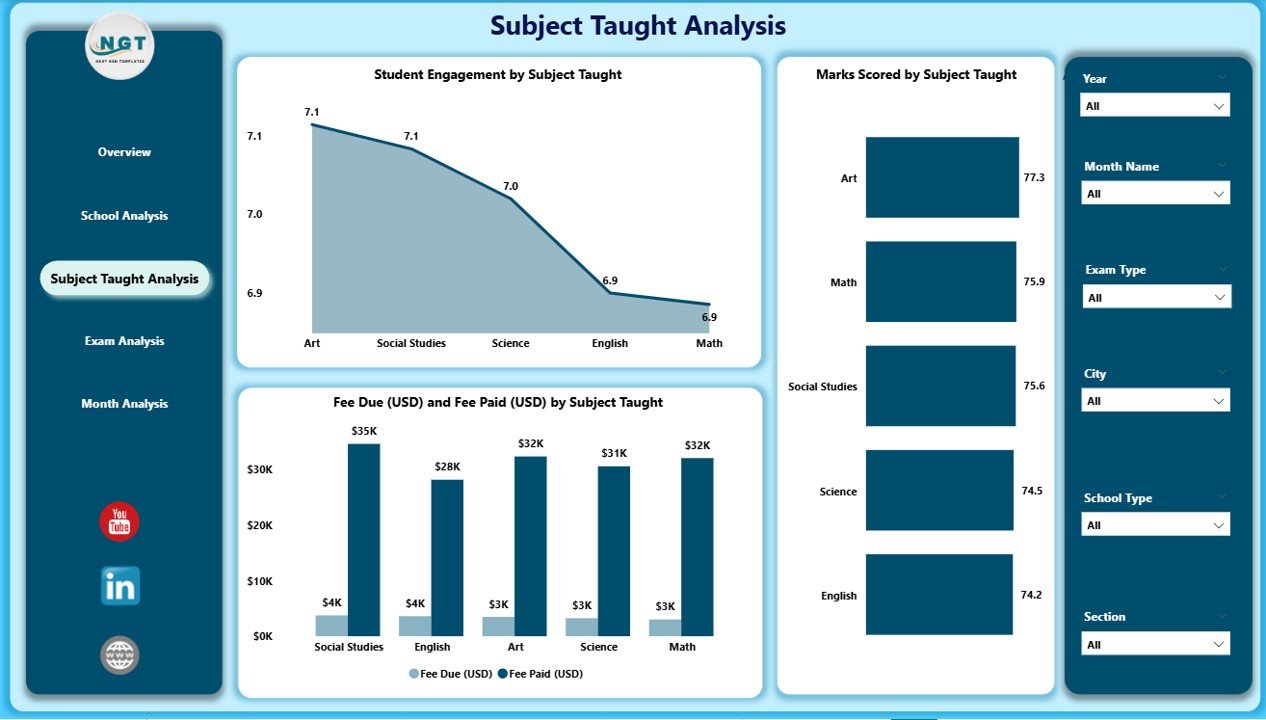
3️⃣ Subject Taught Analysis Page — Academic Performance Insights
Analyze subject-wise engagement and exam results. Charts include:
-
Student Engagement by Subject
-
Marks Scored by Subject
-
Fee Paid vs. Fee Due by Subject
Great for academic heads to improve teaching strategies.
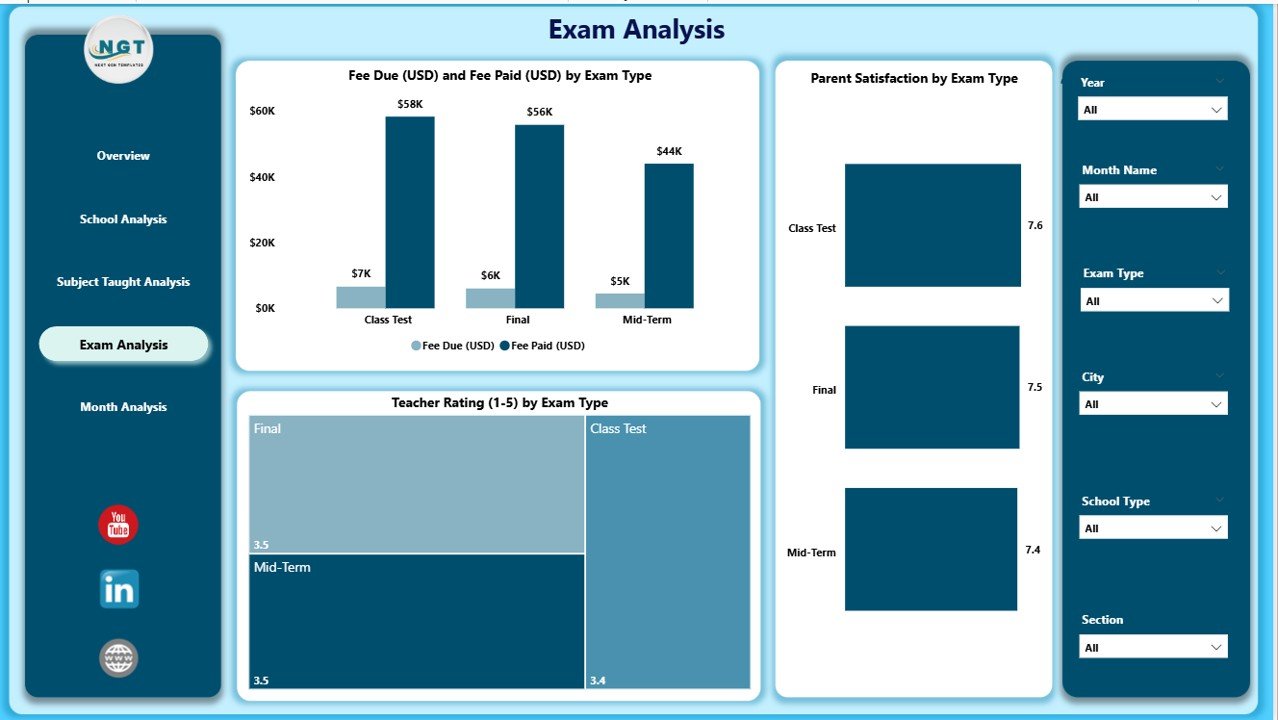
4️⃣ Exam Analysis Page — Understand Exam-Based Trends
Track exam performance and satisfaction with:
-
Fee Paid & Due by Exam Type
-
Parent Satisfaction
-
Teacher Rating by Exam Type
Helps improve exam formats and student preparation.
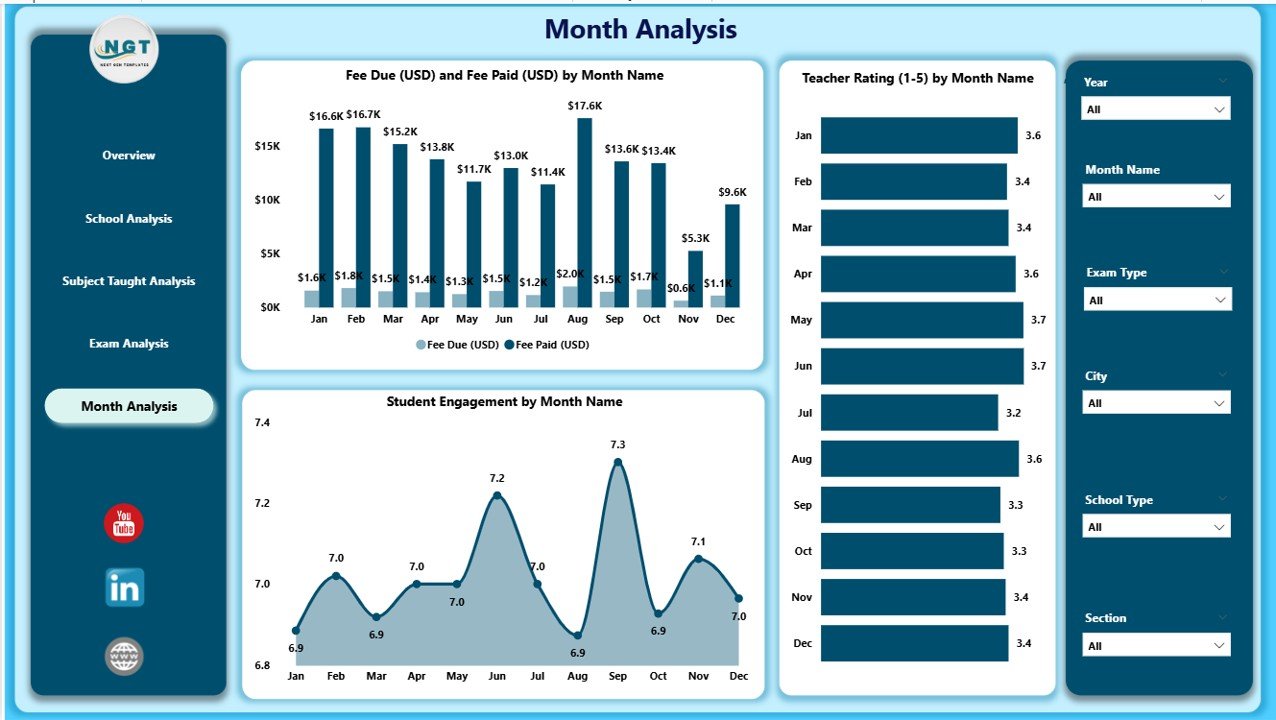
5️⃣ Monthly Trends Page — Track Progress Over Time
This page shows long-term patterns using:
-
Monthly Fee Paid & Fee Due
-
Teacher Rating by Month
-
Student Engagement by Month
Useful for planning academic calendars, events, fee reminders, and teacher evaluations.
🛠️ How to Use the Primary Schools Dashboard in Power BI
This dashboard is extremely easy to use:
1️⃣ Update your school data in the connected Excel/Power BI file
2️⃣ Refresh the dashboard
3️⃣ Use slicers to filter by month, region, exam type, or school type
4️⃣ Monitor KPIs daily on the Overview Page
5️⃣ Use analysis pages for deep insights
6️⃣ Track long-term trends for strategic decisions
No technical expertise required—everything is automated and visual. 🎯
🎯 Who Can Benefit from This Dashboard?
This dashboard is ideal for:
-
🏫 Principals
-
👩🏫 Teachers
-
📚 Academic Coordinators
-
💼 Administrative Staff
-
🧮 Fee Management Teams
-
👨👩👧 Parent Relations Teams
-
🏢 Multi-School Management Groups
Anyone involved in primary school operations benefits from clear, organized insights.
### Click here to read the Detailed blog post
Visit our YouTube channel to learn step-by-step video tutorials
👉 Youtube.com/@PKAnExcelExpert


Reviews
There are no reviews yet.