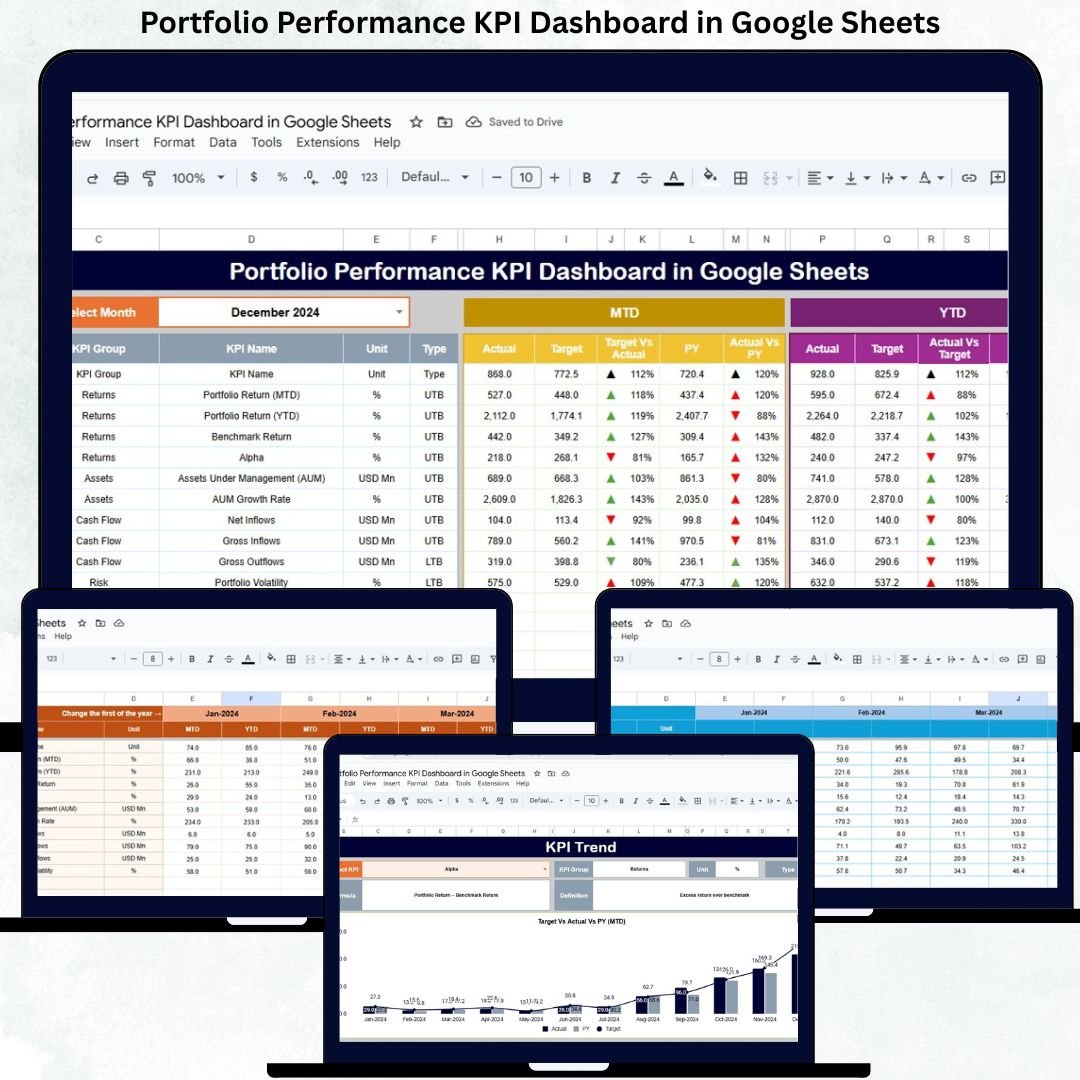
Managing an investment portfolio without clear performance visibility is risky. Returns may look healthy on the surface, but hidden risks, rising costs, or weak diversification can silently erode value. Portfolio managers, finance teams, analysts, and business owners need a structured, reliable, and real-time way to monitor performance. That is exactly what the Portfolio Performance KPI Dashboard in Google Sheets delivers.
This ready-to-use dashboard transforms complex investment data into simple KPIs, comparisons, and trends. Instead of reviewing multiple reports or tools, you get one centralized view showing how your portfolio performs against targets and historical benchmarks. Because the dashboard runs entirely in Google Sheets, it is flexible, collaborative, and cost-effective—perfect for individuals and organizations alike.
✨ Key Features of the Portfolio Performance KPI Dashboard in Google Sheets
📊 1. Automated MTD & YTD Performance Tracking
Track Month-to-Date and Year-to-Date performance for all portfolio KPIs. Once you select a month, the dashboard updates automatically—saving time and eliminating manual calculations.
📈 2. Target vs Actual & Previous Year Comparison
Instantly compare current performance with predefined targets and last year’s results. Visual indicators make it easy to identify improvement, decline, or stability.
📉 3. KPI Trend Analysis for Deeper Insights
Analyze month-wise behavior of individual KPIs using the KPI Trend Sheet. This helps you understand volatility, consistency, and long-term performance movement.
📘 4. Structured and Transparent Reporting
Six well-organized worksheets ensure clean data flow, consistent calculations, and audit-ready reporting—ideal for reviews and stakeholder discussions.
🌐 5. Cloud-Based & Collaborative
Since it runs on Google Sheets, teams can update, review, and share the dashboard in real time from anywhere.
📦 What’s Inside the Portfolio Performance KPI Dashboard in Google Sheets
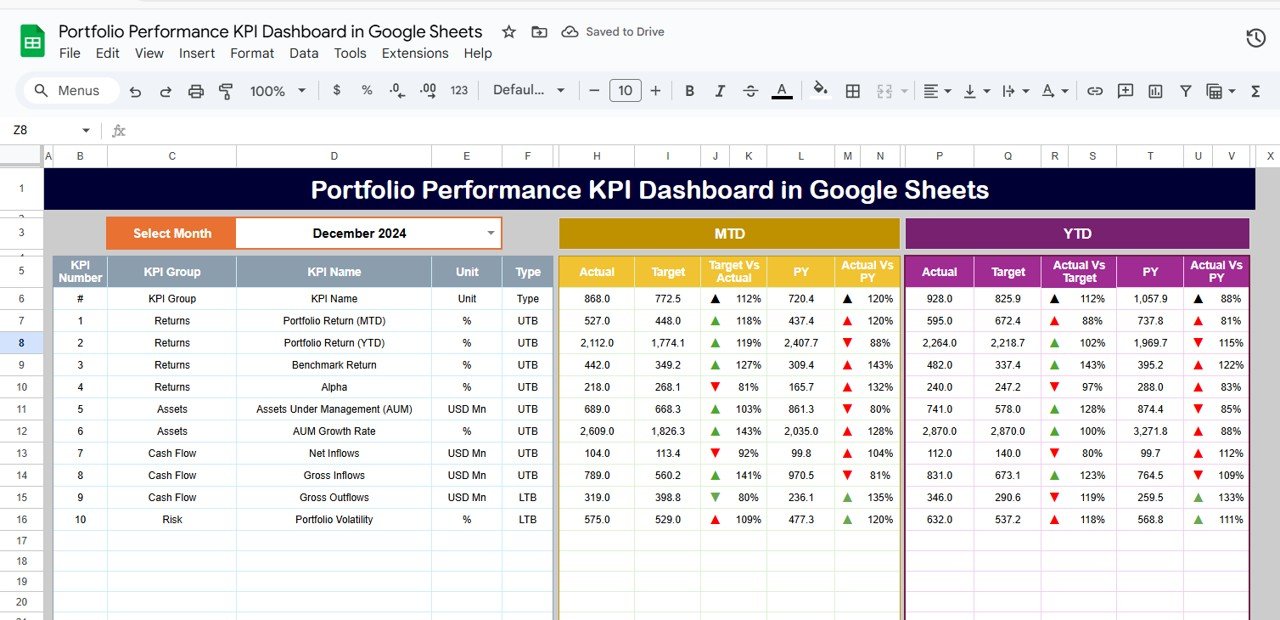
🖥️ Dashboard Sheet Tab (Main Page)
This is the central control panel. Select the month from cell D3, and the entire dashboard refreshes automatically.
Displayed metrics include:
MTD Metrics
-
Actual
-
Target
-
Previous Year
-
Target vs Actual
-
Previous Year vs Actual
YTD Metrics
-
Actual
-
Target
-
Previous Year
-
Target vs Actual
-
Previous Year vs Actual
Visual cues make interpretation instant:
-
🟢 Green arrow → Improvement
-
🔴 Red arrow → Decline
-
⚪ Neutral indicator → Stable performance
This layout allows stakeholders to assess portfolio health within seconds.
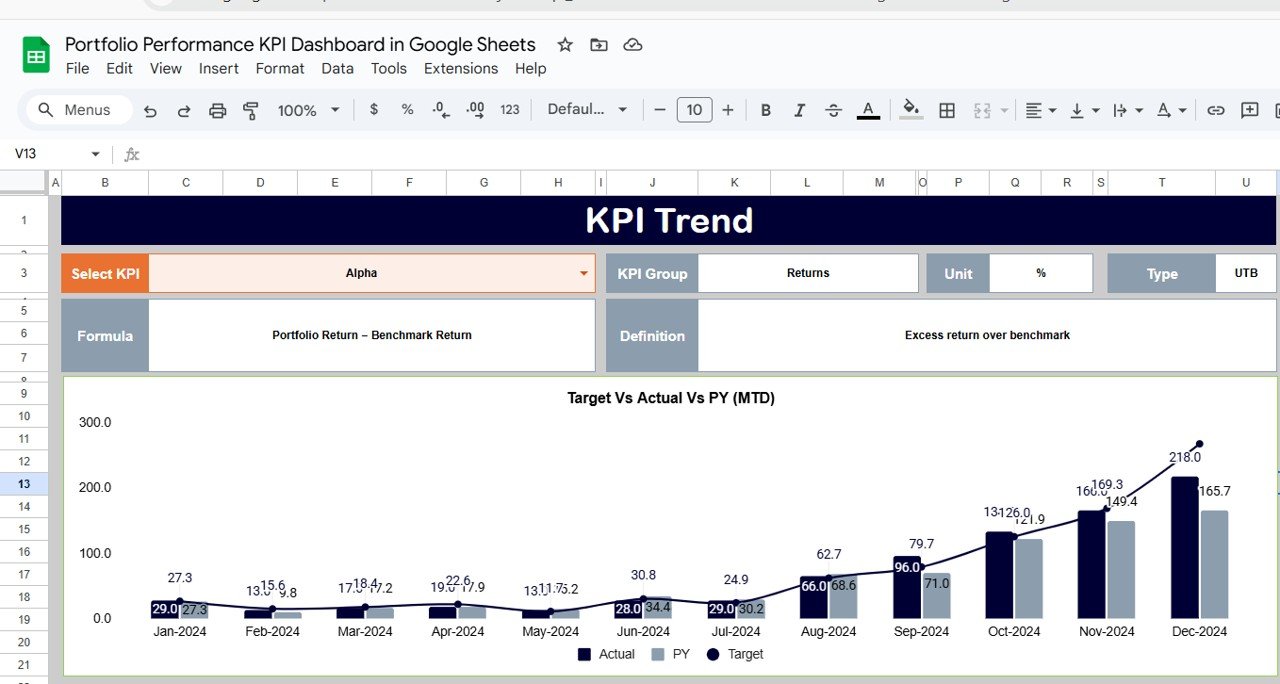
📈 KPI Trend Sheet Tab
Select any KPI from the dropdown in cell C3 to view:
-
KPI Group
-
KPI Unit
-
KPI Type (UTB / LTB)
-
KPI Formula
-
KPI Definition
Trend visuals help identify growth patterns, volatility, and performance consistency over time.
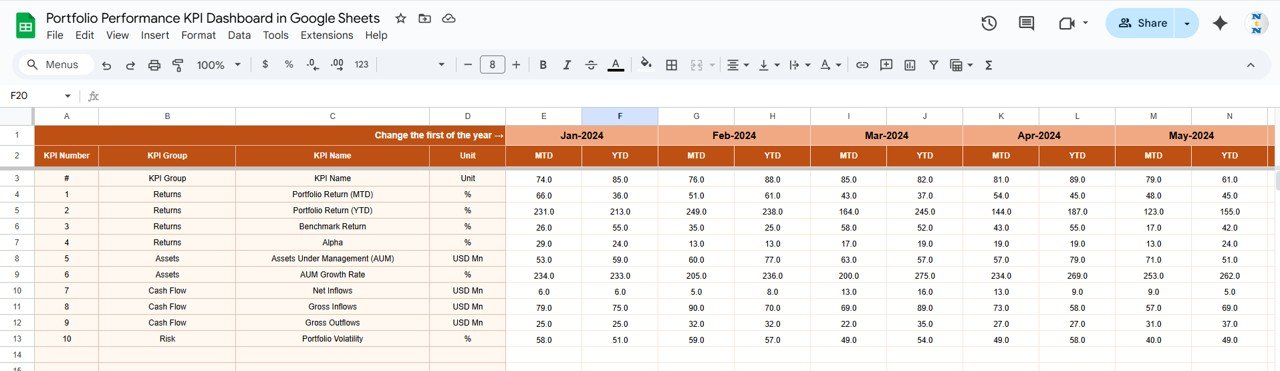
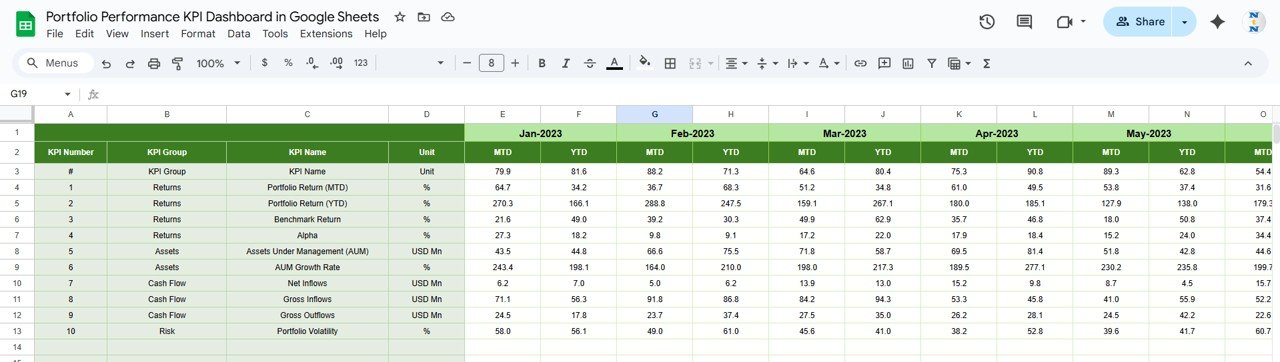
📋 Actual Number Sheet Tab
This is where real performance data is entered:
-
Input MTD and YTD actual values
-
Select the first month of the year in cell E1
Once updated, the dashboard reflects changes automatically.
🎯 Target Sheet Tab
Define performance benchmarks for each KPI:
-
Monthly targets
-
Year-to-date targets
Targets help guide strategy, evaluate success, and maintain discipline.
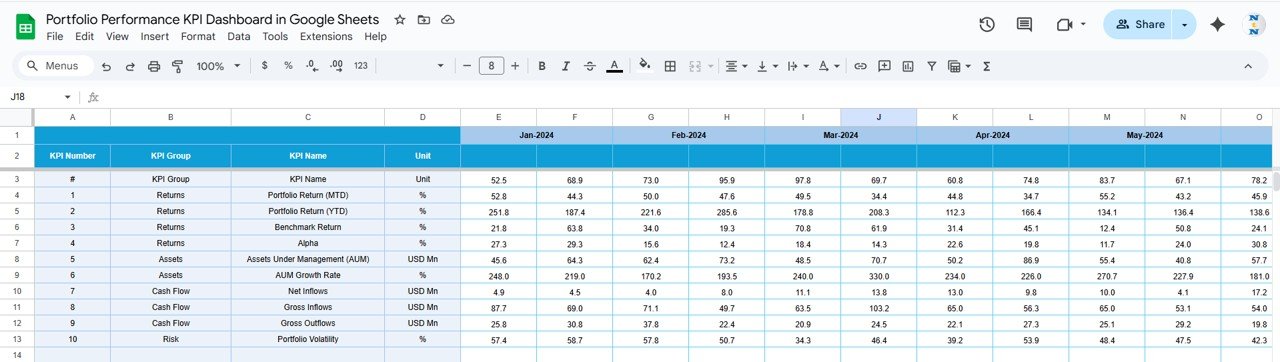
📆 Previous Year Number Sheet Tab
Store historical data for accurate year-over-year comparison. This supports long-term performance evaluation and strategic planning.
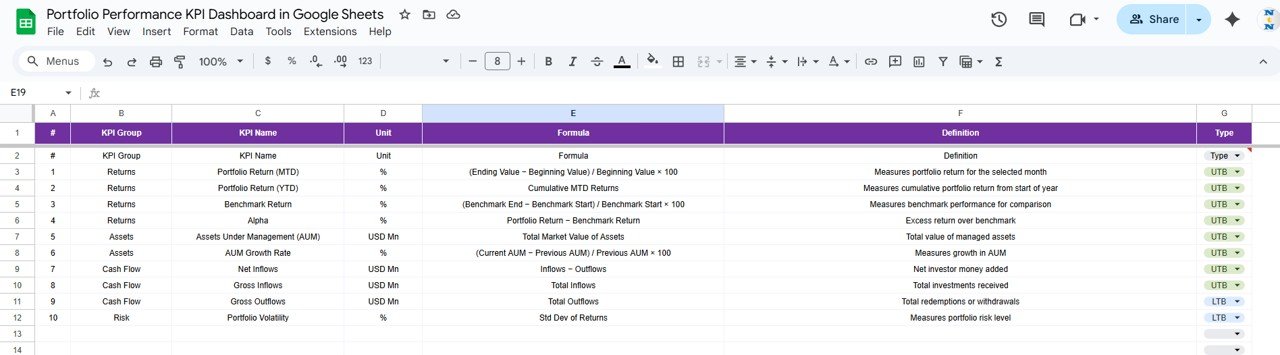
📘 KPI Definition Sheet Tab
A reference sheet containing:
-
KPI Name
-
KPI Group
-
Unit
-
Formula
-
Definition
-
KPI Type (LTB / UTB)
This ensures clarity and consistency across teams.
🛠️ How to Use the Portfolio Performance KPI Dashboard
1️⃣ Update Actual Performance Data Regularly
Enter monthly performance values to keep insights accurate.
2️⃣ Set Realistic Targets
Targets help evaluate portfolio efficiency and guide decisions.
3️⃣ Select the Month to Refresh the Dashboard
One dropdown updates all KPIs and visuals instantly.
4️⃣ Analyze KPI Trends
Use trend analysis to understand risk behavior and return stability.
5️⃣ Compare Against Previous Year
Identify improvement, stagnation, or decline early.
🎯 Who Can Benefit from This Portfolio Performance KPI Dashboard
💼 Portfolio Managers & Analysts
Monitor returns, risks, and efficiency with confidence.
📊 Finance Teams
Support reporting, reviews, and performance evaluation.
🏢 Investment Firms & Corporates
Track internal or client portfolios professionally.
🚀 Business Owners & Investors
Gain structured insights without complex tools.
📋 Audit & Governance Teams
Use clean, traceable KPI data for reviews.
### Click here to read the Detailed blog post
Watch the step-by-step video tutorial:


Reviews
There are no reviews yet.