Managing purchasing operations in port environments is complex, cost-intensive, and time-critical. Ports procure fuel, spare parts, machinery, dredging materials, IT systems, and maintenance services regularly. Therefore, even small inefficiencies in purchasing can lead to major budget overruns, vendor risks, and compliance issues.
That is exactly why the Port Purchasing KPI Dashboard in Excel is designed as a business-ready, decision-focused solution for modern port procurement teams.
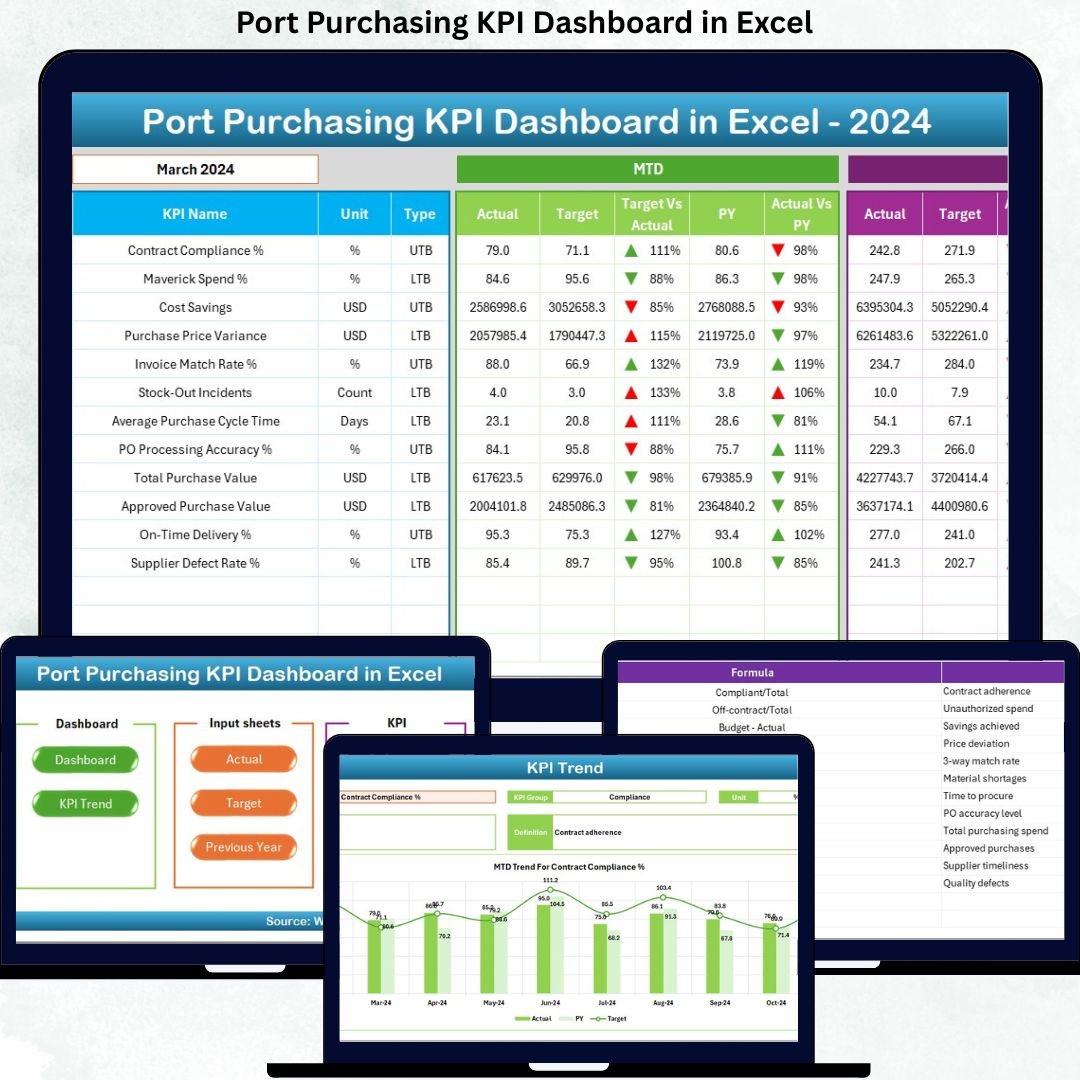
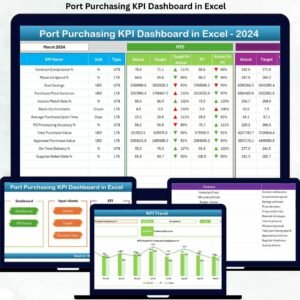
This powerful Excel-based dashboard converts scattered purchasing data into a centralized, interactive, and performance-driven KPI system. Instead of struggling with multiple spreadsheets and delayed reports, procurement teams gain instant clarity on costs, targets, trends, and variances—month by month and year to date.
Because the dashboard is built entirely in Excel, it requires no BI tools, no coding, and no complex setup. You can start tracking procurement performance immediately.
## 🚀 Key Features of Port Purchasing KPI Dashboard in Excel
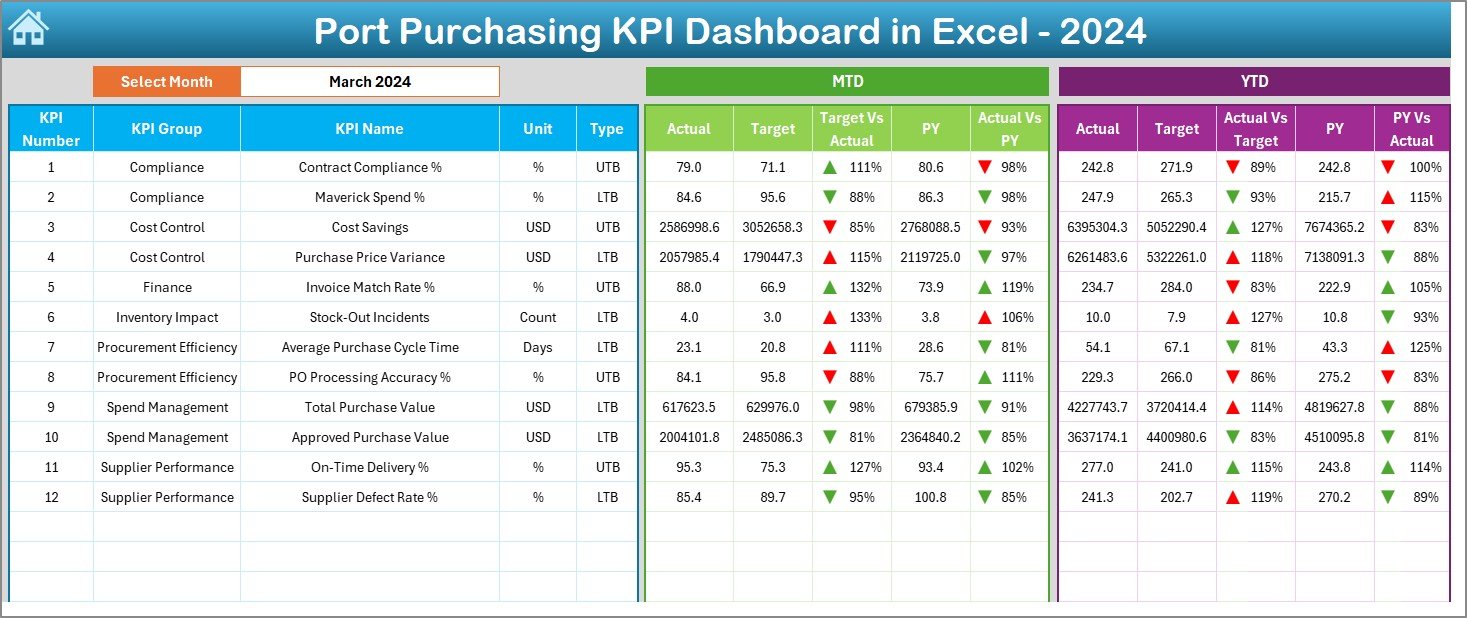
📊 Centralized KPI Monitoring – Track all critical port purchasing KPIs from a single dashboard
📅 Dynamic Month Selection – Select the reporting month and watch the entire dashboard update instantly
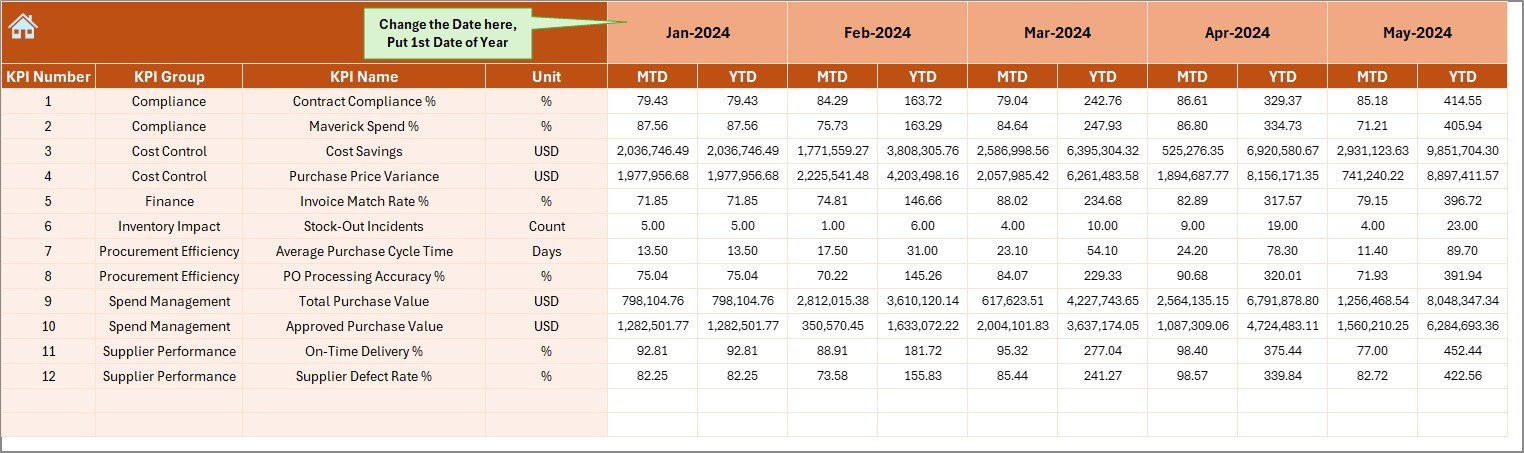
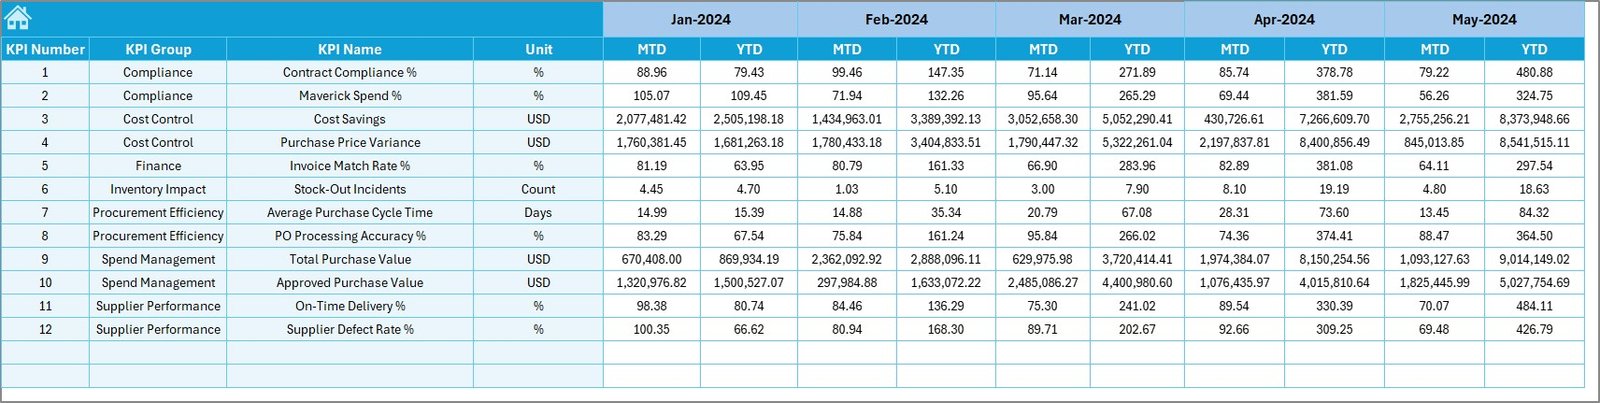
📈 MTD & YTD Performance Tracking – Monitor Month-to-Date and Year-to-Date results side by side
🎯 Target vs Actual Comparison – Identify cost overruns and efficiency gaps early
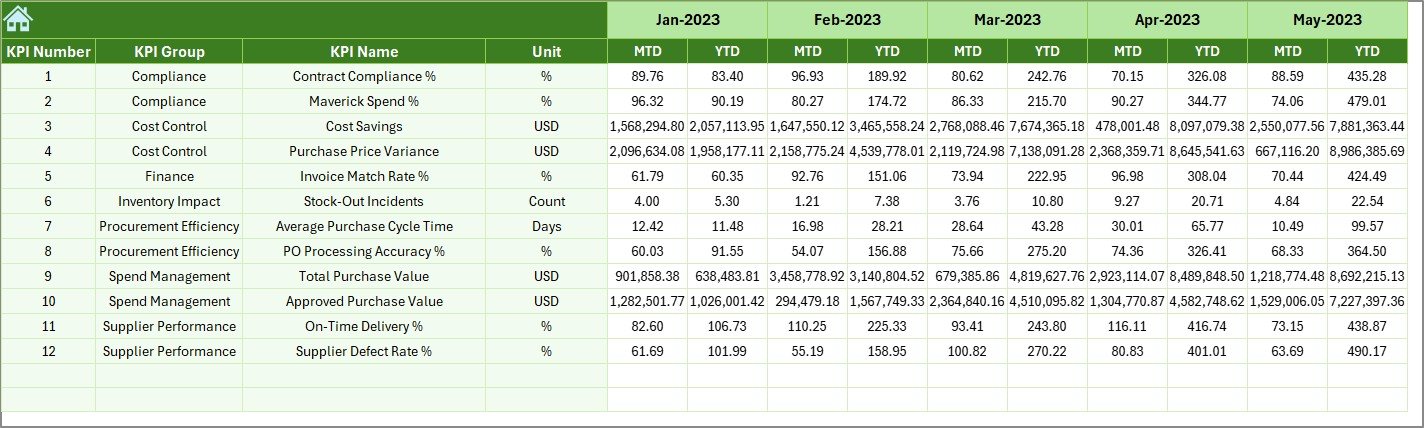
📉 Previous Year Comparison – Analyze year-over-year purchasing performance
🔼🔽 Conditional Formatting Indicators – Instantly spot overperformance and underperformance
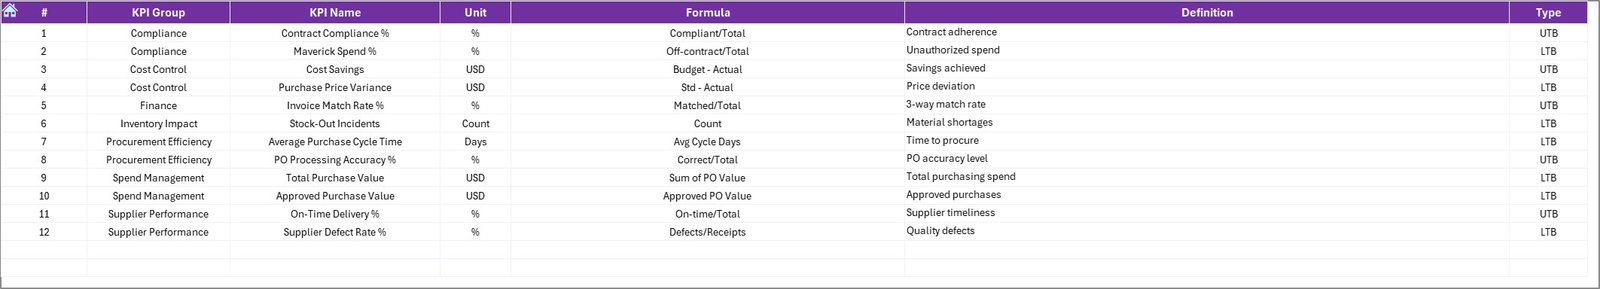
📌 Standardized KPI Definitions – Avoid confusion with clearly defined KPIs
⚙️ 100% Excel-Based Solution – No additional software required
## 📂 What’s Inside the Port Purchasing KPI Dashboard in Excel
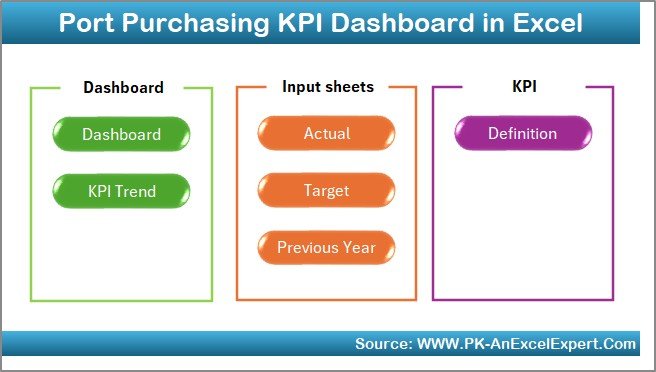
This dashboard contains 7 professionally structured worksheets, each serving a specific analytical purpose:
📄 Summary Page – A clean index sheet with navigation buttons for quick access
📊 Dashboard Sheet – The main KPI view showing MTD, YTD, Target, and PY performance
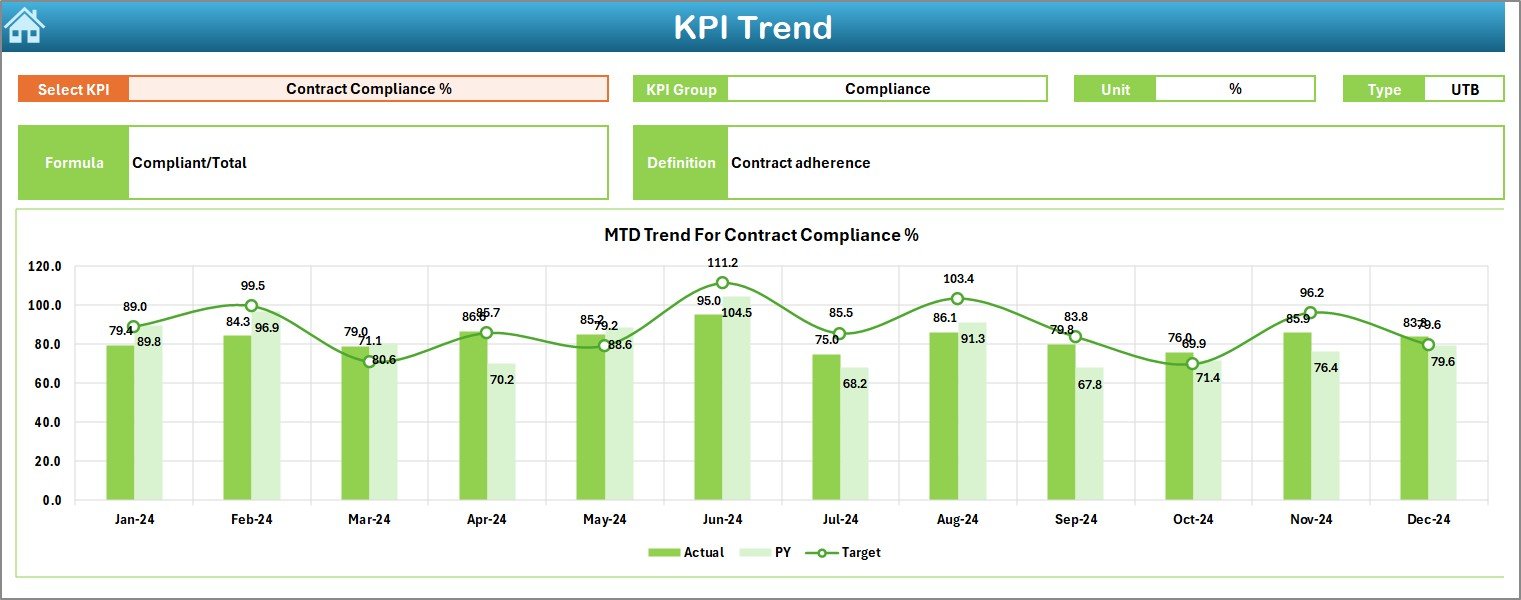
📈 Trend Sheet – KPI-wise trend analysis with MTD and YTD charts
✍️ Actual Numbers Input Sheet – Centralized entry for monthly actual purchasing data
🎯 Target Sheet – Store planned MTD and YTD procurement targets
📅 Previous Year Sheet – Capture historical KPI values for YoY analysis
📘 KPI Definition Sheet – KPI names, units, formulas, and definitions in one place
Together, these sheets ensure clarity, consistency, and control over port purchasing performance.
## 🛠️ How to Use the Port Purchasing KPI Dashboard in Excel
Using the dashboard is simple and intuitive:
1️⃣ Select the reporting month using the drop-down
2️⃣ Enter actual purchasing data in the input sheet
3️⃣ Update target and previous year values once
4️⃣ Review KPIs, variances, and trends instantly
5️⃣ Identify risks, overspending, and improvement areas
Even users with basic Excel knowledge can operate the dashboard confidently.
## 👥 Who Can Benefit from This Port Purchasing KPI Dashboard in Excel
⚓ Port Procurement Teams – Track costs, efficiency, and compliance
💰 Finance & Accounts Teams – Monitor budgets and cost variances
📋 Operations Managers – Ensure procurement supports port operations
🏢 Port Authorities & Leadership – Gain high-level purchasing insights
📊 Consultants & Analysts – Use ready-made KPIs for reporting and audits
Whether you manage a small port or a large multi-terminal operation, this dashboard scales easily.
Click here to read the Detailed Blog Post
Watch the step-by-step video tutorial:


Reviews
There are no reviews yet.