


Modern organic farming requires smart decisions, fast insights, and accurate performance tracking. But with daily activities like soil management, irrigation, labor, fertilizer use, and production quality, managing everything manually becomes stressful. Organic Farming KPI Dashboard in Power BI That’s where the Organic Farming KPI Dashboard in Power BI becomes a game-changer.
Organic Farming KPI Dashboard in Power BI This ready-to-use dashboard converts raw Excel data into beautiful, interactive visuals—helping farmers, farm managers, and agriculture analysts monitor performance, reduce waste, increase productivity, and boost profitability. With MTD/YTD insights, trend charts, drill-through capability, and clean KPI definitions, this dashboard becomes the ultimate solution for data-driven farming.
It doesn’t matter whether you run a small organic farm or manage large-scale agricultural operations—this dashboard gives you clarity, control, and confidence in every farming decision.
🌟 Key Features of Organic Farming KPI Dashboard in Power BI
1️⃣ Interactive Summary Page – Your Farm’s Control Center 🧭

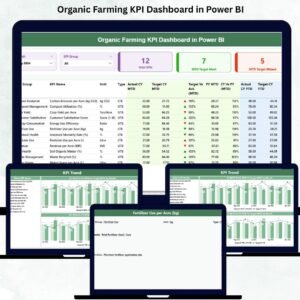
The dashboard’s main page gives you a complete picture of your organic farming performance.
-
Month slicer for instant MTD/YTD analysis
-
KPI Group slicer (Soil, Irrigation, Fertilizer, Labor, Profitability & more)
-
Cards showing Total KPIs, Target Met, and Target Missed
-
A detailed KPI table with Actual, Target, Trend Icons (▲▼), and PY comparison
Everything you need to analyze performance appears in one place—clear, organized, and easy to understand.
2️⃣ KPI Trend Page – Visualize Performance Over Time 📈
Track how your farming KPIs change month after month:
-
Combo charts for Actual, Target & Previous Year
-
MTD and YTD trend visuals
-
KPI Name slicer for quick switching
This helps you spot trends, identify gaps, and take action before issues grow.
3️⃣ KPI Definition Page – Zero Confusion, Full Transparency 📘
Each KPI opens into a detailed explanation page:
-
KPI Name, Group & Number
-
Unit and Type (LTB/UTB)
-
Formula
-
Clear definition
Perfect for teams—everyone knows exactly how each KPI works.
📦 What’s Inside the Organic Farming KPI Dashboard
This product includes everything you need to start tracking your organic farm performance right away:
✔ A fully built Power BI Dashboard with 3 pages
-
Summary Page
-
KPI Trend Page
-
KPI Definition Page
✔ A structured Excel file with 3 sheets
-
Input_Actual
-
Input_Target
-
KPI_Definition
✔ Pre-defined KPI logic & formulas
Just enter your monthly farm data and refresh the dashboard.
✔ Clean UI with conditional formatting
Green ▲ for improvement, Red ▼ for decline.
✔ Drill-through functionality
Click any KPI and instantly see its definition.
🛠 How to Use the Organic Farming KPI Dashboard
Using this dashboard is extremely simple—even for beginners.
1️⃣ Enter your actual performance data
Fill the Input_Actual sheet with MTD & YTD actuals.
2️⃣ Enter your target values
Use the Input_Target sheet to define goal values.
3️⃣ Update KPI details (if needed)
Add or modify KPI entries in the KPI Definition sheet.
4️⃣ Load the Excel file into Power BI Desktop
With one refresh, all visuals update instantly.
5️⃣ Use slicers & drill-through for deep analysis
Compare months, groups, targets, trends, and past performance effortlessly.
This dashboard is built for both beginners and experts—no coding required.
👥 Who Can Benefit from This Organic Farming KPI Dashboard?
🌾 Farmers & Farm Owners
Track soil health, irrigation efficiency, production, and cost—all in one place.
🧑🌾 Farm Managers
Monitor team performance, resource usage, and operational KPIs.
📊 Agriculture Analysts
Get ready datasets, structured KPIs, and clear trend analysis.
🏢 Agribusiness Companies
Improve planning, forecasting, and decision-making.
🎓 Students & Researchers
Use it as a practical tool for agricultural analytics.
This dashboard is designed for anyone who wants to make smart farming decisions with data—not guesswork.


Reviews
There are no reviews yet.