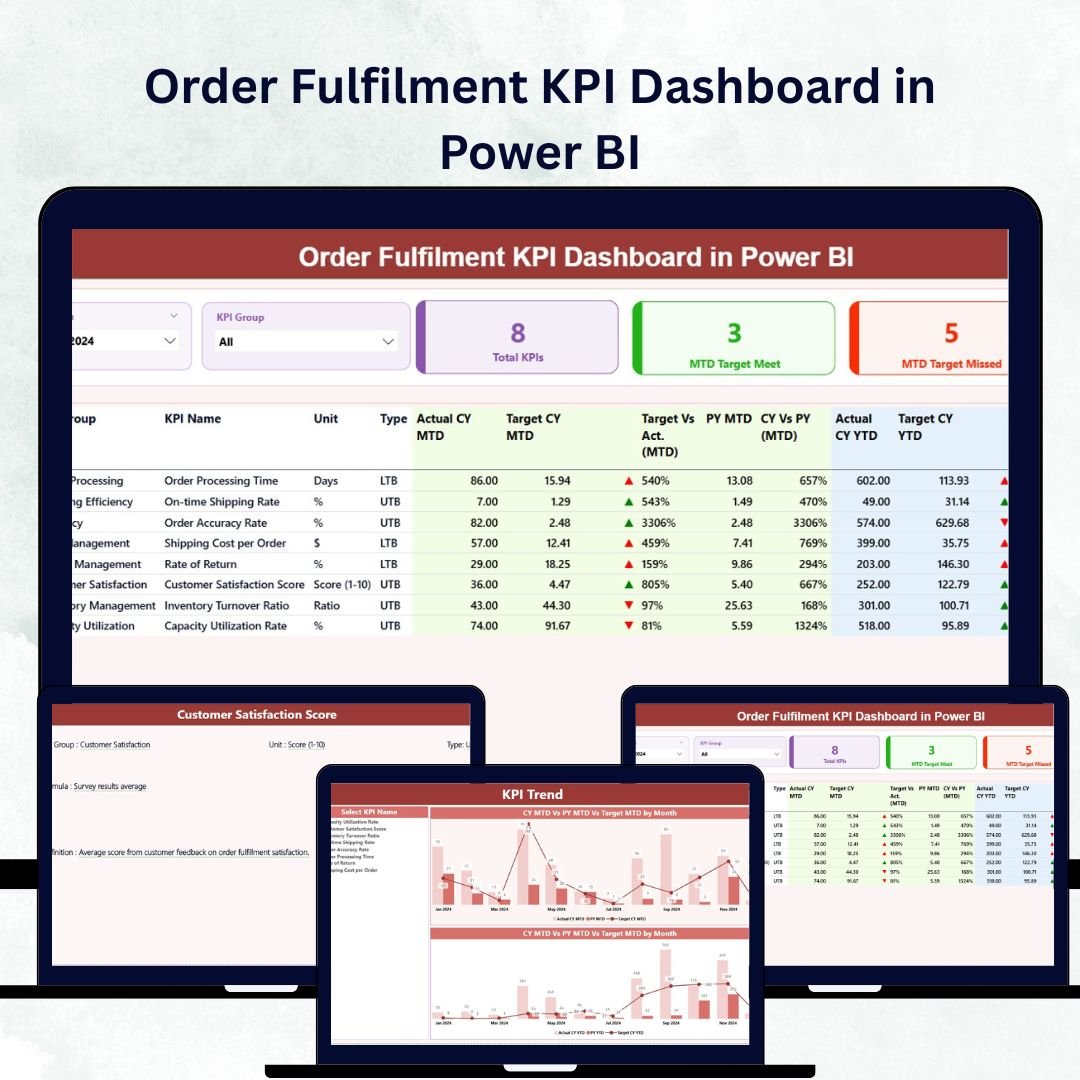
In the competitive world of supply chain and logistics, every second counts. The Order Fulfilment KPI Dashboard in Power BI is a powerful, ready-to-use solution that transforms your raw operational data into actionable insights — helping you track, measure, and optimize the entire order fulfilment process.
Whether you manage procurement, warehousing, or delivery, this dashboard provides a 360° view of your order cycle performance through interactive visuals, smart KPIs, and automated analytics. It eliminates manual tracking, reduces errors, and enables faster decision-making by displaying real-time data in an easy-to-understand format.
Built on Microsoft Power BI and connected to Excel or live data sources, this dashboard empowers managers to monitor progress, analyze trends, and ensure that every order reaches customers accurately and on time.
⚙️ Key Features of the Order Fulfilment KPI Dashboard in Power BI
📊 Three Interactive Pages – Complete Order Tracking
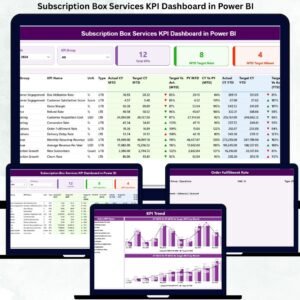
This dashboard includes three main pages — Summary Page, KPI Trend Page, and KPI Definition Page — each designed for a specific level of analysis.
📋 Summary Page – The Command Center
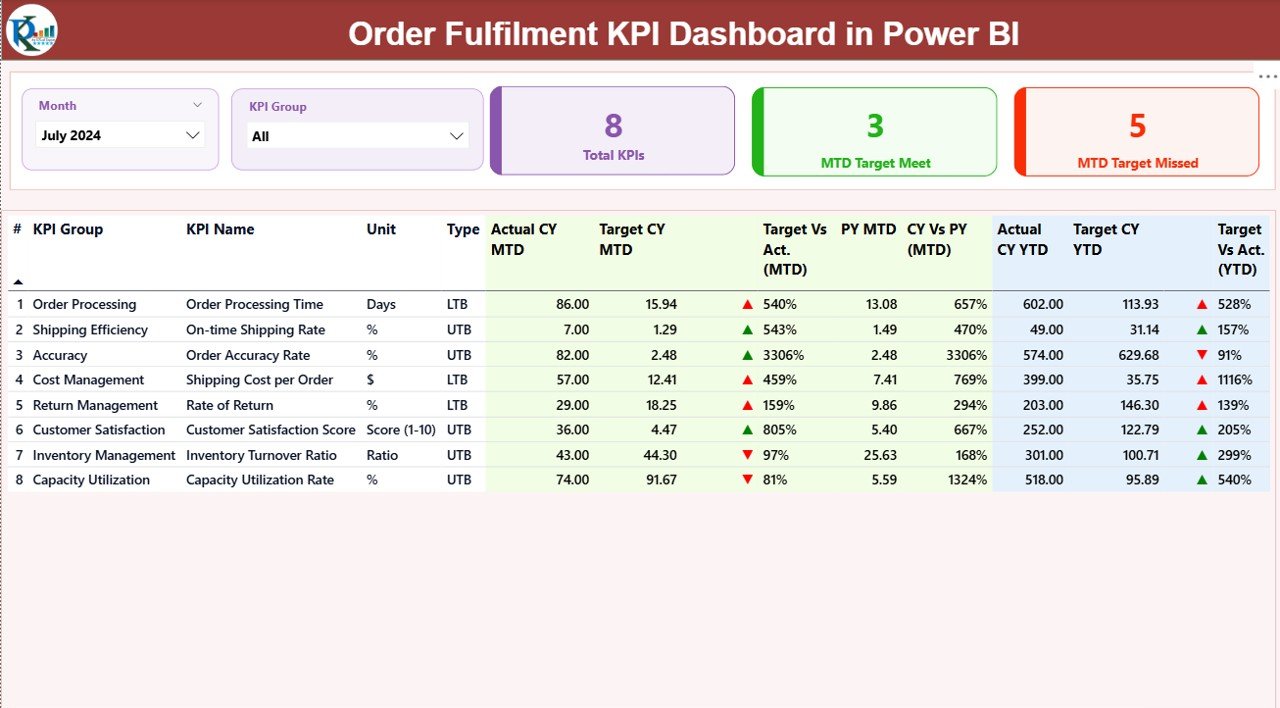
Gain instant visibility into Month-to-Date (MTD) and Year-to-Date (YTD) performance metrics.
-
Slicers: Filter by Month or KPI Group.
-
Performance Cards: Show Total KPIs, MTD Target Met, and MTD Target Missed.
-
Detailed KPI Table: Displays KPI Name, Group, Unit, Type (LTB/UTB), Actual vs Target, PY Comparisons, and MTD/YTD Icons.
-
Color-Coded Icons: Green ▲ and Red ▼ instantly highlight KPIs that are on track or lagging behind.
This intuitive page provides managers with a one-glance overview of operational performance across all stages of order fulfilment.
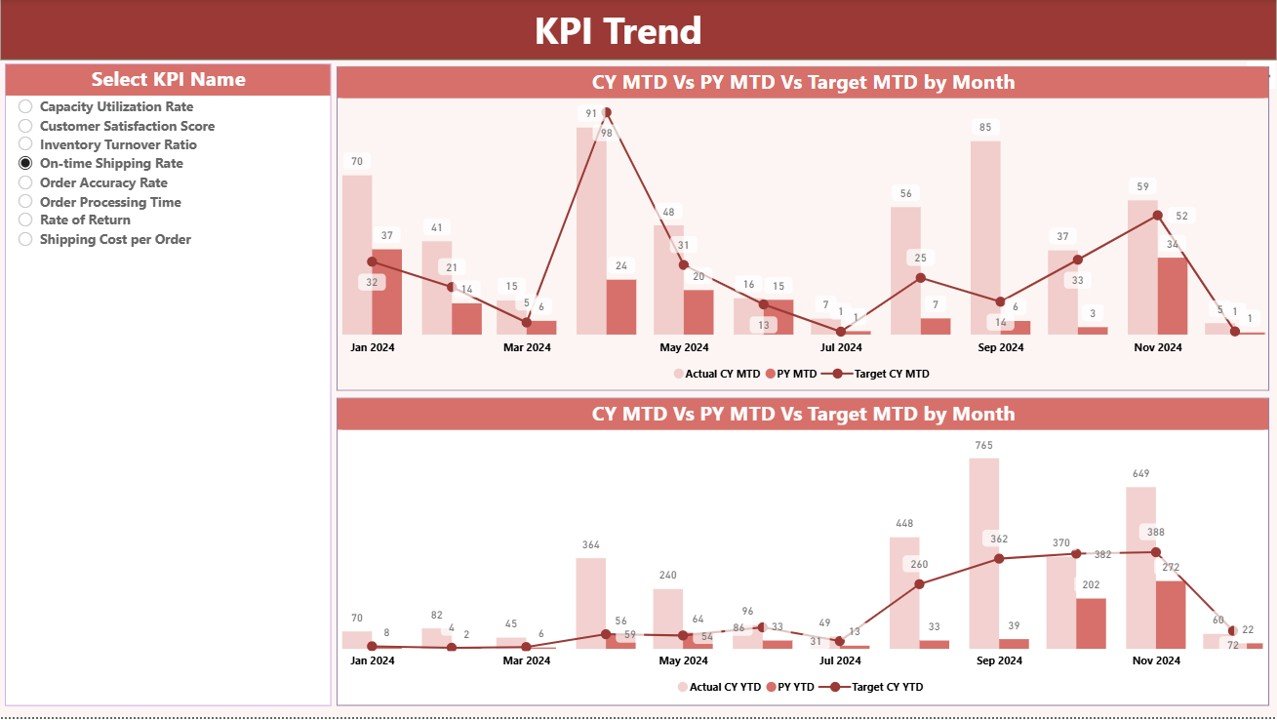
📈 KPI Trend Page – Track Performance Over Time
Understand the story behind your numbers with dual combo charts that compare Actual, Target, and Previous Year metrics.
-
Slicer for KPI Selection: Pick any KPI to explore its performance trend.
-
MTD and YTD Charts: Visualize progress over time and detect performance patterns.
Perfect for uncovering long-term trends, seasonal variations, and identifying which processes require improvement.
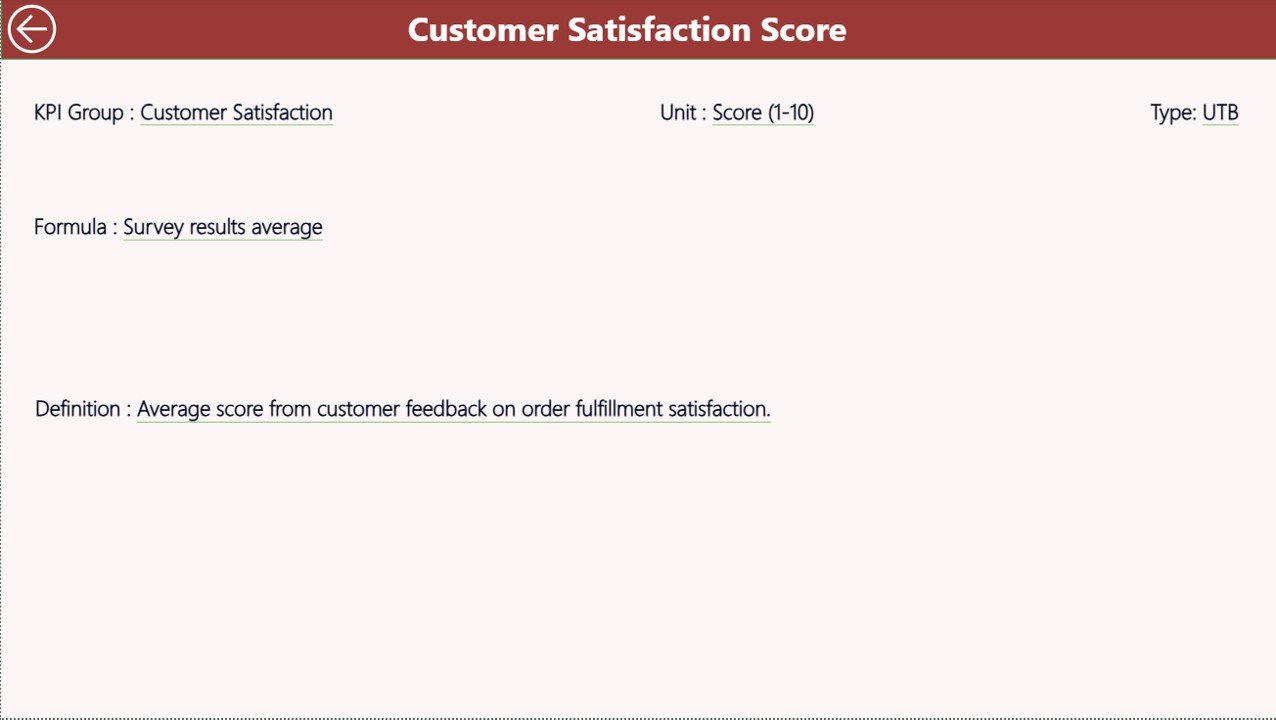
📘 KPI Definition Page – Your KPI Reference Library
Drill through from the Summary Page to view formula definitions and calculation methods for each KPI.
-
Details Shown: Formula, Definition, and Type (LTB or UTB).
-
Back Button: Quickly return to the Summary Page.
This ensures transparency and consistency in how performance metrics are defined and tracked.
📊 What’s Inside the Order Fulfilment KPI Dashboard
1️⃣ Summary Page: Real-time view of MTD and YTD KPI performance.
2️⃣ KPI Trend Page: Comparative visualizations for historical and target tracking.
3️⃣ KPI Definition Page: Contextual details for every KPI metric.
4️⃣ Excel Data Source: Input_Actual, Input_Target, and KPI_Definition sheets for data management.
Each component works seamlessly to create a unified, data-driven reporting environment for supply chain operations.
🧭 How to Use the Order Fulfilment KPI Dashboard
✅ Step 1: Connect your Excel file containing Actual, Target, and KPI Definition data.
✅ Step 2: Open the Power BI (.pbix) file and refresh the data model.
✅ Step 3: Use the Month and KPI Group slicers to filter data dynamically.
✅ Step 4: View MTD and YTD results with clear visual cues.
✅ Step 5: Drill through to the KPI Definition Page for detailed explanations.
✅ Step 6: Publish the report to Power BI Service for organization-wide access.
Within minutes, your data is transformed into a live, interactive dashboard ready for insights and decision-making.
👥 Who Can Benefit from This Dashboard
🏢 Supply Chain Managers: Monitor end-to-end order fulfilment efficiency.
🚚 Logistics Teams: Track delivery performance and identify process gaps.
📦 Warehouse Supervisors: Evaluate picking, packing, and order accuracy.
💼 Operations Executives: Assess MTD and YTD achievements against set targets.
📊 Business Analysts: Conduct in-depth trend and variance analysis.
🌟 Advantages of the Order Fulfilment KPI Dashboard in Power BI
✅ Real-Time Visibility: Get instant updates on operational performance.
✅ Improved Efficiency: Identify and address order processing bottlenecks.
✅ Target Achievement Tracking: Compare actual performance vs targets for both MTD and YTD.
✅ Trend Analysis: Understand progress across months and years.
✅ Automation: Eliminate manual reporting and human errors.
✅ Customizable Design: Add, edit, or redefine KPIs as per your organization’s goals.
✅ Data Accuracy: Excel-based input ensures standardization and reliability.
✅ Collaboration: Share dashboards securely via Power BI Service or Teams.
🔗 Click here to read the Detailed Blog Post
🎥 Visit our YouTube channel for step-by-step tutorials
🔗 YouTube.com/@PKAnExcelExpert


Reviews
There are no reviews yet.