
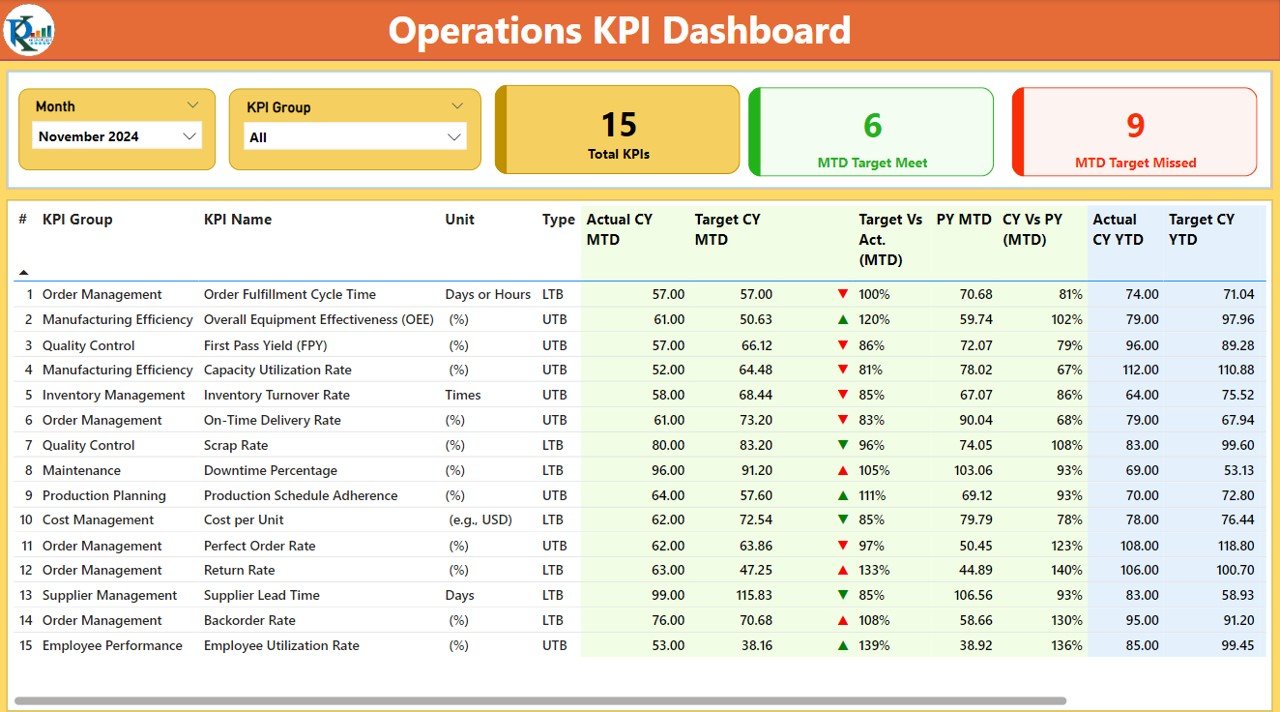


The Operations KPI Dashboard in Power BI is an advanced, dynamic tool designed to help businesses track and analyze their operational performance. This customizable dashboard offers a real-time overview of critical key performance indicators (KPIs) such as efficiency, productivity, cost management, and resource utilization, all in one place.
Designed with Power BI’s powerful data visualization capabilities, this dashboard helps managers and decision-makers quickly identify trends, areas of improvement, and overall operational health. With interactive visuals and intuitive features, you can gain actionable insights into your business operations and make data-driven decisions to drive growth and efficiency.
Key Features of the Operations KPI Dashboard in Power BI
📊 Real-Time Data Visualization: View real-time data with interactive charts and KPIs, making complex information easy to understand.
⚙️ Customizable KPIs: Tailor the dashboard to track the most relevant operational metrics specific to your business.
📈 Performance Analysis: Analyze operational efficiency, productivity, and resource utilization to identify trends and bottlenecks.
📅 Time-Based Tracking: Monitor performance over different time periods (daily, weekly, monthly) for accurate trend analysis.
📉 Comparative Data: Compare KPIs across departments, locations, or teams to assess performance and identify opportunities.
🔄 Interactive Dashboard: Click and interact with visuals to drill down into specific data points for deeper analysis.
🧑💼 User-Friendly Interface: Easy-to-navigate design ensures that the dashboard is accessible to everyone, regardless of technical expertise.
Why You’ll Love the Operations KPI Dashboard in Power BI
✅ Streamlined Operations Monitoring: Easily monitor multiple KPIs from different areas of your business in one centralized location.
✅ Data-Driven Decision Making: Make more informed decisions by visualizing real-time data and analyzing operational trends.
✅ Increased Efficiency: Identify inefficiencies in processes and quickly implement corrective actions to improve operations.
✅ Customizable for Your Business: Adapt the dashboard to fit your industry-specific needs, whether you are in manufacturing, logistics, or retail.
✅ Interactive Features: Engage with data and uncover actionable insights with interactive filtering and drill-down features.
What’s Inside the Operations KPI Dashboard in Power BI?
📊 Visual KPI Displays: Track key metrics such as sales, production efficiency, resource utilization, and cost management.
📈 Trend and Performance Analysis: Visualize trends over time and compare performance across different time periods.

⚙️ Customizable Filters: Use filters to focus on specific teams, departments, or business units.
📅 Time-Based Data Insights: Analyze KPIs over daily, weekly, monthly, or yearly timelines.
🔄 Interactive Charts: Engage with your data by clicking on visuals for deeper insights into specific metrics.
How to Use the Operations KPI Dashboard in Power BI
1️⃣ Download the Dashboard Template – Get immediate access to the Power BI file upon purchase.
2️⃣ Customize the KPIs: Tailor the dashboard to track your business-specific KPIs for a more personalized experience.
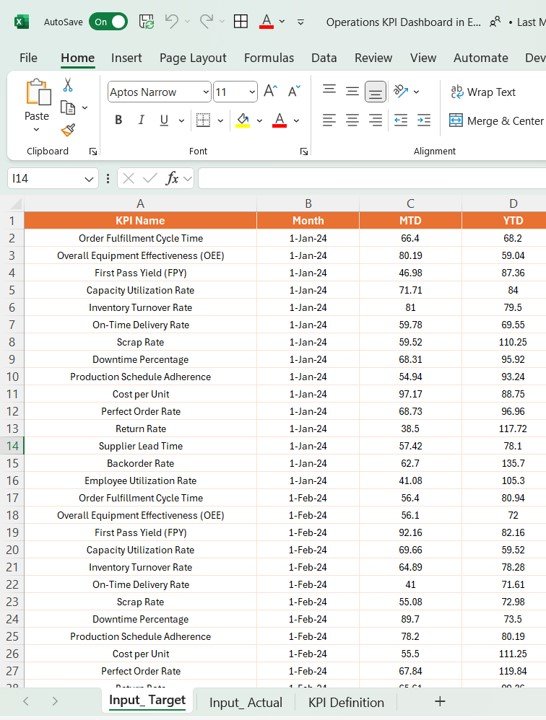
3️⃣ Input Your Data: Connect your data sources to Power BI and start visualizing your operations performance.
4️⃣ Monitor and Analyze: Use the interactive features to track and analyze key metrics in real-time.
5️⃣ Generate Reports: Create reports based on selected KPIs to share with stakeholders or for performance reviews.
Who Can Benefit from the Operations KPI Dashboard in Power BI?
🔹 Operations Managers
🔹 Business Analysts
🔹 Supply Chain Managers
🔹 Manufacturing Managers
🔹 HR Managers
🔹 Executive Leadership Teams
🔹 Retail Operations Teams
Transform the way you monitor and manage operations with this advanced and easy-to-use KPI dashboard in Power BI.
Click here to read the detailed blog post
Visit our YouTube channel to learn step-by-step video tutorials
Also check our Expense Tracking Dashboard in Power BI


Reviews
There are no reviews yet.