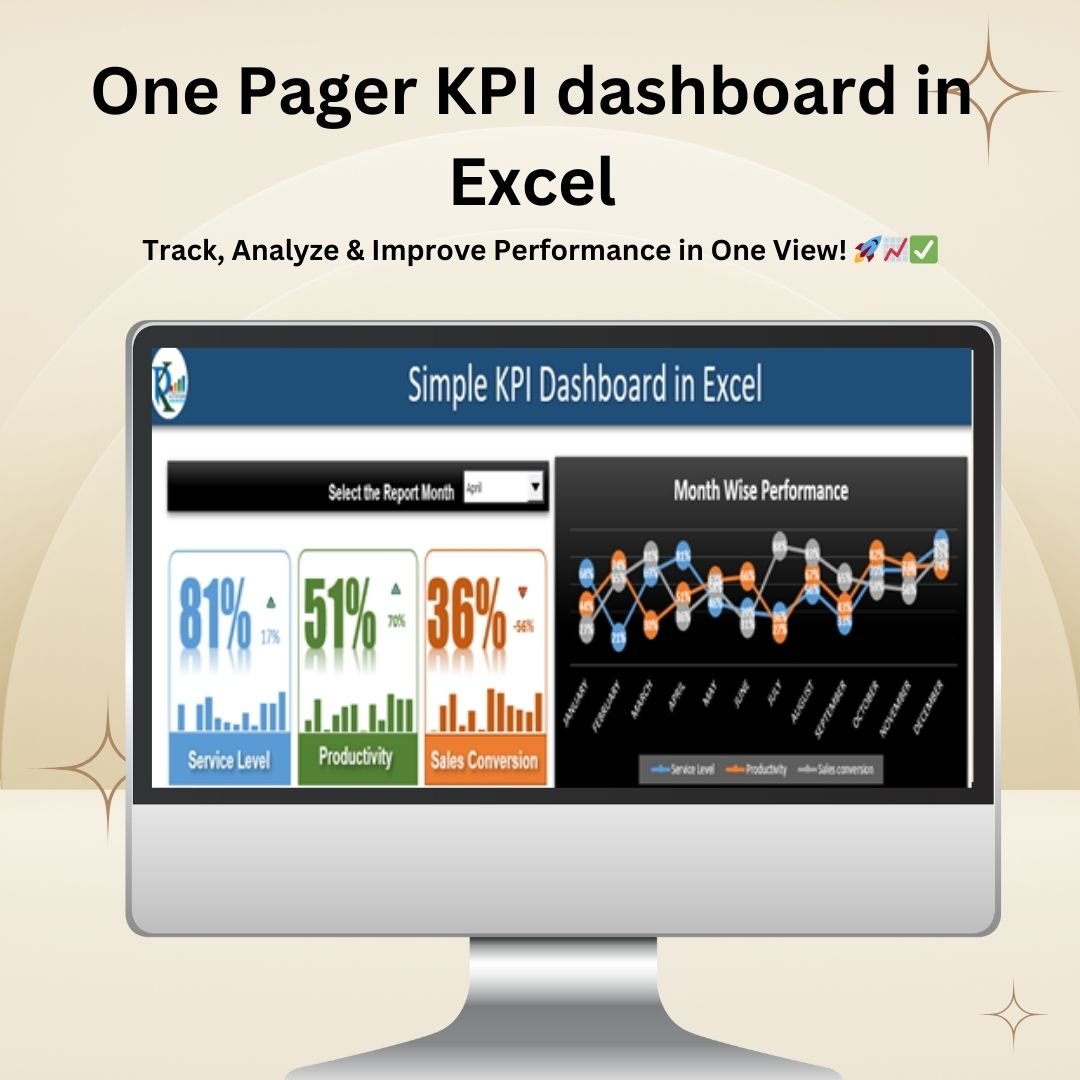
In today’s fast-paced business environment, making data-driven decisions is key to staying ahead. The One Pager KPI Dashboard in Excel provides a streamlined, visually engaging, and highly functional solution for tracking key performance indicators (KPIs). Whether you’re monitoring Service Level, Productivity, or Sales Conversion, this dashboard is designed to give you real-time insights in a compact, easy-to-read format.
Why Choose the One Pager KPI Dashboard?
This interactive Excel dashboard offers an intuitive interface with dynamic visuals, making it effortless to track performance at a glance. You can quickly analyze month-over-month progress, spot trends, and identify areas for improvement. It’s the perfect solution for business managers, analysts, and team leads who need an efficient and automated way to measure success.
Key Features:
📊 Comprehensive KPI Overview
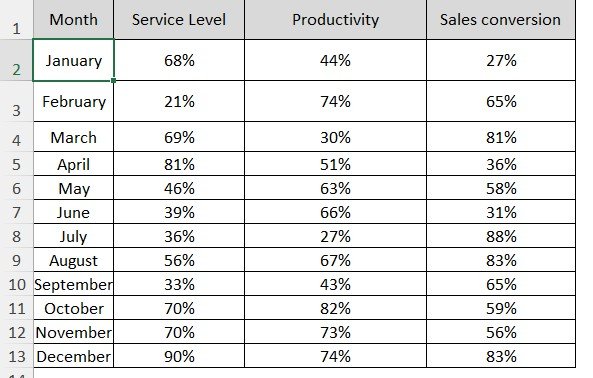
- The dashboard displays three essential KPIs: Service Level, Productivity, and Sales Conversion.
- Each KPI is visually represented with trend analysis and month-over-month comparisons.
- Helps businesses quickly assess performance, identify growth areas, and take corrective actions.
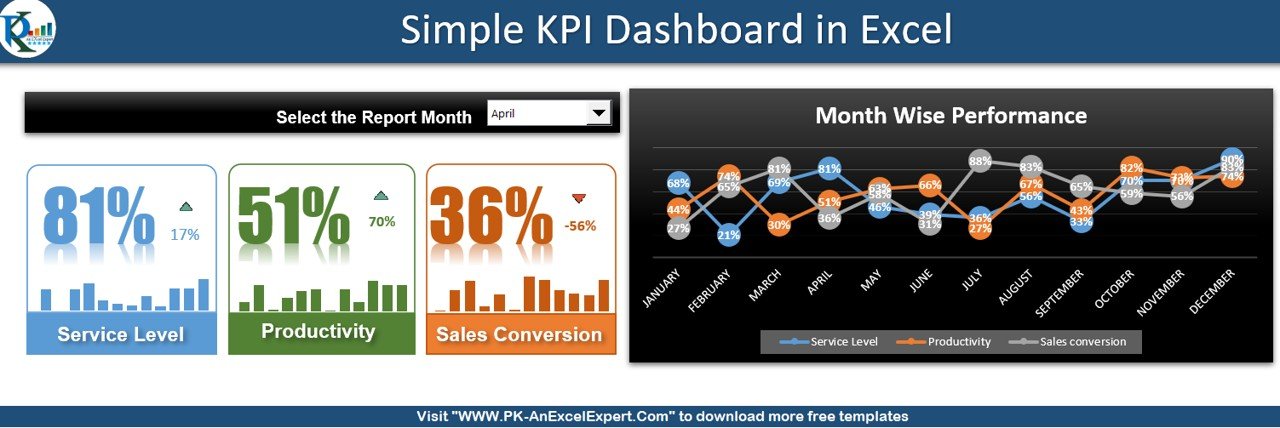
🔄 Interactive Combo Box
- The report month selector allows users to pick a month from the dropdown.
- Automatically updates all visuals and data fields to reflect the selected month.
- Eliminates the need for manual adjustments and enhances data exploration.
📌 Dynamic Textbox Display
- Key KPI values are presented in a readable, visually engaging manner.
- Textboxes automatically update based on real-time data inputs.
- Helps teams quickly grasp performance trends without analyzing raw numbers.
📈 Visual Percentage Change Indicators
- Color-coded arrows indicate improvements (green) or declines (red).
- Users can instantly spot positive or negative performance trends.
- Enhances decision-making by highlighting areas needing attention.
📉 Trend Analysis with Sparklines
- 12-month trend sparklines allow quick visualization of KPI progress.
- Provides a historical perspective on performance fluctuations.
- Helps in recognizing long-term trends for strategic planning.
📊 Detailed Monthly Trend Chart
- The dashboard includes a line chart for month-wise KPI performance.
- Displays Service Level, Productivity, and Sales Conversion trends across the year.
- Aids in analyzing seasonal patterns and predicting future performance.
🎯 User-Friendly & Highly Customizable
- The layout is structured for clarity, with minimal data clutter.
- You can customize colors, fonts, and labels to match your business needs.
- Simple yet powerful data visualization to make reporting more insightful.
Who Can Benefit from This Dashboard?
✅ Business Managers – Quickly analyze company-wide performance trends.
✅ Sales & Marketing Teams – Track sales conversion rates and productivity.
✅ HR & Operations Teams – Monitor service levels and overall business efficiency.
✅ Entrepreneurs & Small Businesses – Get a snapshot of business performance in seconds.
Unlock the Power of Data-Driven Decision-Making
With the One Pager KPI Dashboard in Excel, you get a powerful yet simple solution to track key performance metrics without overwhelming complexity. Whether you are tracking business performance or making strategic decisions, this Excel dashboard simplifies data visualization and enhances reporting.
Click here to read the detailed blog post One Pager KPI dashboard in Excel
Watch the step-by-step video tutorial :One Pager KPI dashboard in Excel
Also check our Inventory Management Form in Excel


Reviews
There are no reviews yet.