Are waste costs silently increasing in your office? Are recycling targets just numbers in reports? It’s time to turn scattered waste records into powerful insights.
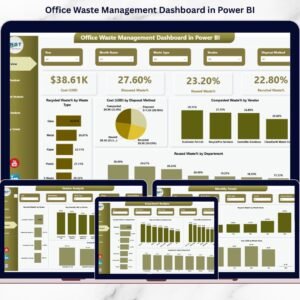
The Office Waste Management Dashboard in Power BI is a ready-to-use, interactive business intelligence solution designed to help organizations monitor waste performance, control disposal costs, and improve sustainability metrics — all in one place.
Instead of juggling Excel sheets and manual reports, this dashboard gives you real-time clarity on recycling %, reuse %, composting %, department performance, and vendor efficiency.
If your company is serious about reducing landfill waste and improving ESG reporting, this dashboard is your ultimate control center.
🔑 Key Feature of Office Waste Management Dashboard in Power BI
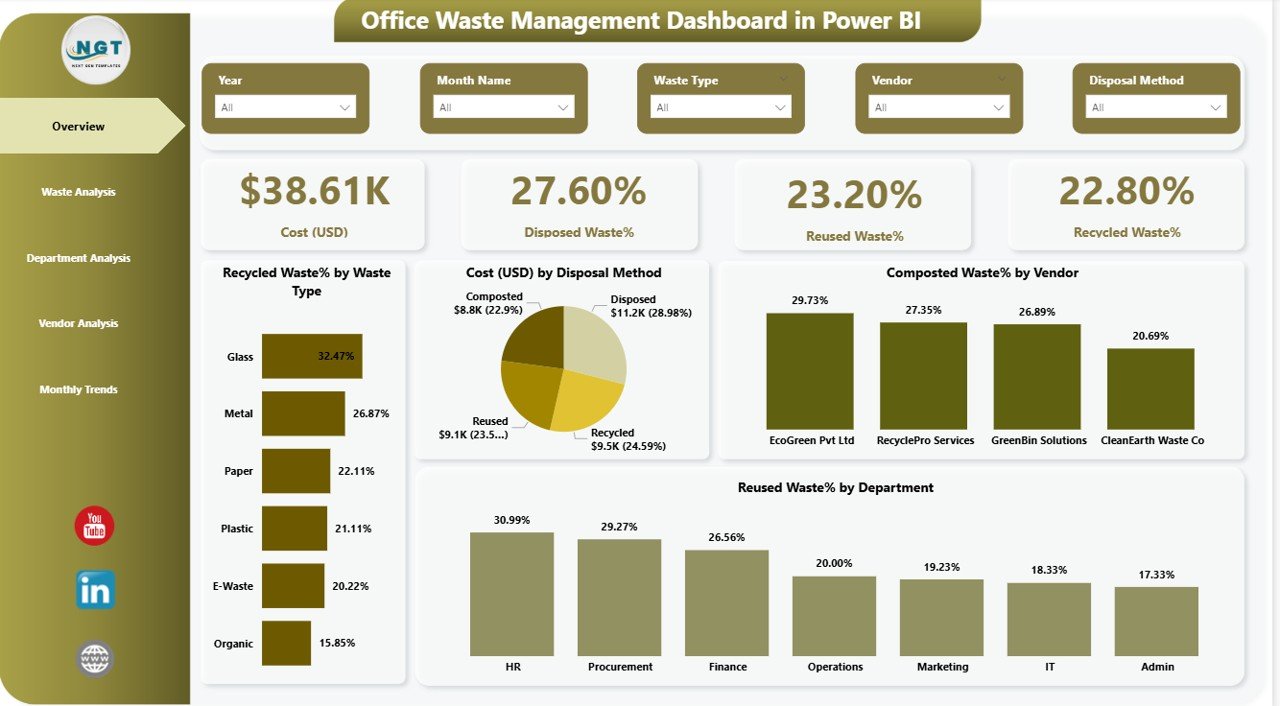
✨ Interactive KPI Cards
Track Cost (USD), Recycled %, Reused %, and Disposed % instantly.
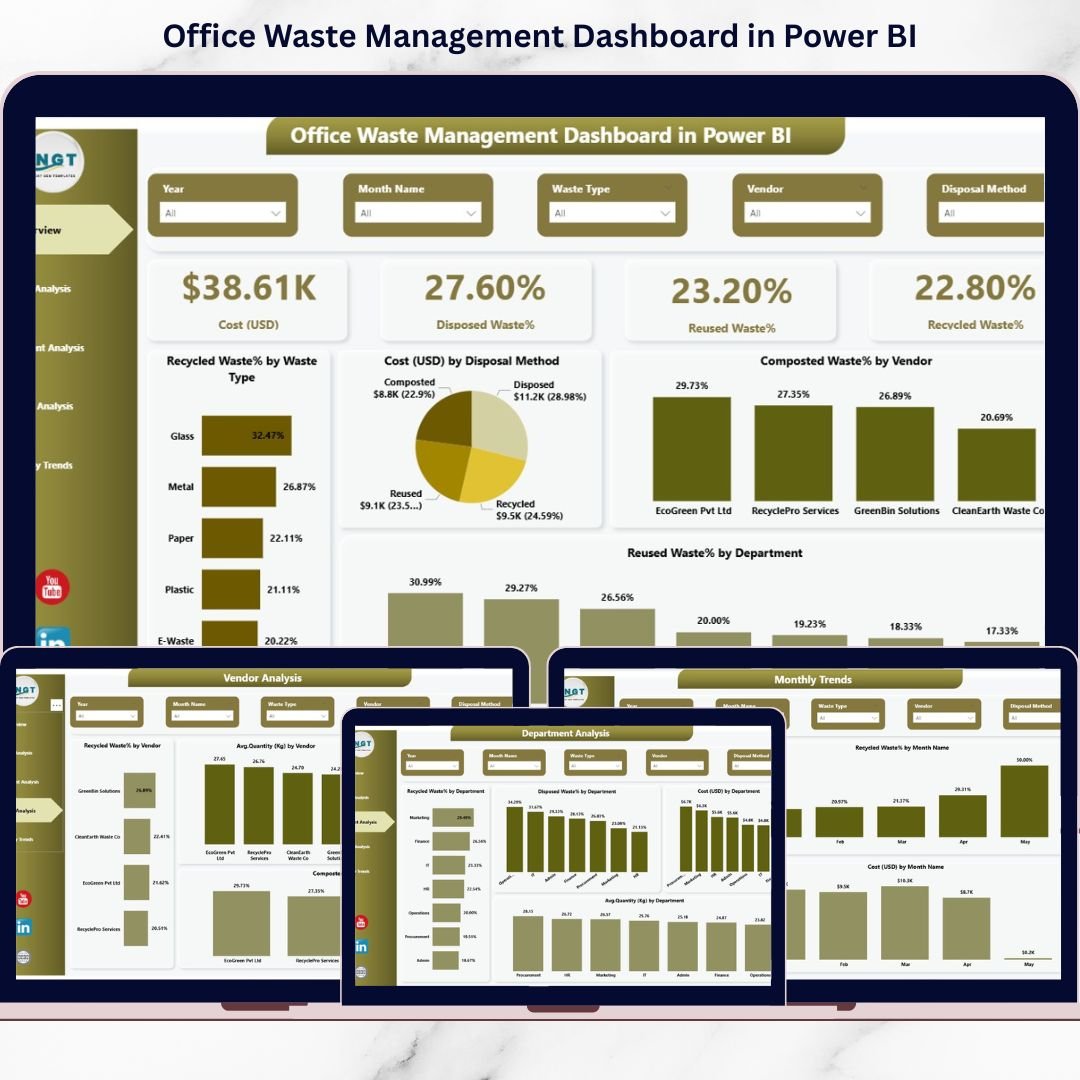
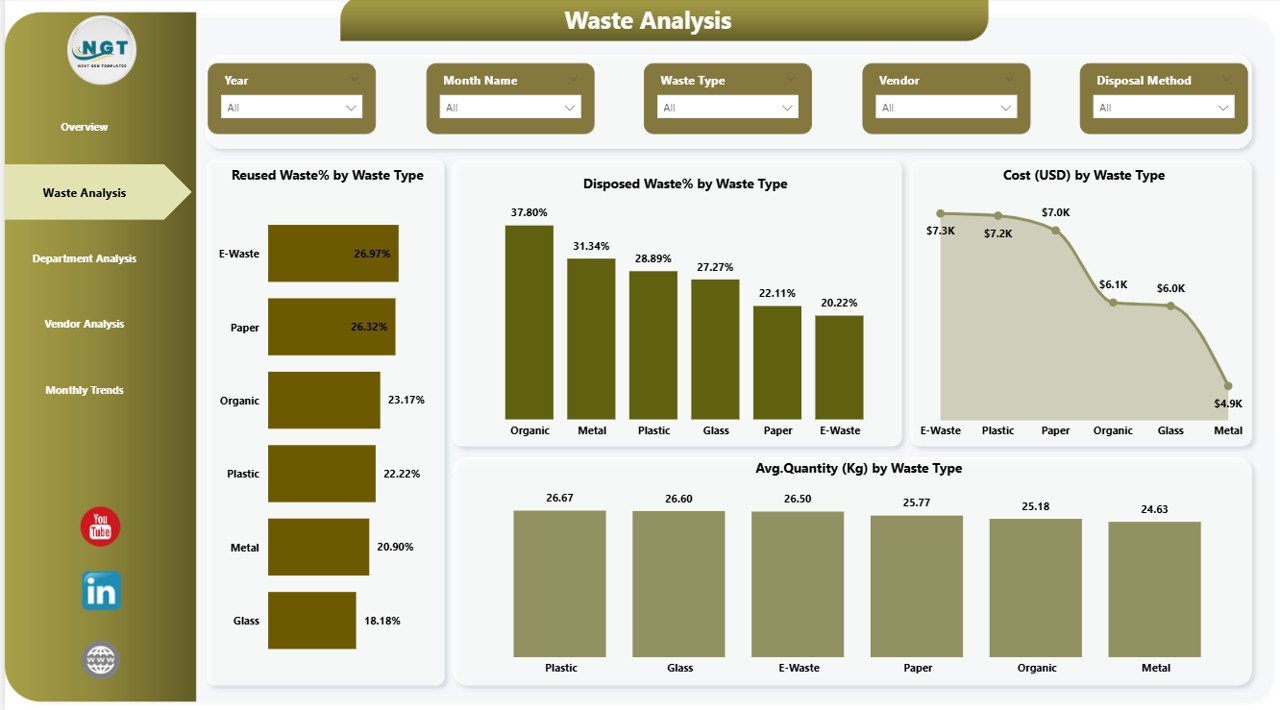
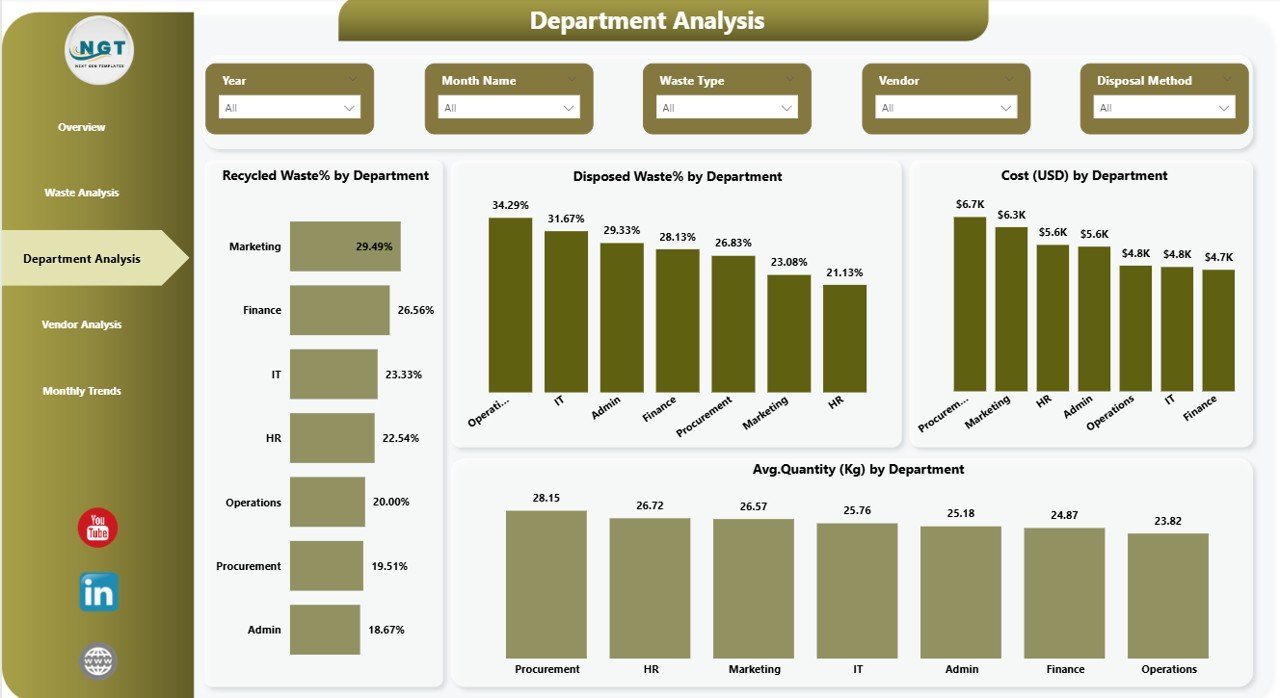
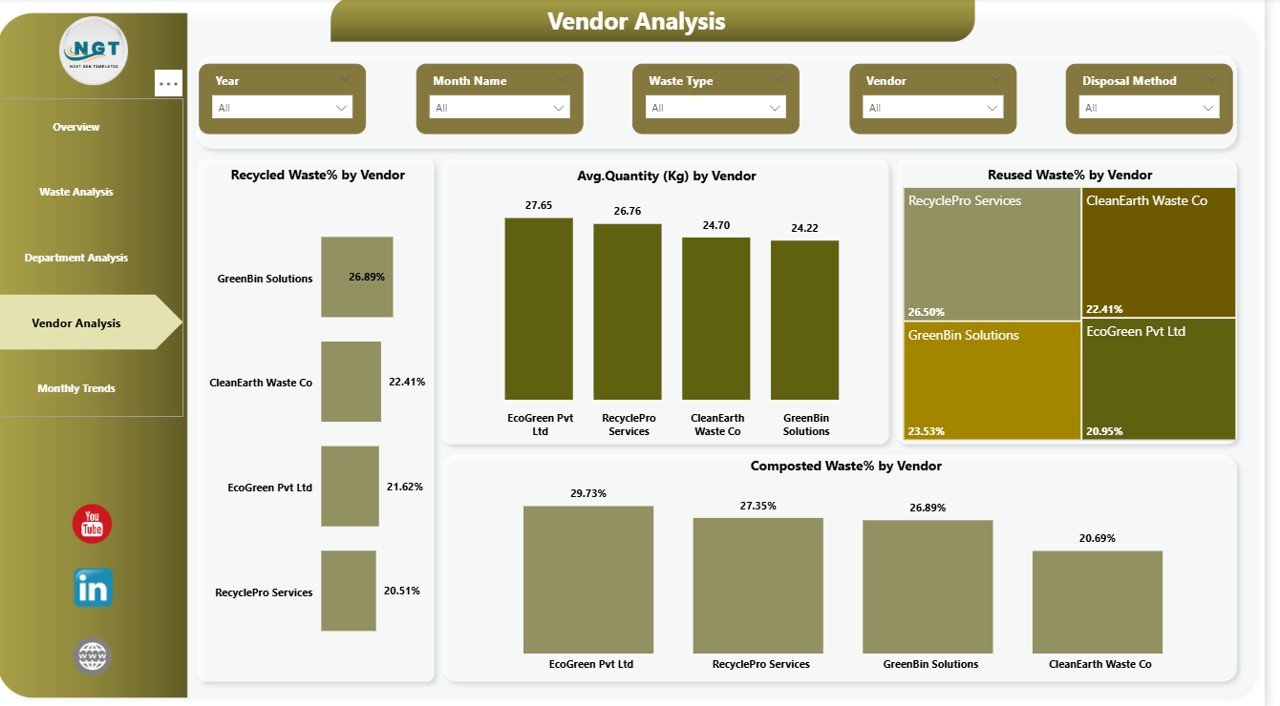
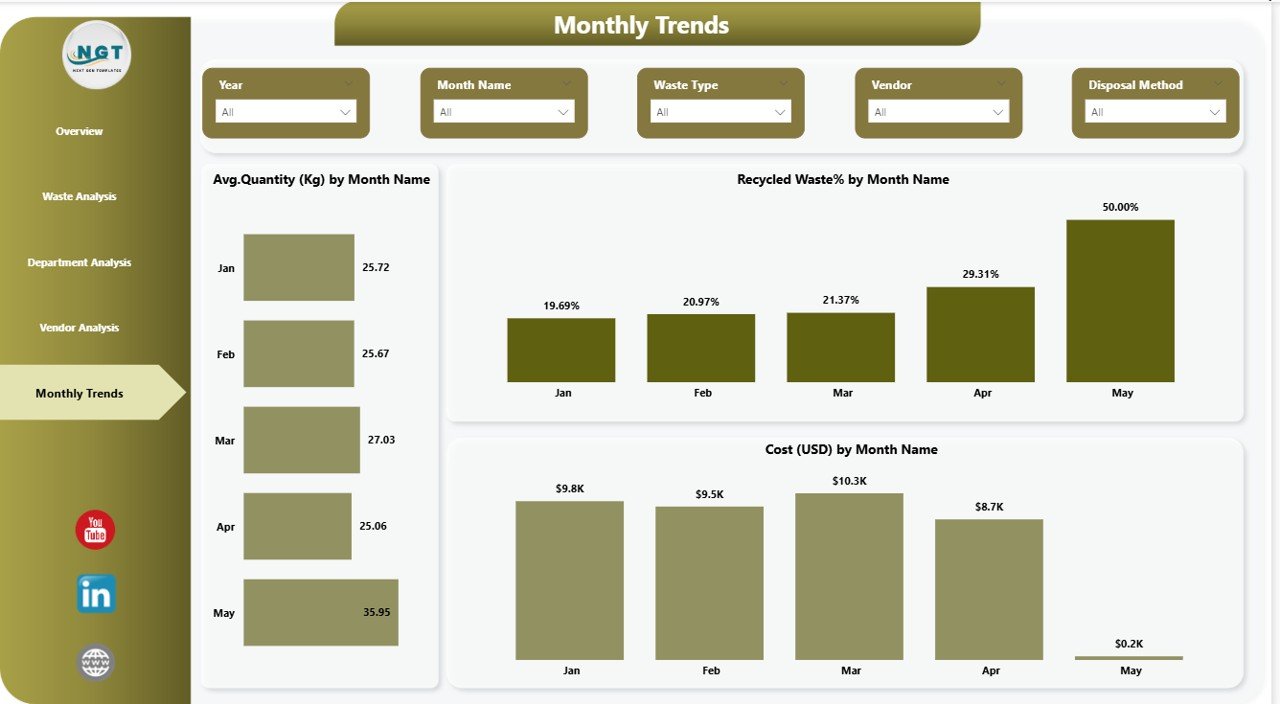
📊 5 Powerful Analytical Pages
Overview, Waste Analysis, Department Analysis, Vendor Analysis, and Monthly Trends.
🔍 Dynamic Filters (Slicers)
Filter by Department, Waste Type, Vendor, or Month in seconds.
💰 Cost Monitoring System
Identify which waste type or department increases disposal cost.
♻️ Sustainability Tracking
Measure recycling and composting performance accurately.
📈 Monthly Trend Insights
Spot seasonal waste patterns and unexpected spikes.
🏢 Department Accountability
Compare waste performance across teams.
🤝 Vendor Performance Evaluation
Analyze recycling efficiency and renegotiate contracts confidently.
⚡ Real-Time Data Refresh
Update your dataset and instantly see updated visuals.
📦 What’s Inside the Office Waste Management Dashboard in Power BI
When you download this product, you receive:
✔️ Power BI Desktop (.pbix) File
✔️ 5 Fully Designed Interactive Pages
✔️ Pre-built KPIs and Visuals
✔️ Dynamic Slicers for Filtering
✔️ Waste Cost & Sustainability Metrics
✔️ Department & Vendor Comparison Charts
✔️ Monthly Trend Analysis
✔️ Clean and Professional Layout
The dashboard captures essential fields such as:
-
Waste Type (Paper, Plastic, Food, E-waste, etc.)
-
Quantity (KG)
-
Disposal Method
-
Vendor Details
-
Department
-
Cost (USD)
-
Date
Everything is structured and optimized for meaningful analysis.
🚀 How to Use the Office Waste Management Dashboard in Power BI
Using this dashboard is simple and practical:
1️⃣ Import your waste data into Power BI.
2️⃣ Ensure columns like Date, Waste Type, Department, Vendor, Quantity (KG), Cost (USD), and Disposal Method are included.
3️⃣ Refresh the dataset.
4️⃣ Use slicers to filter by month, department, or vendor.
5️⃣ Review KPIs and charts to identify improvement areas.
For best results:
-
Update data monthly.
-
Define clear waste categories.
-
Set recycling % targets.
-
Conduct quarterly department reviews.
-
Evaluate vendors annually.
Within minutes, you can see:
-
Which waste type generates the highest cost
-
Which department has poor recycling performance
-
Which vendor relies heavily on landfill disposal
-
How waste trends change month by month
👥 Who Can Benefit from This Office Waste Management Dashboard in Power BI
🏢 Corporate Offices
🏫 Educational Institutions
🏥 Hospitals & Healthcare Facilities
🏢 IT & Tech Companies
🏭 Manufacturing Admin Offices
🌱 ESG & Sustainability Teams
📊 Operations & Facility Managers
💼 Finance & Cost Control Departments
Whether your office has 20 employees or 2,000, waste tracking directly impacts operational efficiency and environmental responsibility.
This dashboard does more than show numbers. It empowers organizations to:
✔️ Reduce disposal costs
✔️ Improve recycling percentage
✔️ Strengthen sustainability reporting
✔️ Support ESG & CSR initiatives
✔️ Increase department accountability
✔️ Make data-driven decisions
In today’s world, sustainability is not optional. It is measurable, reportable, and strategic. And this dashboard helps you achieve that with clarity.
If your organization wants smarter waste tracking, better cost control, and improved sustainability performance, this solution gives you everything you need — instantly.