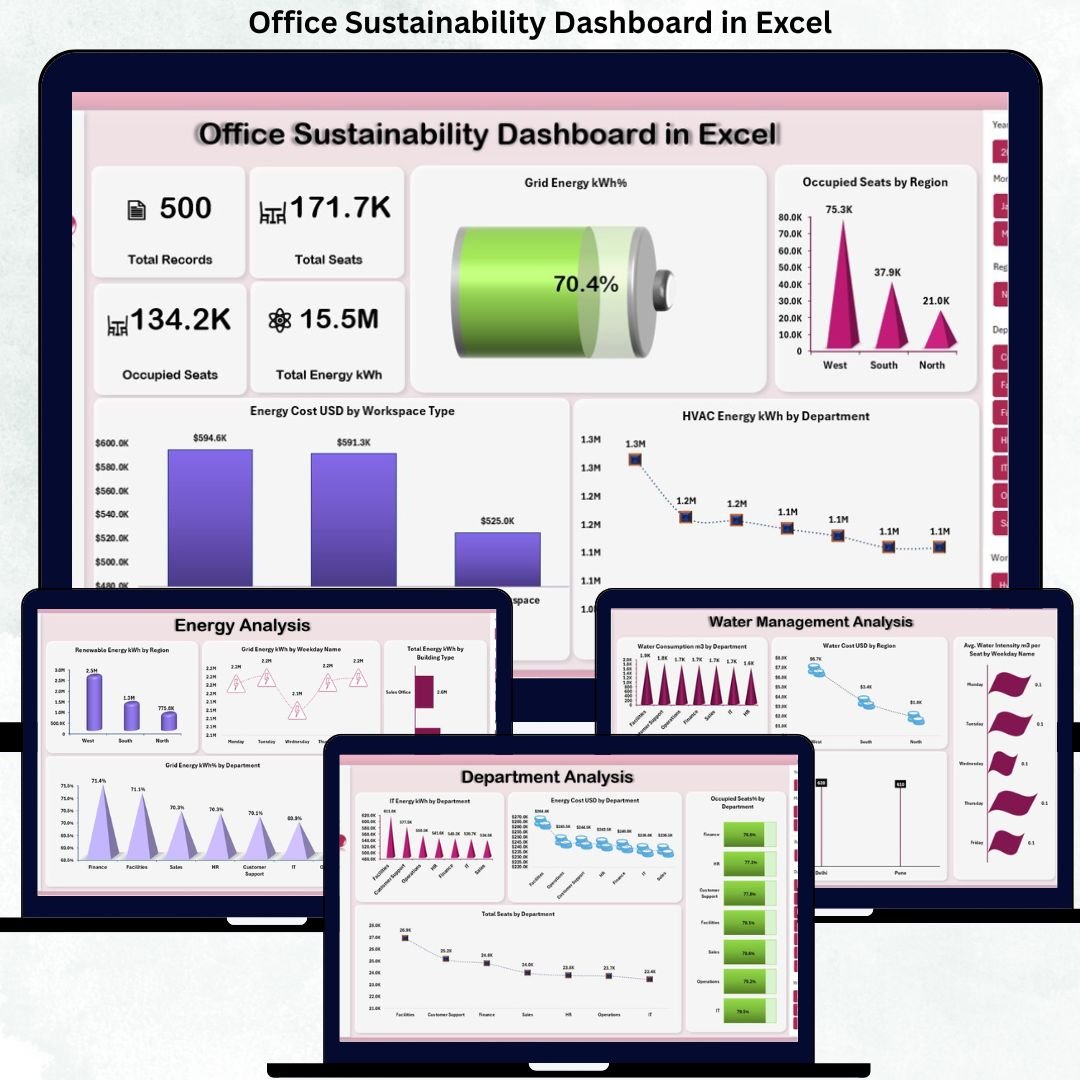

Sustainability is no longer a buzzword—it is a business necessity. Organizations today must track energy usage, water consumption, emissions, and workspace efficiency accurately. However, managing sustainability data across multiple spreadsheets often leads to confusion, errors, and missed opportunities. That is exactly why the Office Sustainability Dashboard in Excel is a must-have solution for modern workplaces.
This ready-to-use Excel dashboard converts complex sustainability data into clear, visual, and actionable insights. Instead of spending hours preparing reports, you get instant visibility into energy usage, water management, waste generation, seat utilization, and ESG performance—all in one structured Excel file. Most importantly, this dashboard is designed for simplicity, so even non-technical users can use it confidently.
Whether your goal is ESG compliance, cost optimization, or building a greener workplace, this dashboard helps you make smarter, data-driven sustainability decisions faster.
🔑 Key Features of Office Sustainability Dashboard in Excel
⚡ Centralized Sustainability Tracking – Monitor energy, water, waste, emissions, and seat utilization from a single Excel dashboard
📊 Multi-Level Analysis – Analyze performance by department, region, building type, workspace type, and city
🌍 ESG & Emissions Visibility – Track business travel emissions, commuting emissions, total GHG emissions, and energy intensity
🏢 Workspace Optimization Insights – Identify underutilized seats and inefficient space usage
💰 Cost-Focused Analysis – Monitor energy and water costs to support budget control
🎛 Interactive Charts & KPIs – Use Excel-based visuals for quick and easy decision-making
🔄 Auto-Refresh with Data Updates – Update raw data and see instant dashboard changes
🧩 Fully Customizable – Add new metrics, departments, or locations without technical complexity
📦 What’s Inside the Office Sustainability Dashboard in Excel
This digital product includes a professionally structured Excel dashboard with multiple analysis sheets:
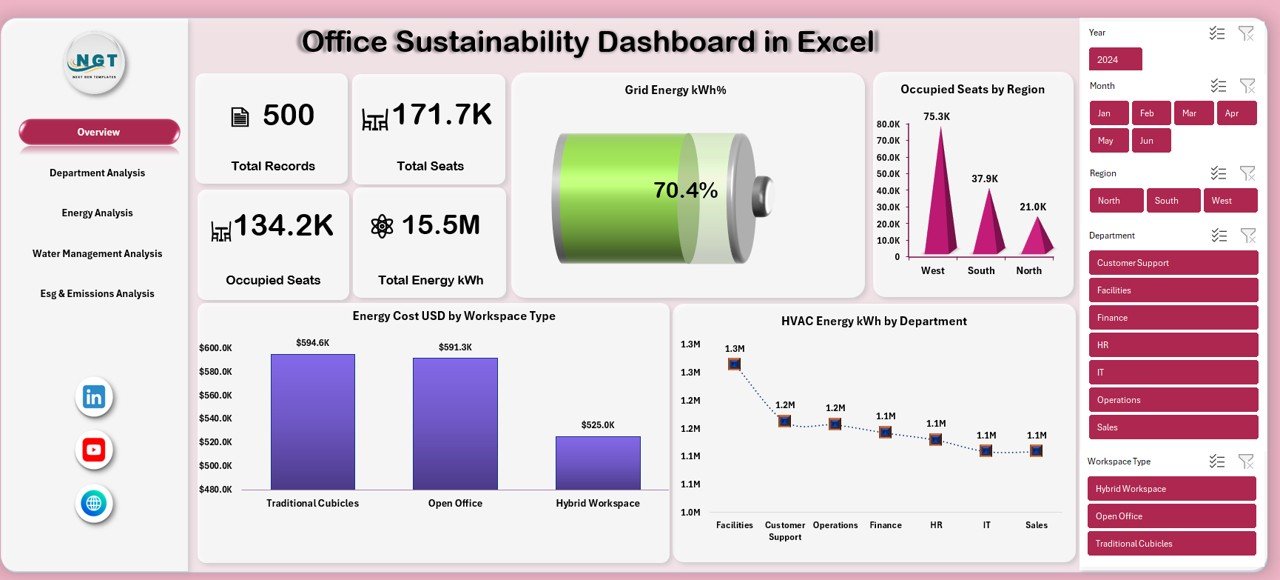
📌 Overview Sheet – High-level snapshot of total records, seats, occupied seats, total energy, grid energy %, and key sustainability charts
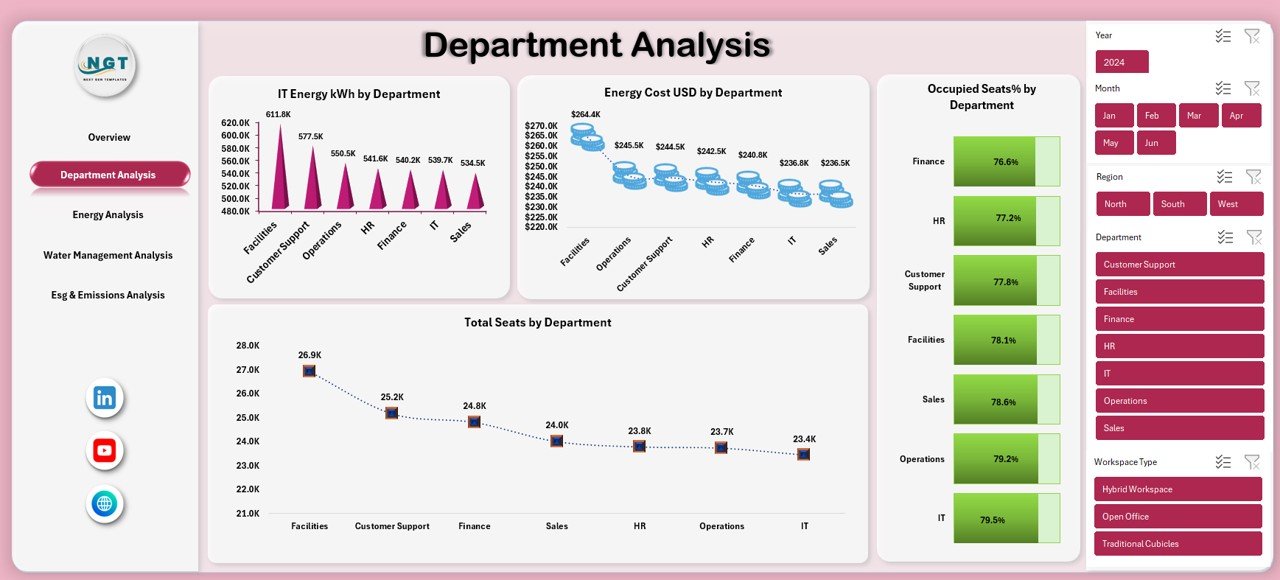
📌 Department Analysis Sheet – Compare energy usage, energy cost, seat allocation, and occupancy % by department
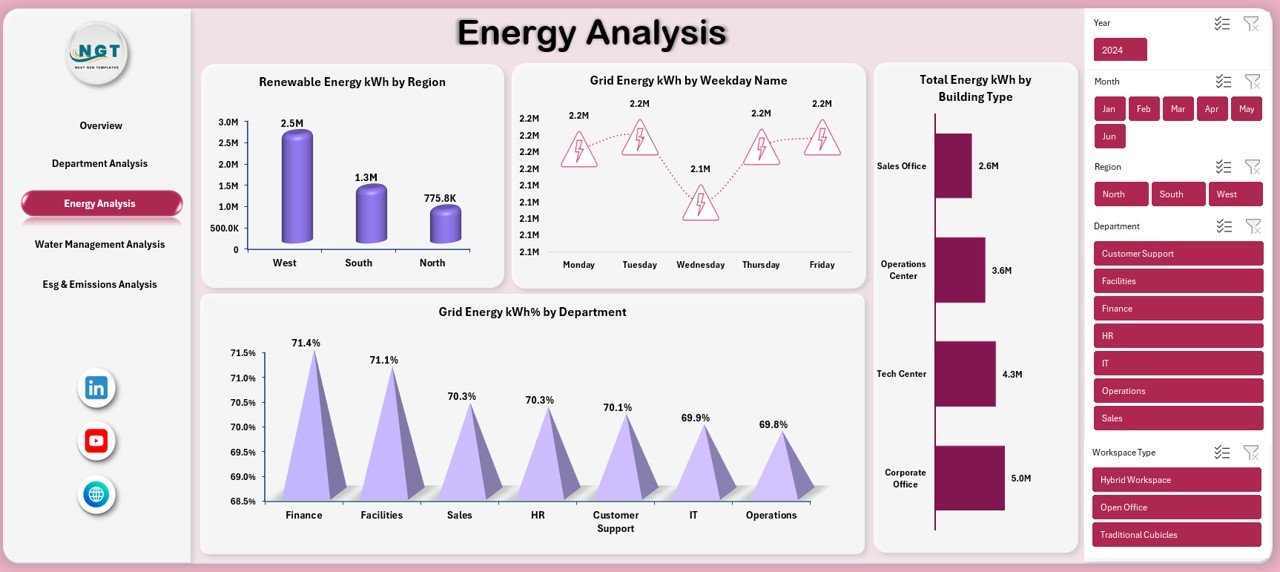
📌 Energy Analysis Sheet – Track renewable energy, grid energy trends, energy usage by weekday, and building type
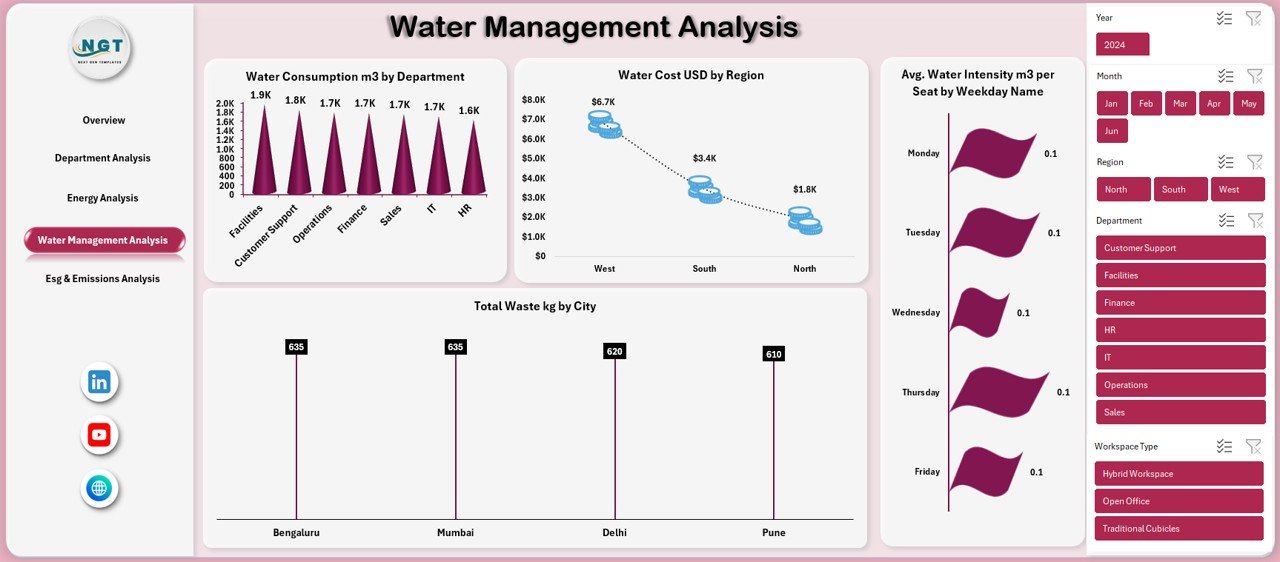
📌 Water Management Analysis Sheet – Monitor water consumption, water costs, and waste generation by location
📌 ESG & Emissions Analysis Sheet – Analyze business travel emissions, commuting emissions, total GHG emissions, and energy intensity
Each sheet is designed to answer real sustainability questions quickly and visually.
🛠️ How to Use the Office Sustainability Dashboard in Excel
Using this dashboard is simple and efficient:
1️⃣ Enter or paste your sustainability data into the structured Excel tables
2️⃣ Refresh pivot tables (if required)
3️⃣ Use slicers and filters to analyze data by department, region, or time period
4️⃣ Review KPIs and charts to identify inefficiencies and improvement areas
5️⃣ Use insights for ESG reporting, cost reduction, and sustainability planning
No advanced Excel skills, macros, or external tools are required.
🎯 Who Can Benefit from This Office Sustainability Dashboard in Excel
This dashboard is ideal for:
🏢 Facility & Workplace Managers
🌱 Sustainability & ESG Teams
📊 Operations & Performance Managers
💼 Finance & Cost Control Teams
🏗 Corporate Real Estate & Space Planners
👔 Senior Management & Leadership Teams
If your organization tracks sustainability metrics, this dashboard will add immediate value.
Click here to read the Detailed Blog Post
Watch the step-by-step video tutorial:


Reviews
There are no reviews yet.