Struggling to track office issues across emails, spreadsheets, and disconnected systems? You’re not alone. Many organizations face delays, missed escalations, and poor visibility when managing workplace issues manually.
👉 What if you could track, analyze, and resolve every issue in one powerful dashboard?
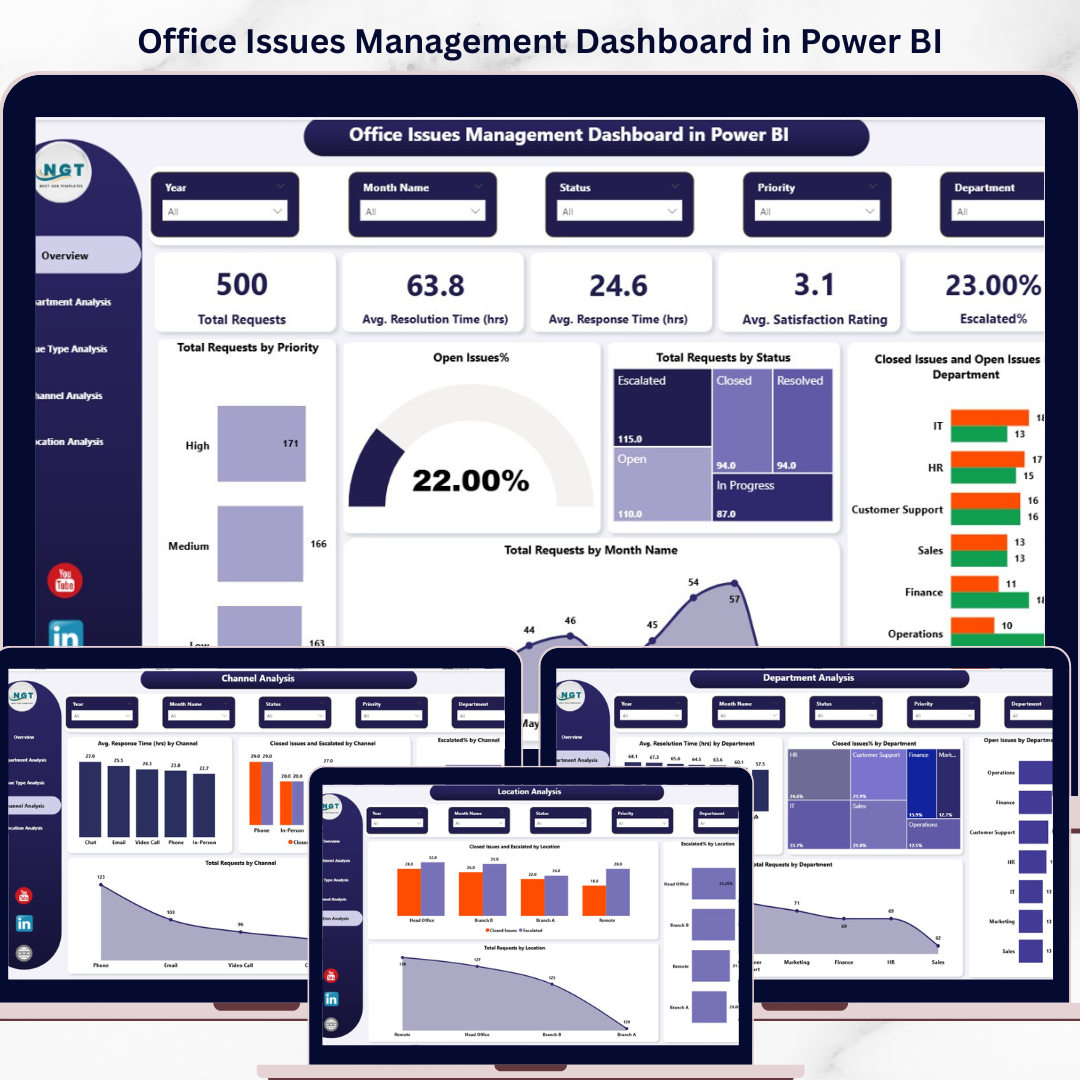
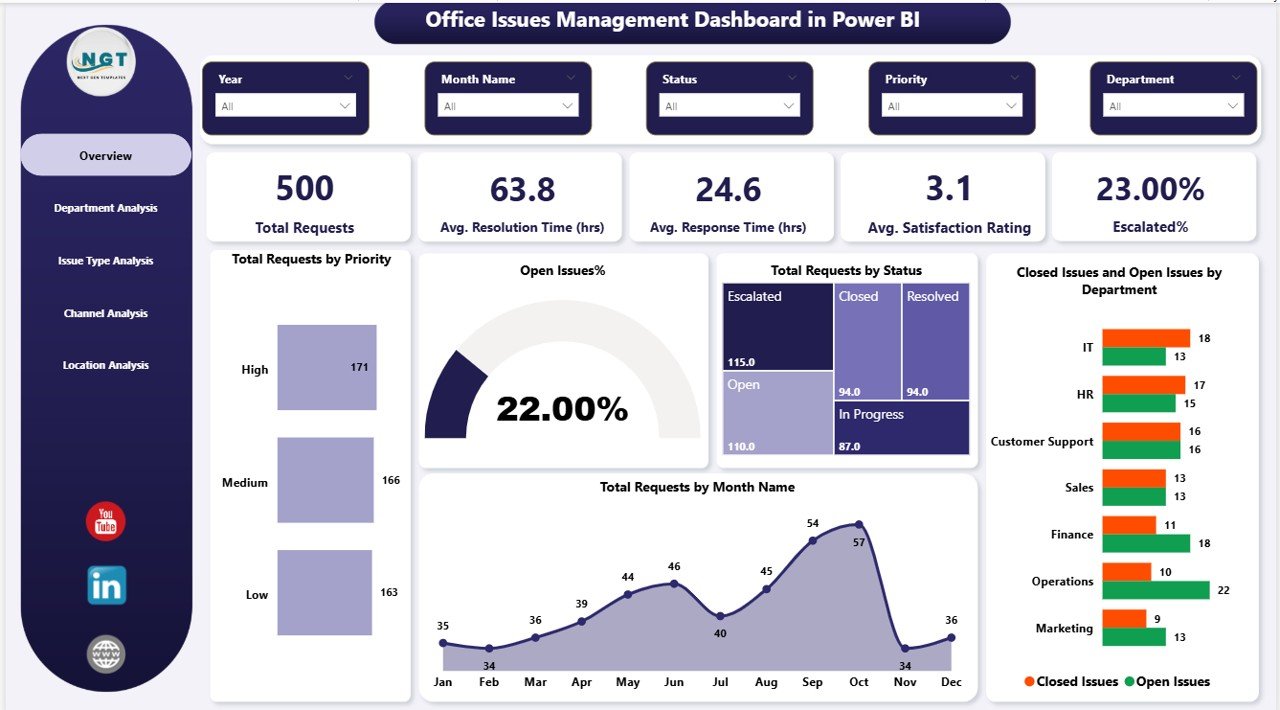
Introducing the Office Issues Management Dashboard in Power BI — your all-in-one solution to monitor internal issues, improve response times, and boost workplace productivity.
This interactive dashboard transforms complex issue data into clear, actionable insights. As a result, managers can make faster decisions, reduce bottlenecks, and improve employee satisfaction effortlessly.
📊 Key Features of Office Issues Management Dashboard in Power BI
✨ 5 Fully Interactive Dashboard Pages – Analyze issues from multiple angles with structured insights
📌 Powerful KPI Cards – Track total requests, response time, resolution time, satisfaction rating, and escalation %
📈 Real-Time Monitoring – Stay updated with live data and performance trends
🏢 Department Analysis – Identify high-performing and underperforming departments
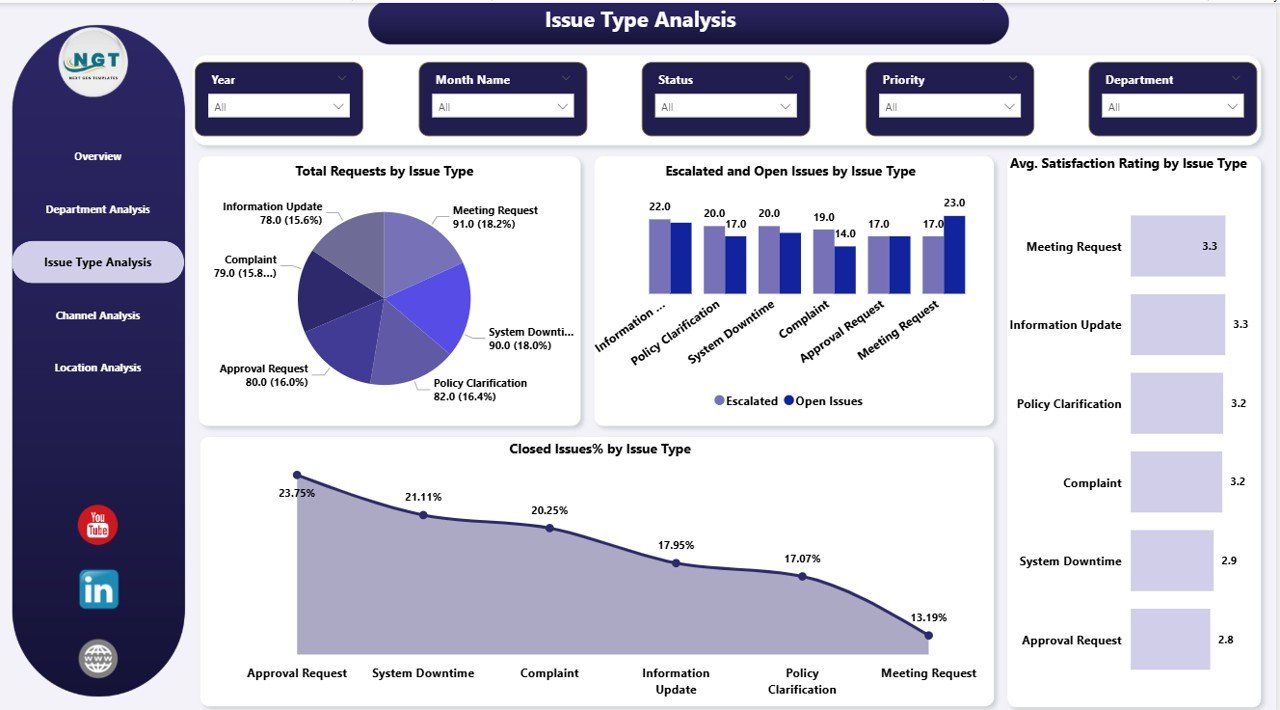
🧩 Issue Type Insights – Understand which issues cause the most delays or escalations
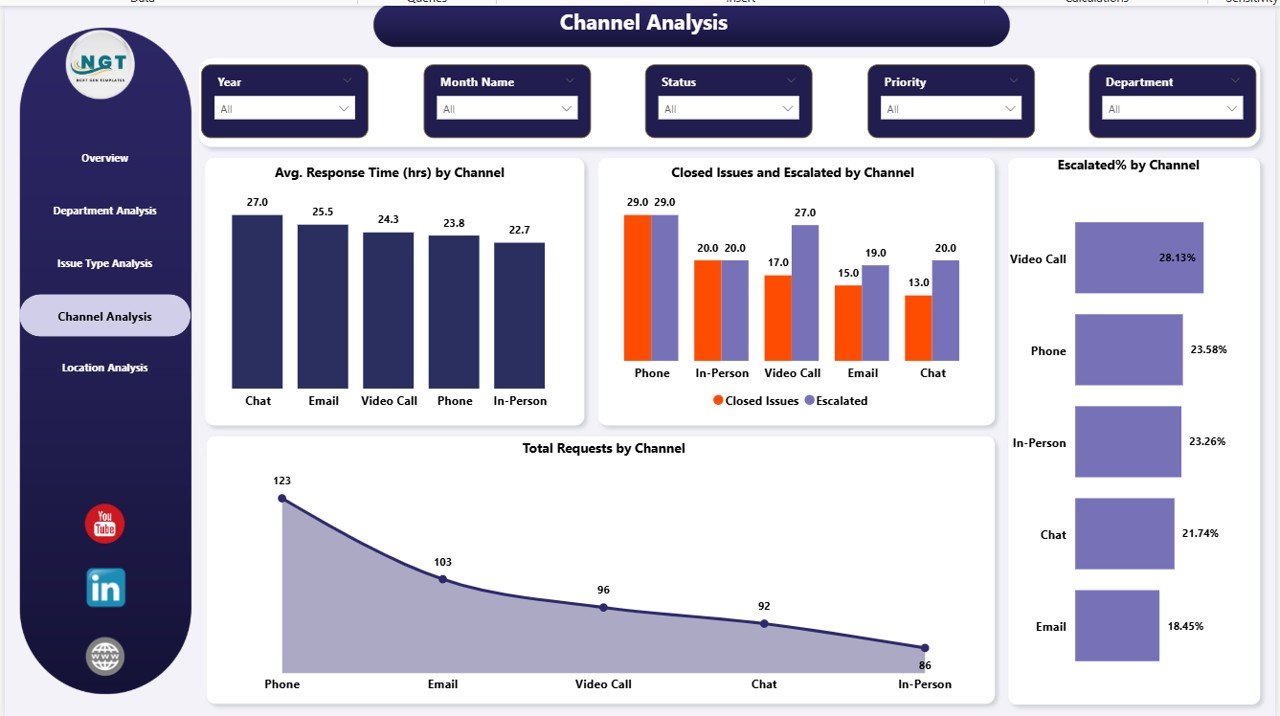
📞 Channel Performance Tracking – Evaluate email, phone, or ticket-based issue handling
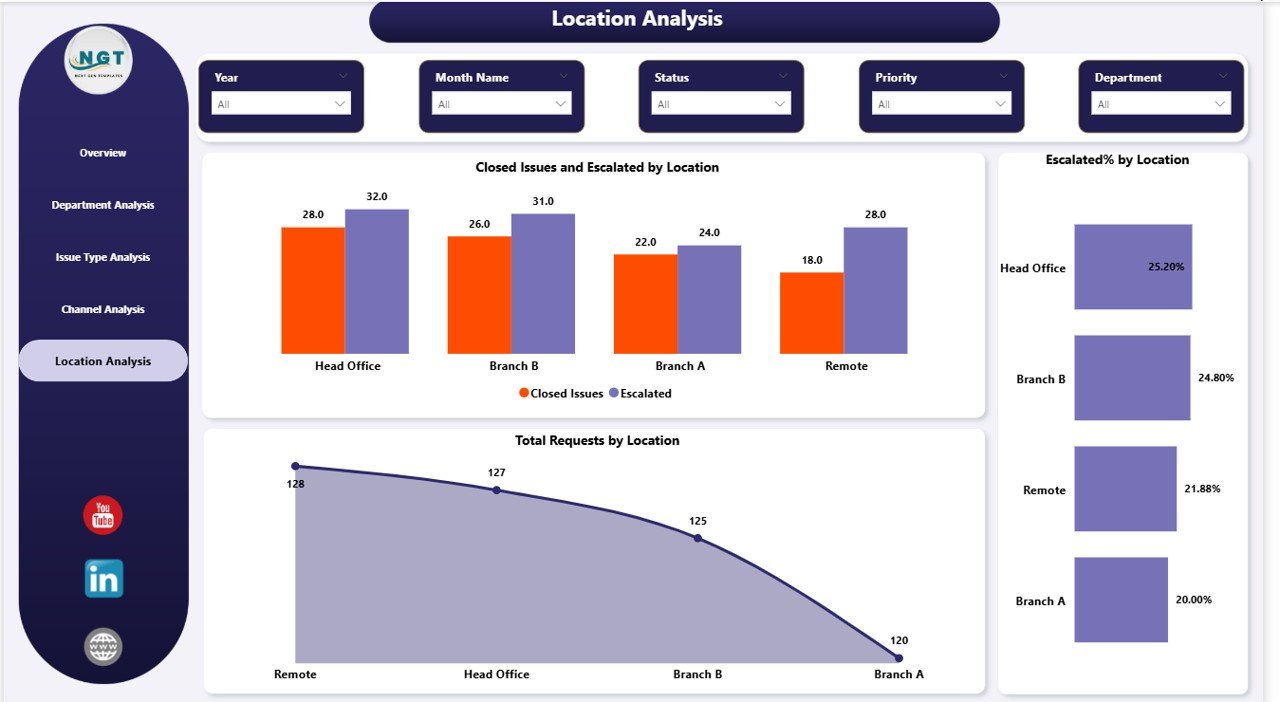
🌍 Location-Based Analysis – Monitor performance across multiple office locations
🎯 Advanced Filters & Slicers – Drill down into data for deeper insights
📦 What’s Inside the Office Issues Management Dashboard in Power BI
This ready-to-use dashboard includes 5 powerful pages designed for complete issue management:
📍 Overview Page
Get a quick snapshot with KPI cards and charts like total requests, open issues %, and monthly trends.
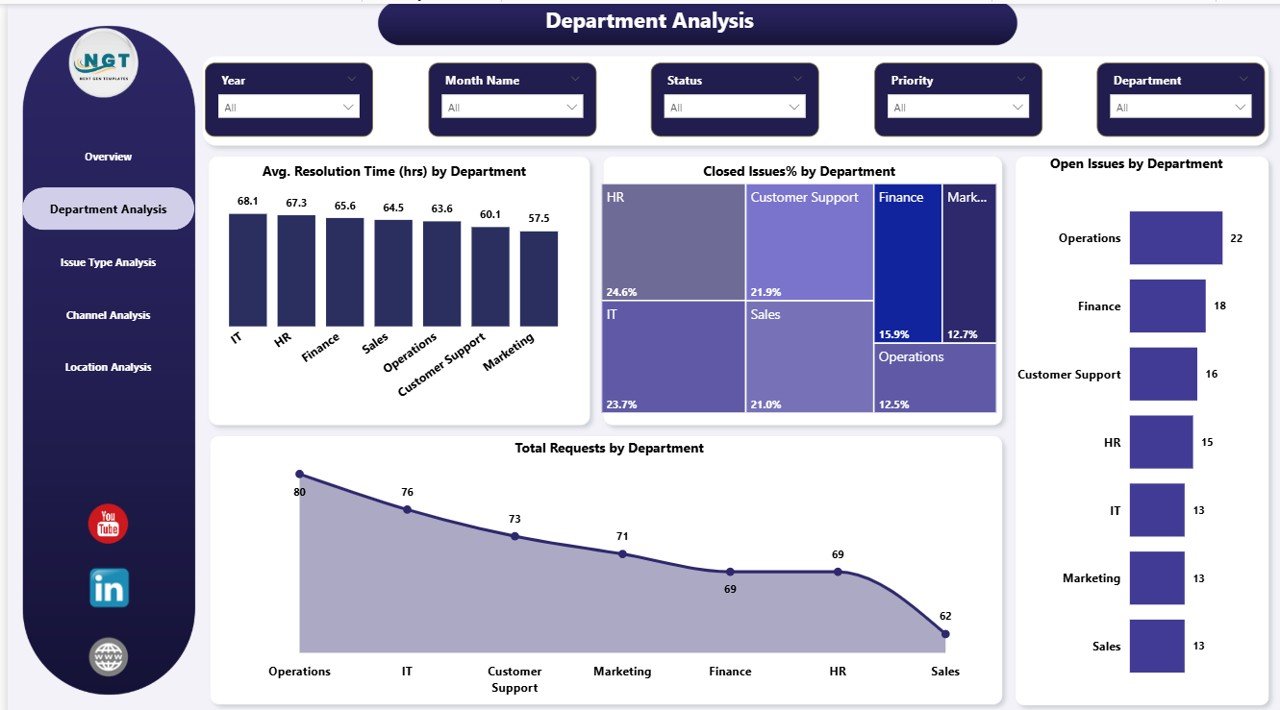
📍 Department Analysis Page
Analyze resolution time, issue volume, and performance by department.
📍 Issue Type Analysis Page
Understand trends by issue categories and identify critical problem areas.
📍 Channel Analysis Page
Evaluate which communication channels are most efficient.
📍 Location Analysis Page
Track issue handling performance across different locations.
Each page is designed to provide clear, actionable insights for smarter decision-making.
⚙️ How to Use the Office Issues Management Dashboard in Power BI
Using this dashboard is simple—even for beginners:
🔹 Import your issue dataset into Power BI
🔹 Connect and refresh your data
🔹 Use slicers to filter by department, location, or issue type
🔹 Monitor KPI cards and charts
🔹 Identify delays, bottlenecks, and escalation patterns
🔹 Take data-driven actions to improve performance
👉 Within minutes, you’ll gain complete control over your issue management process.
👥 Who Can Benefit from This Office Issues Management Dashboard?
This dashboard is perfect for:
👨💼 Office Administrators – Manage daily operations efficiently
👩💼 HR Managers – Track employee concerns and satisfaction
💻 IT Support Teams – Monitor technical issue resolution
🏭 Operations Managers – Improve workflow efficiency
🏢 Facility Management Teams – Handle maintenance and service issues
👉 Whether you’re a small business or a large organization, this dashboard helps you stay in control.
💡 Why This Dashboard is a Game-Changer
✔ Reduce issue resolution time
✔ Improve accountability across departments
✔ Minimize escalations and delays
✔ Centralize all issue data in one place
✔ Make faster, data-driven decisions
👉 Stop guessing. Start managing issues with clarity and confidence.
Click here to read the Detailed blog post
Watch the step-by-step video tutorial:


