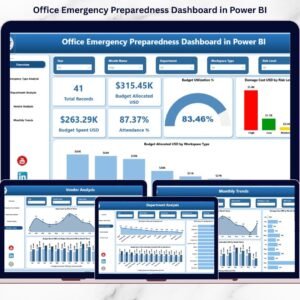
Emergencies don’t knock before entering. A fire drill missed, a low attendance rate, an unmonitored vendor, or uncontrolled damage cost can expose serious risks. Yet many organizations still rely on scattered spreadsheets to manage safety dataNow imagine having complete visibility over emergency drills, budgets, participation, vendor performance, and risk levels — all in one powerful, interactive system.That’s exactly what the Office Emergency Preparedness Dashboard in Power BI delivers.This ready-to-use Power BI solution transforms raw emergency data into clear, actionable insights. Instead of manually reviewing reports, you can instantly filter by department, emergency type, vendor, risk level, or month — and make faster, smarter safety decisions.
If you want better compliance, stronger readiness, and total budget control, this dashboard is your ultimate preparedness command center.
🔥 Key Features of Office Emergency Preparedness Dashboard in Power BI
-
🚨 5 Fully Interactive Dashboard Pages for complete preparedness tracking
-
📊 Real-Time KPI Cards showing attendance, budget utilization, and spend
-
🎯 Department-Wise Readiness Analysis to identify weak participation
-
💰 Budget Allocated vs Spent Tracking with utilization percentage
-
🛡️ Risk-Level Damage Analysis to highlight high-impact events
-
🤝 Vendor Performance Comparison using risk score and attendance metrics
-
📈 Monthly Trend Insights to track improvement over time
-
🔍 Advanced Power BI Slicers for dynamic filtering
Every page is designed to help leadership move from confusion to clarity within seconds.
📦 What’s Inside the Office Emergency Preparedness Dashboard in Power BI
This dashboard includes 5 professionally designed pages:
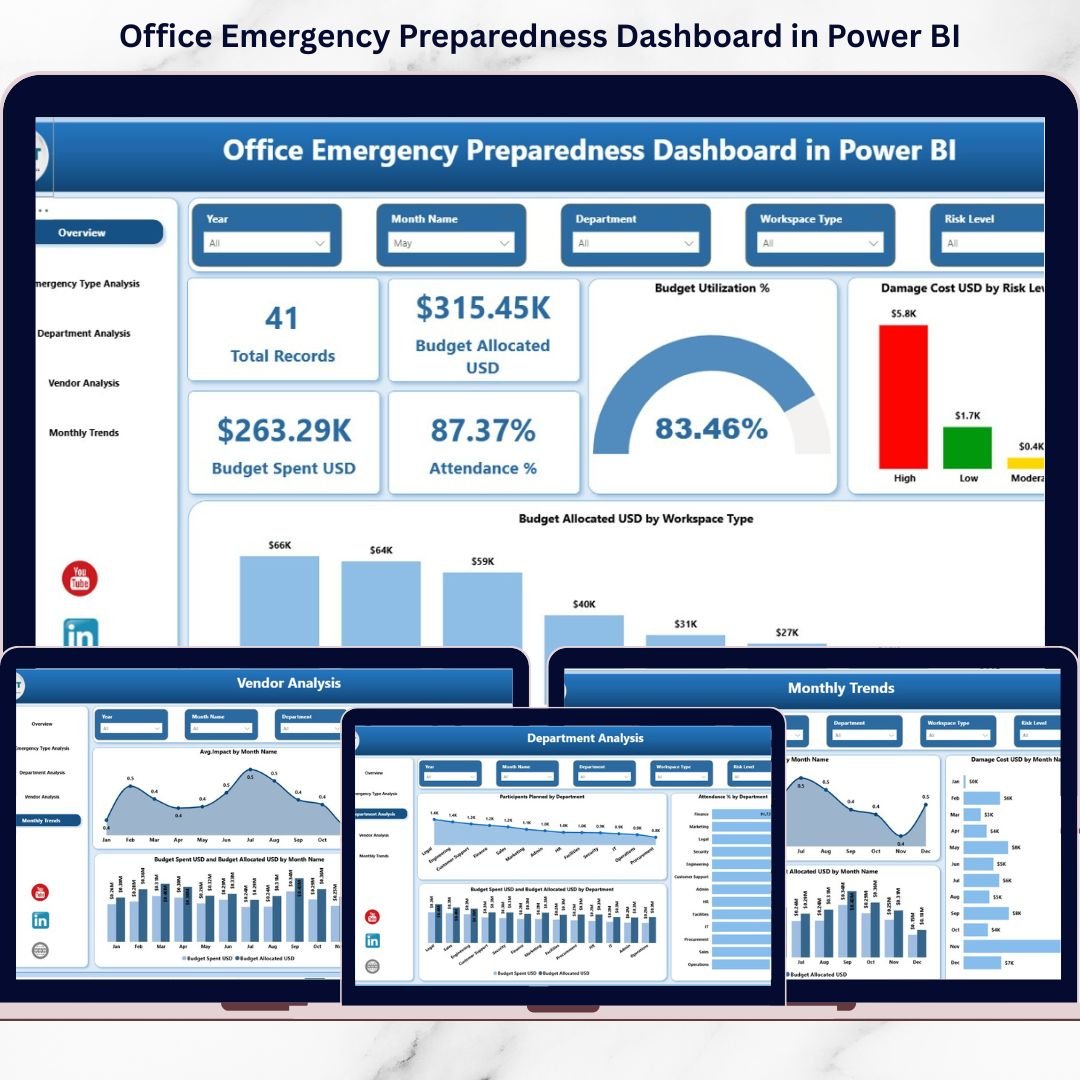
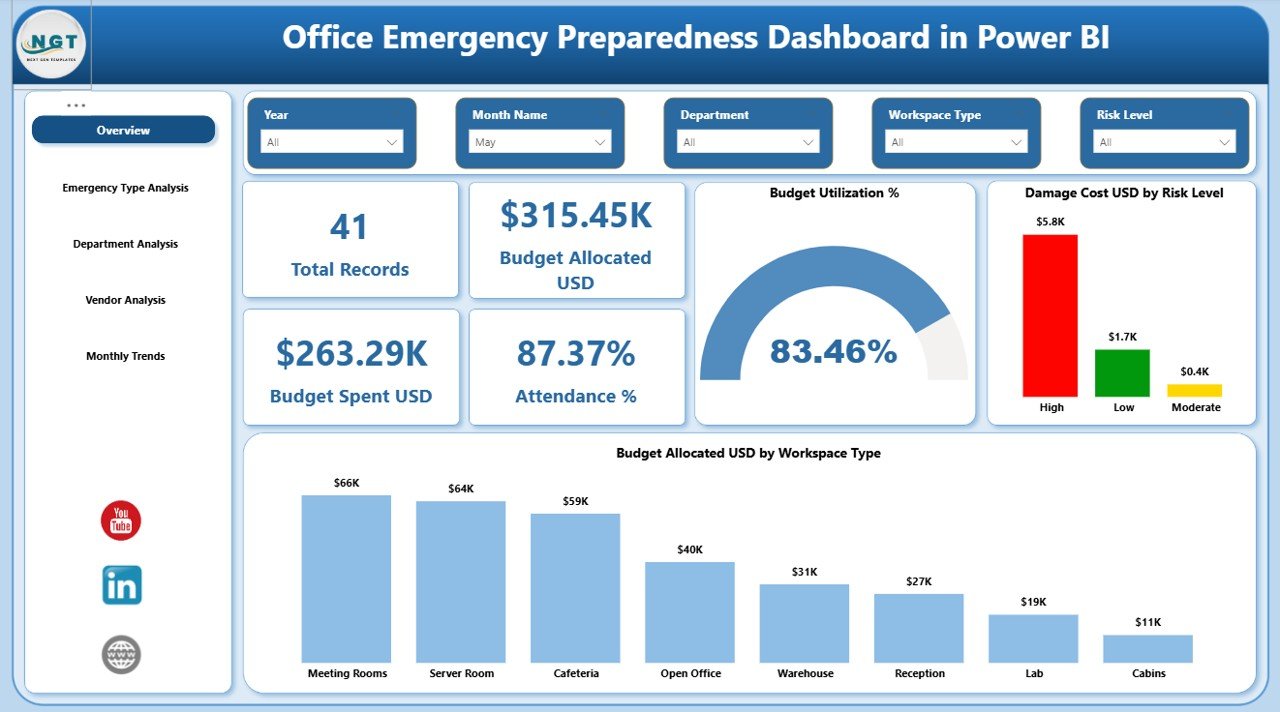
1️⃣ Overview Page
Your central control room showing:
-
Total Records
-
Budget Allocated (USD)
-
Total Spend (USD)
-
Attendance %
-
Budget Utilization %
-
Damage Cost by Risk Level
-
Budget Allocation by Workspace Type
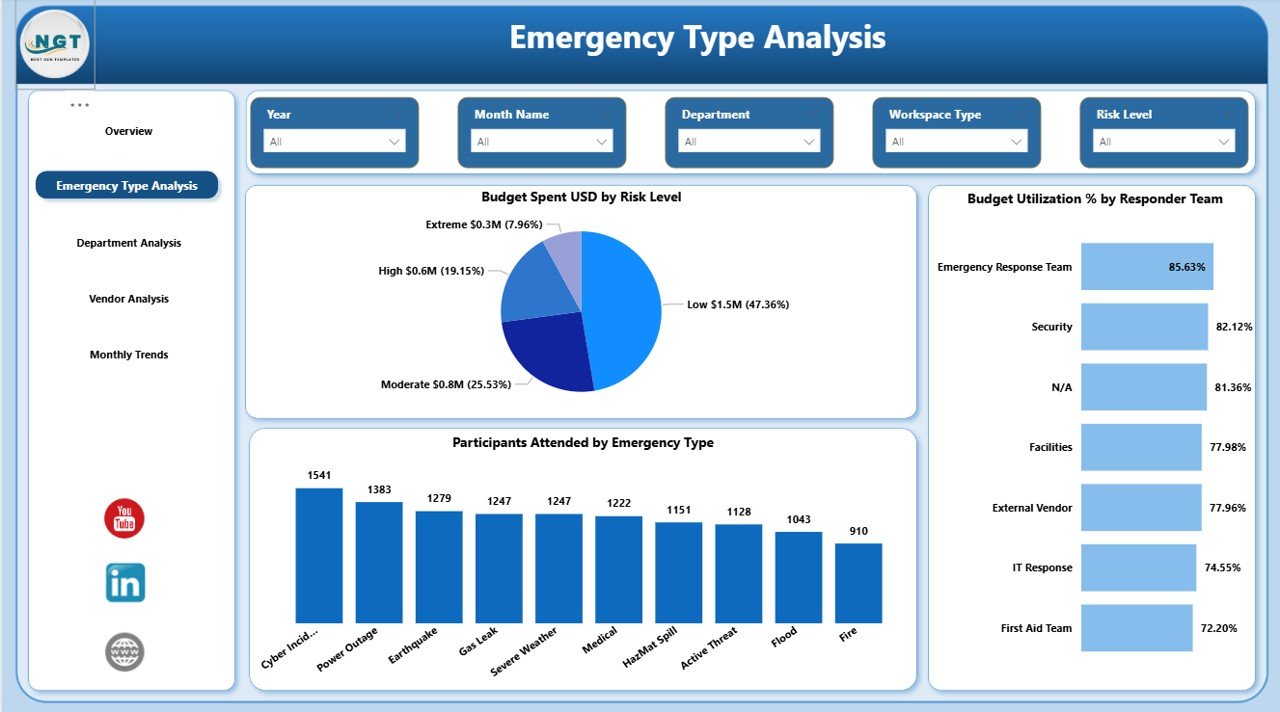
2️⃣ Emergency Type Analysis
Analyze performance of fire drills, medical emergencies, evacuation drills, and more.
Track attendance, responder levels, and budget patterns.
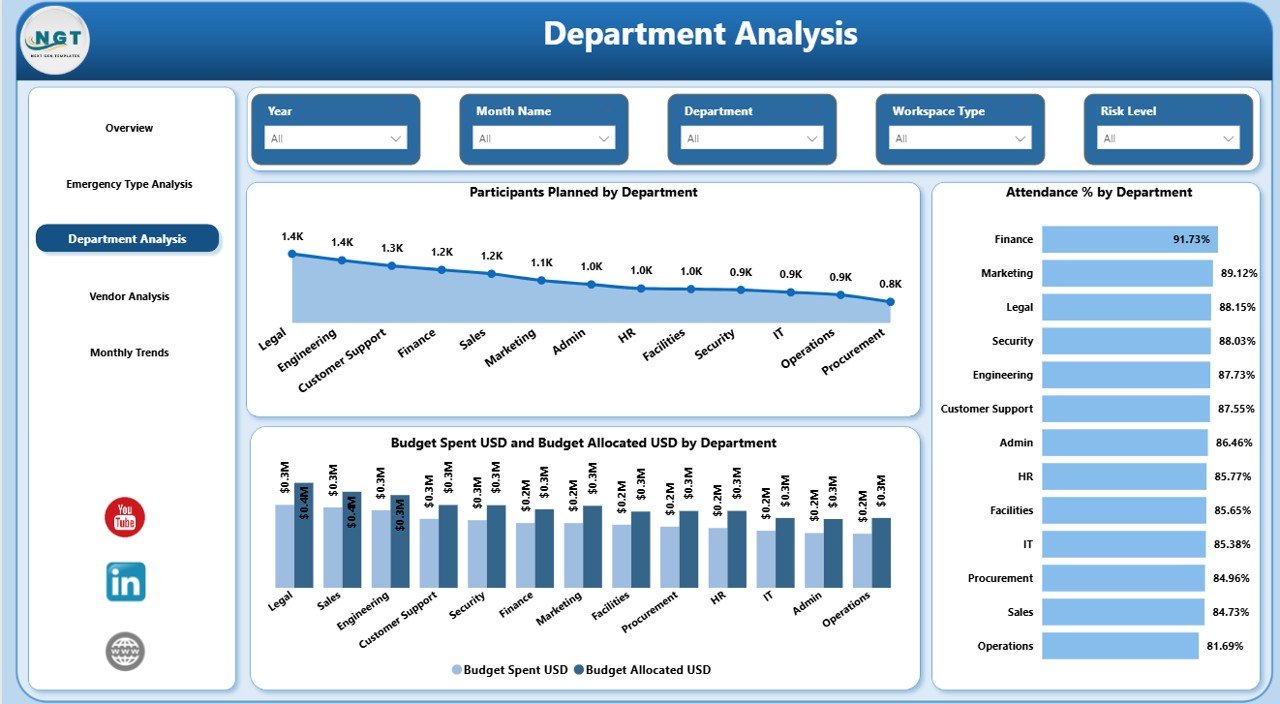
3️⃣ Department Analysis
Identify which departments show strong participation and which require improvement.
Compare planned vs actual participants and budget variance.
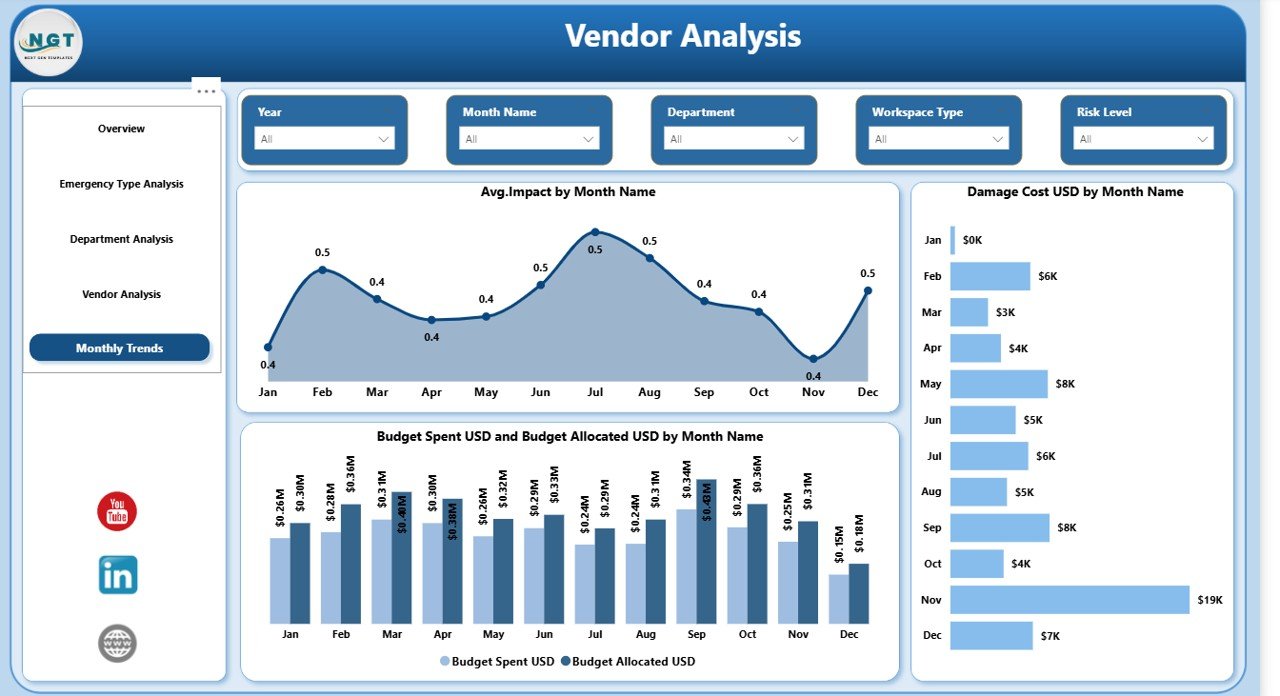
4️⃣ Vendor Analysis
Evaluate training vendors and emergency service providers using:
-
Participation metrics
-
Average risk score
-
Performance comparison
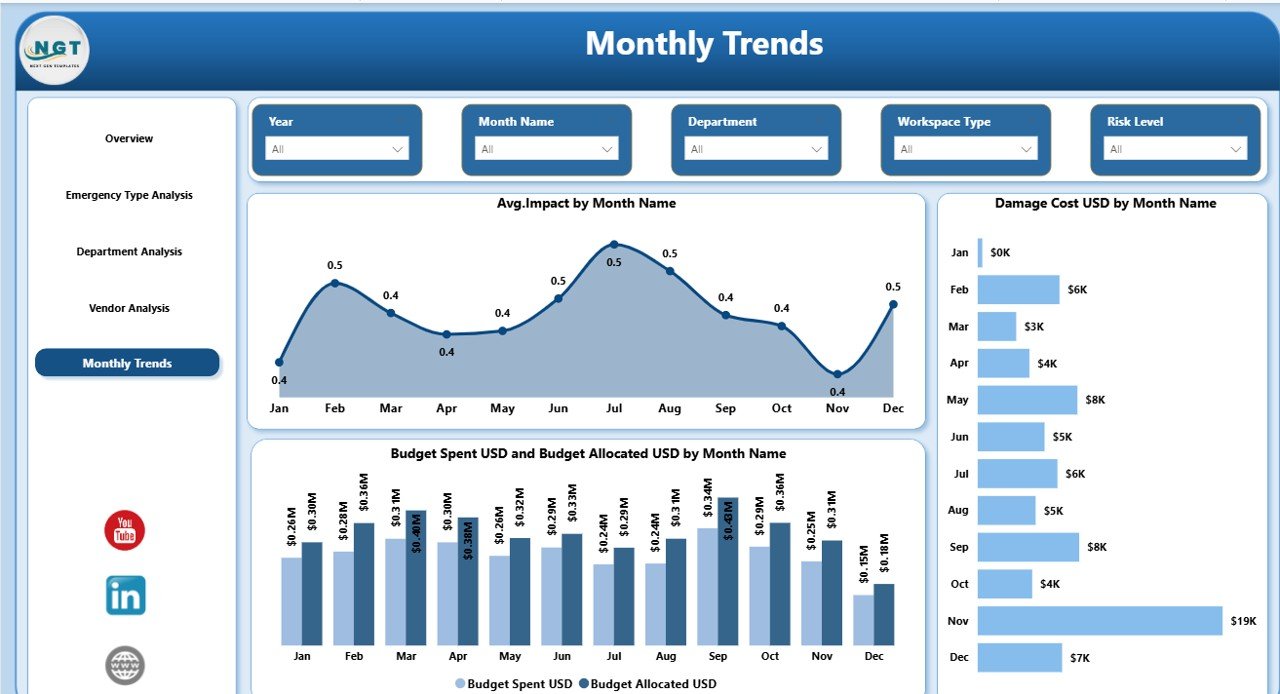
5️⃣ Monthly Trends Page
Monitor damage costs, budget variance, and emergency impact progression month by month.
Everything is structured for decision-making — not just reporting.
How to Use the Office Emergency Preparedness Dashboard in Power BI
Using the dashboard is simple:
1️⃣ Import your emergency preparedness dataset into Power BI.
2️⃣ Connect the data model.
3️⃣ Use slicers to filter by month, department, emergency type, vendor, or risk level.
4️⃣ Review KPI cards and visual insights instantly.
5️⃣ Identify weak areas and take corrective actions.
Within minutes, you gain complete control over your organization’s preparedness performance.
Who Can Benefit from This Office Emergency Preparedness Dashboard?
This solution is ideal for:
-
🏢 Corporate Offices
-
🏭 Manufacturing Units
-
🏥 Healthcare Facilities
-
🎓 Educational Institutions
-
🏢 IT & Tech Companies
-
🏛️ Government Agencies
-
🏬 Co-Working Spaces
If your organization conducts drills, allocates safety budgets, or works with emergency vendors — this dashboard is built for you.
Why This Dashboard Is a Game-Changer
✔️ Improves emergency readiness visibility
✔️ Prevents budget overspending
✔️ Strengthens audit and compliance reporting
✔️ Identifies high-risk departments instantly
✔️ Enhances vendor accountability
✔️ Supports data-driven safety decisions
Instead of reacting to emergencies, you start preparing proactively.
Emergency preparedness is not optional. It is essential. And this dashboard turns preparedness into a measurable, controllable strategy.
Click here to read the Detailed blog post
Watch the step-by-step video tutorial: