Managing a nursing home is not just about care—it’s about maintaining quality, efficiency, and compliance every single day. However, tracking multiple KPIs across departments can quickly become complex and time-consuming.
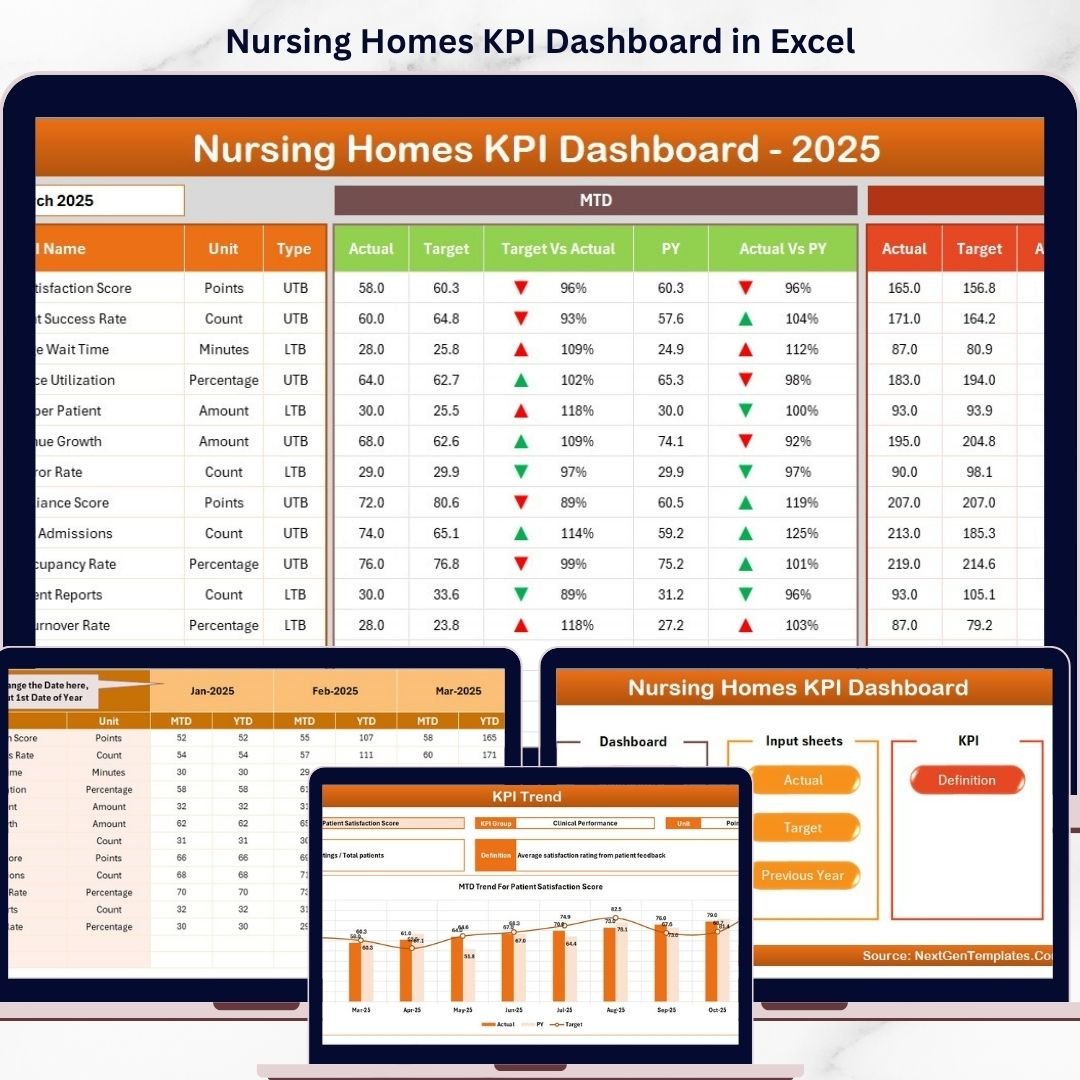
Introducing the Nursing Homes KPI Dashboard in Excel – a smart, ready-to-use solution designed to help healthcare administrators track, analyze, and improve operational performance with ease.
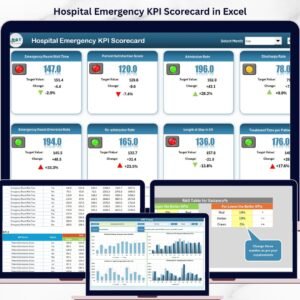
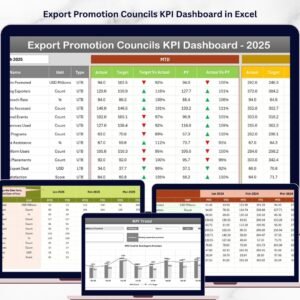
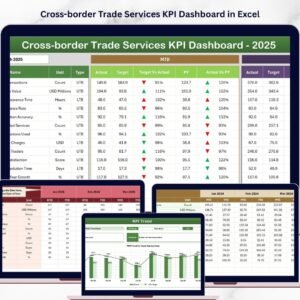
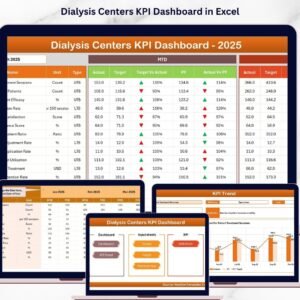
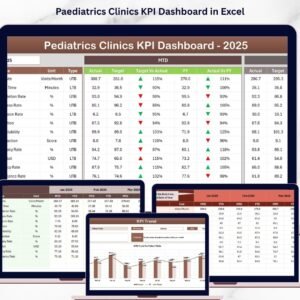
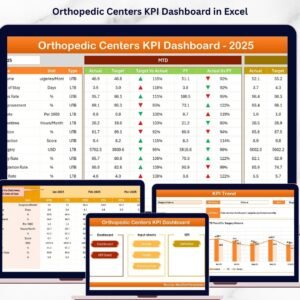
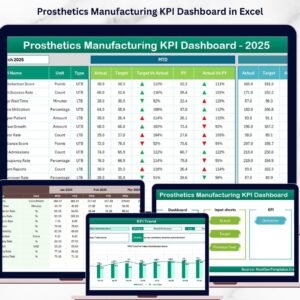
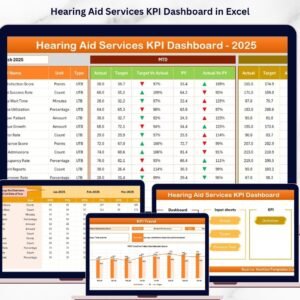
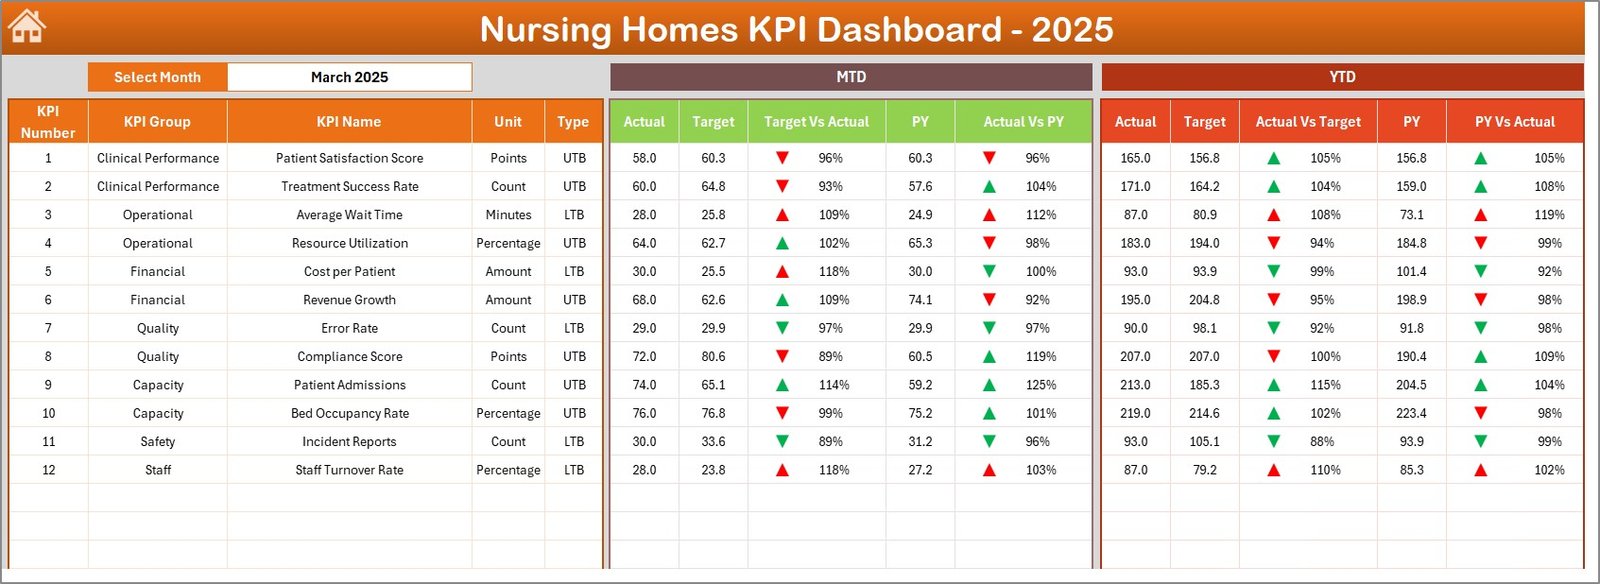
This dynamic Excel dashboard transforms raw data into meaningful insights using interactive visuals, KPI comparisons, and trend analysis. Moreover, it allows you to monitor Month-to-Date (MTD) and Year-to-Date (YTD) performance, compare actual vs target vs previous year, and quickly identify areas that need attention.
Whether you are managing patient care quality, operational efficiency, or compliance metrics, this dashboard ensures you stay informed and in control at all times.
🚀 Key Features of Nursing Homes KPI Dashboard in Excel
📊 Interactive KPI Dashboard – Track performance with real-time updates using month selection
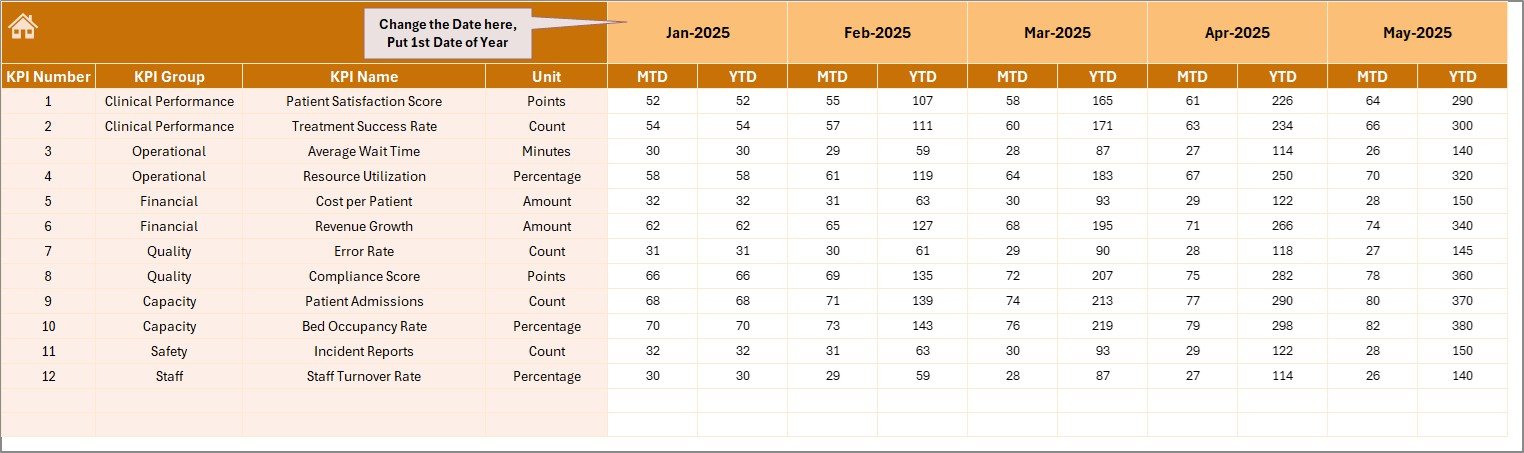
📅 MTD & YTD Analysis – Compare actual, target, and previous year data effortlessly
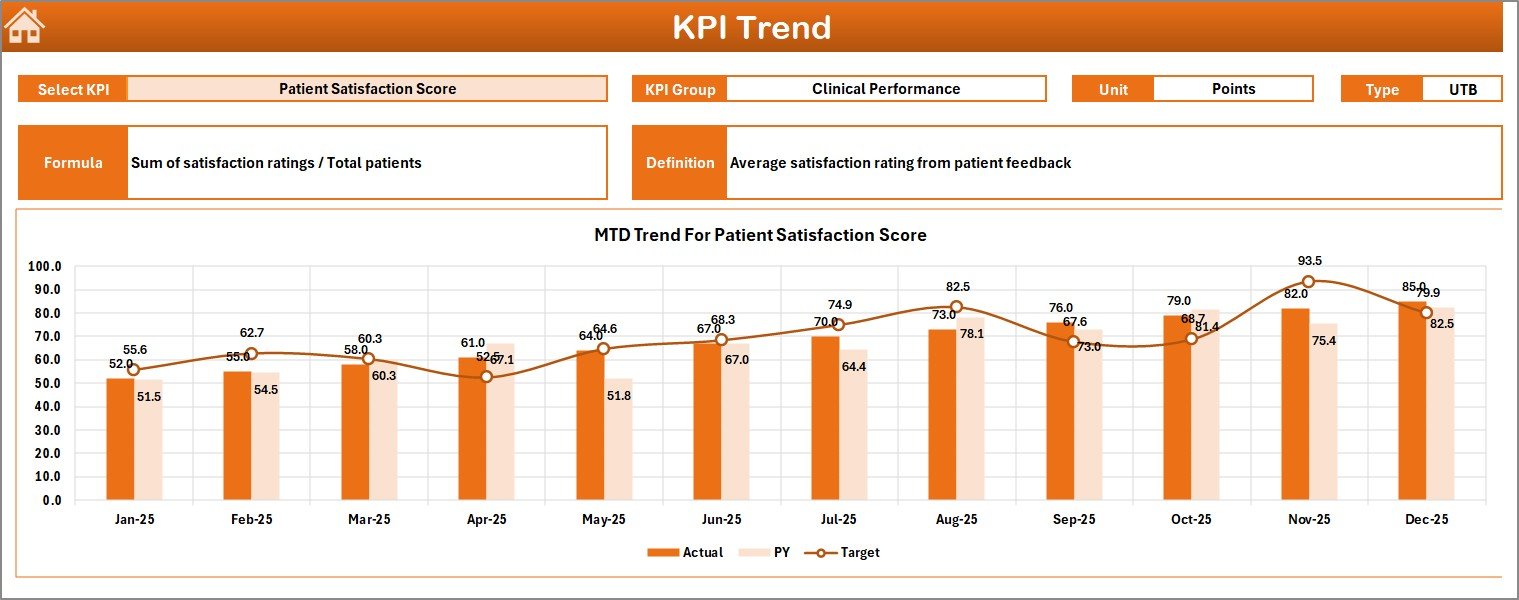
📈 Trend Visualization – Analyze performance using dynamic charts
🔺 Conditional Formatting Indicators – Instantly identify performance gaps with arrows
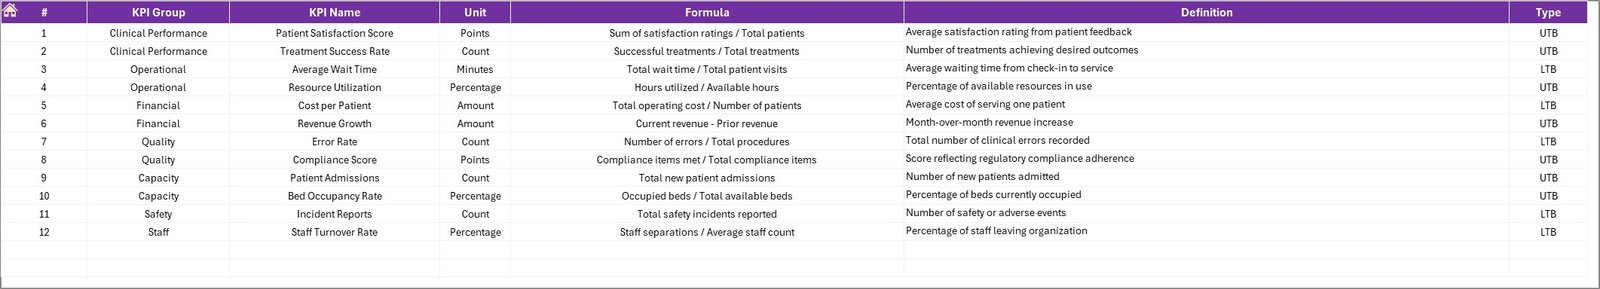
🧾 Detailed KPI Definitions – Understand each KPI with unit, formula, and type
📥 Structured Data Input Sheets – Enter actual, target, and previous year values easily
🧭 User-Friendly Navigation – Access all sheets with clickable buttons
⚙️ Customizable KPI Framework – Modify KPIs based on your nursing home needs
📦 What’s Inside the Nursing Homes KPI Dashboard in Excel
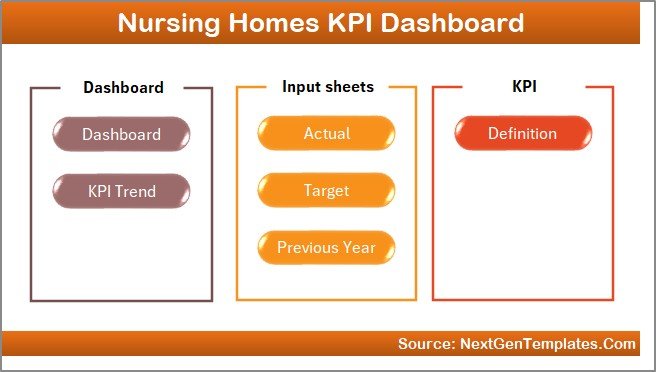
This template includes 7 well-designed worksheets for complete KPI management:
🏠 Home Sheet – Central navigation hub with buttons for easy access
📊 Dashboard Sheet – View all KPIs with MTD and YTD comparisons
📈 KPI Trend Sheet – Deep dive into individual KPI performance and trends
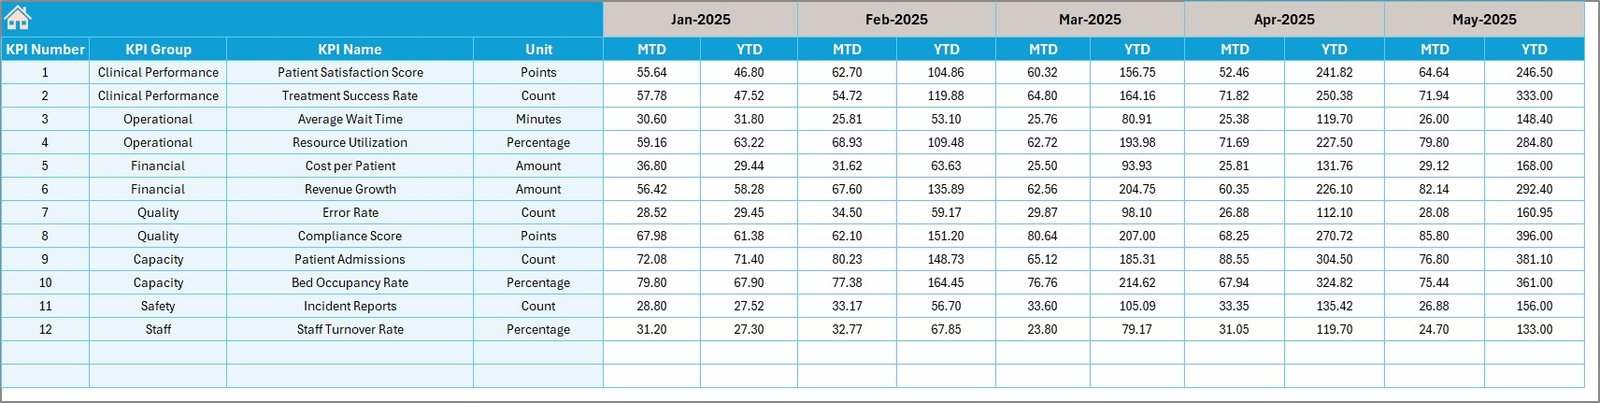
📥 Actual Data Sheet – Input real-time performance data
🎯 Target Data Sheet – Set KPI goals for comparison
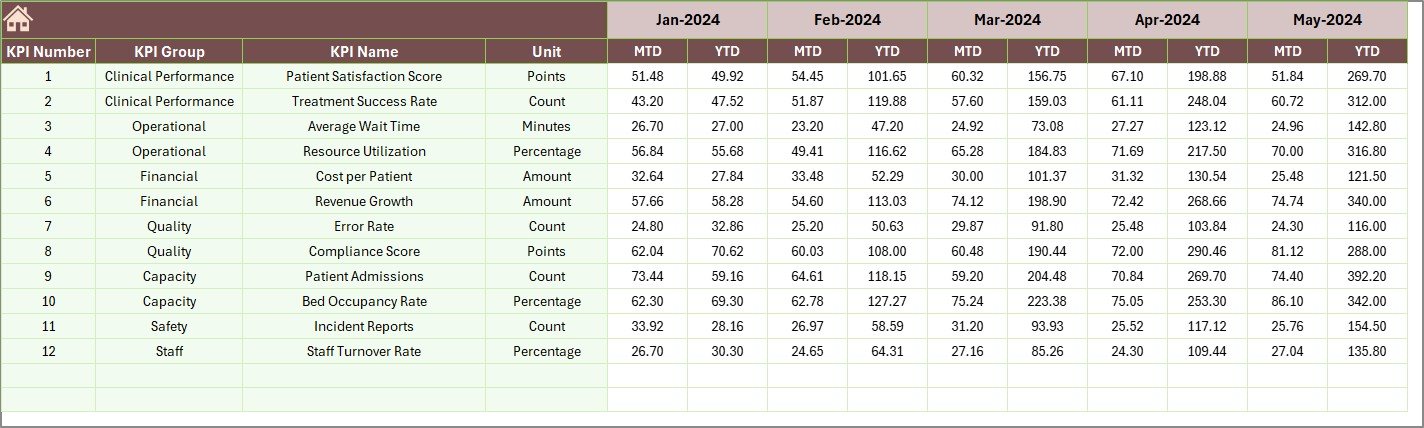
📅 Previous Year Sheet – Track historical performance
📘 KPI Definition Sheet – Maintain KPI details including formulas and types
Additionally, the dashboard includes dropdown selections, automated calculations, and interactive visuals to make analysis quick and effective.
⚙️ How to Use the Nursing Homes KPI Dashboard in Excel
Getting started is simple and efficient:
1️⃣ Enter Data – Input actual, target, and previous year values
2️⃣ Select Month – Choose the desired month from the dropdown
3️⃣ Review Dashboard – Instantly view KPI performance updates
4️⃣ Analyze Trends – Use the KPI Trend sheet for deeper insights
5️⃣ Take Action – Improve performance based on insights
👉 Within minutes, you can turn your nursing home data into actionable decisions.
👥 Who Can Benefit from This Nursing Homes KPI Dashboard in Excel
This dashboard is ideal for healthcare professionals and teams:
🏥 Nursing Home Administrators – Monitor overall performance and compliance
👩⚕️ Healthcare Managers – Track care quality and operational efficiency
📊 Data Analysts – Analyze KPI trends and performance gaps
📋 Quality Assurance Teams – Ensure standards are consistently met
🏢 Healthcare Organizations – Improve reporting and decision-making
👉 In short, anyone responsible for healthcare performance management will benefit from this tool.
With its intuitive layout, powerful analytics, and easy customization, this dashboard helps you improve patient care, optimize operations, and make smarter decisions.
Stop relying on manual reports and scattered data.
👉 Download now and take control of your nursing home performance with confidence! 🚀