Customer loyalty is not just a number — it is the fuel behind revenue growth, brand reputation, and long-term success. Yet many organizations still struggle with scattered spreadsheets, manual calculations, and delayed reporting.
What if you could monitor customer loyalty, response time, case resolution, and follow-up requirements in one powerful interactive system?
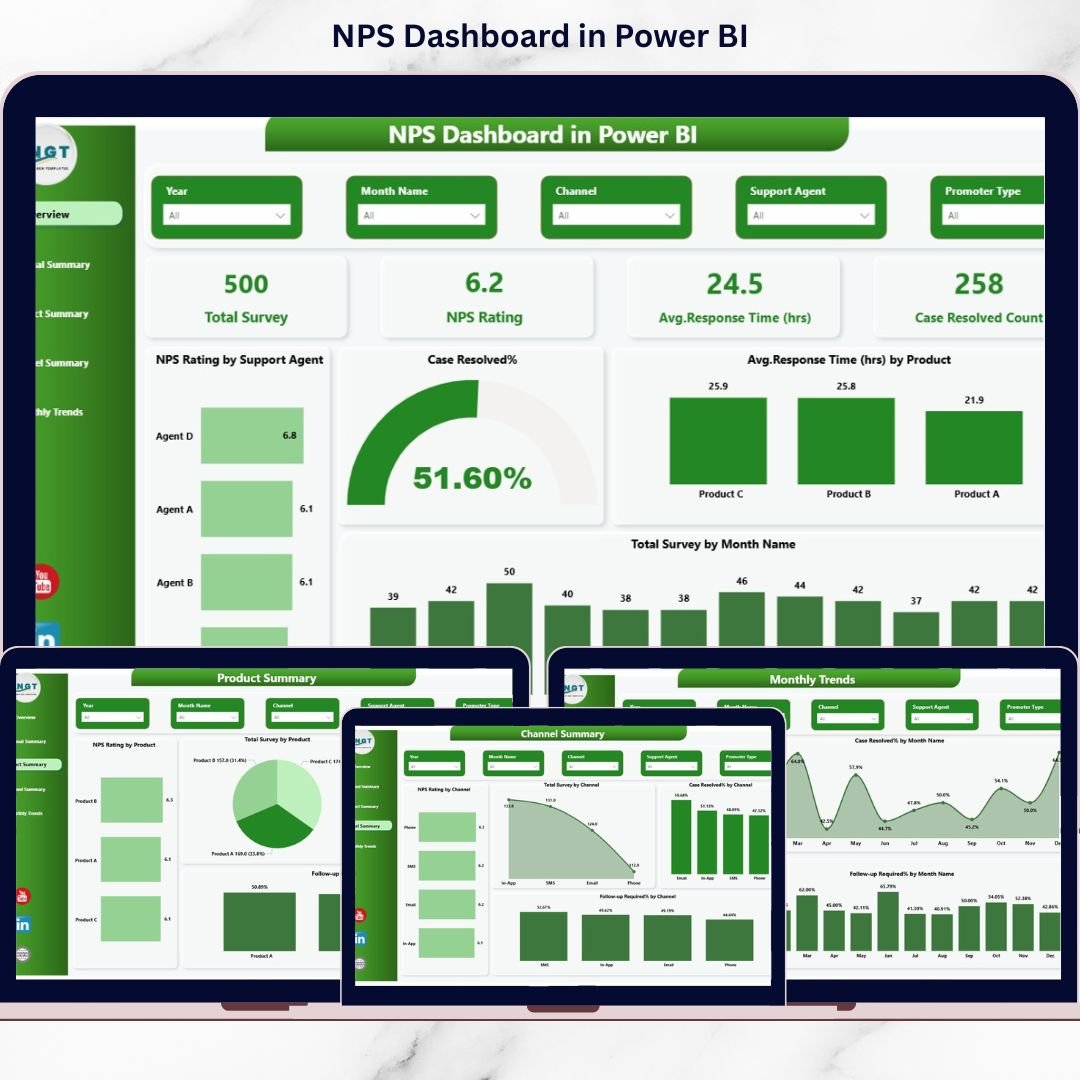
Introducing the NPS Dashboard in Power BI — a ready-to-use, fully interactive business intelligence solution designed to transform raw survey data into actionable insights instantly.
This dashboard automatically calculates Net Promoter Score (NPS), tracks promoters, passives, and detractors, and allows you to filter data by region, product, channel, agent, or month — all in real time. No more manual formulas. No more guessing.
If you want to boost customer retention, improve accountability, and make data-driven decisions faster, this dashboard is your ultimate command center.
🔥 Key Features of NPS Dashboard in Power BI
📊 Automatic NPS Calculation – Instantly calculates NPS using the formula: % Promoters – % Detractors.
📈 5 Fully Interactive Pages – Analyze performance from multiple business angles.
🎯 Dynamic KPI Cards – Monitor Total Surveys, NPS Score, Response Time (Hours), and Case Resolution Count.
🌍 Regional Performance Insights – Compare satisfaction and resolution efficiency by region.
📦 Product-Level Analysis – Identify products driving promoters or detractors.
📞 Channel Performance Monitoring – Track Email, Phone, Chat, and Social Media effectiveness.
⏳ Response Time Tracking – Reduce delays and improve customer satisfaction.
📅 Monthly Trend Analysis – Detect patterns before problems grow.
🔍 Smart Filters (Slicers) – Drill down by date, region, product, or channel instantly.
📦 What’s Inside the NPS Dashboard in Power BI
This ready-to-use Power BI file contains 5 professionally designed dashboard pages:
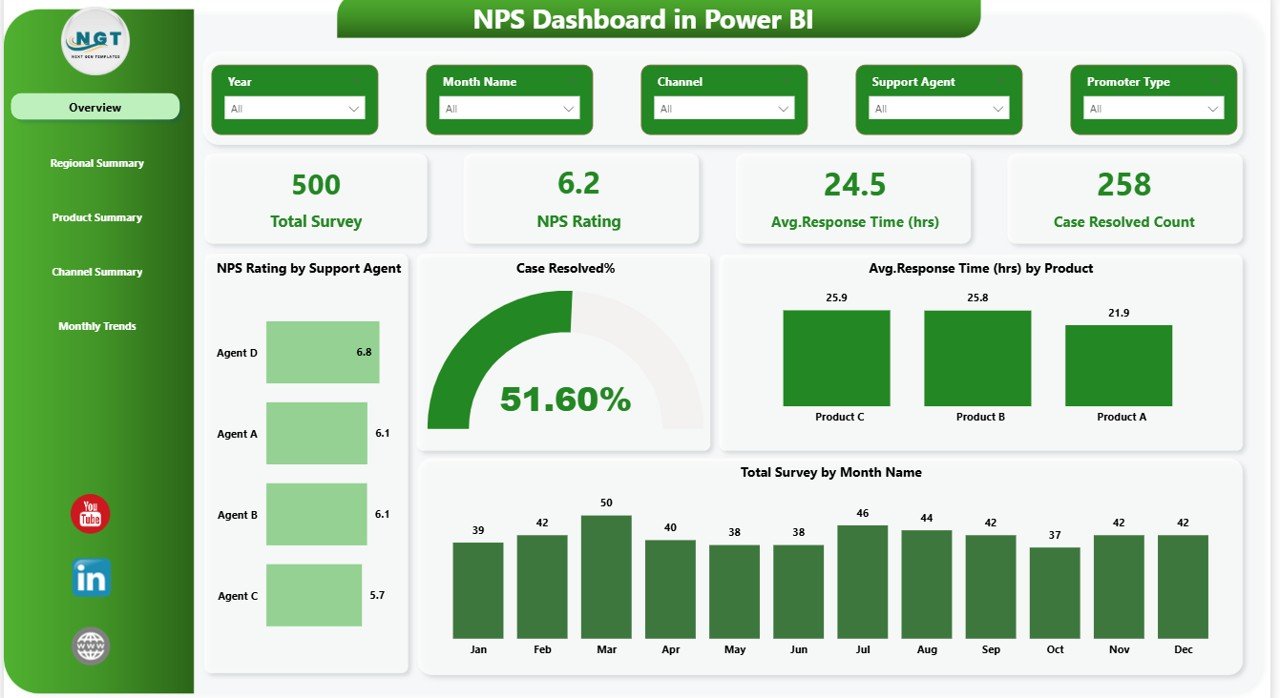
1️⃣ Overview Page
-
Total Survey Count
-
NPS Rating
-
Average Response Time (Hours)
-
Case Resolved Count
-
NPS by Agent
-
Resolution % by Product
-
Monthly Survey Trends
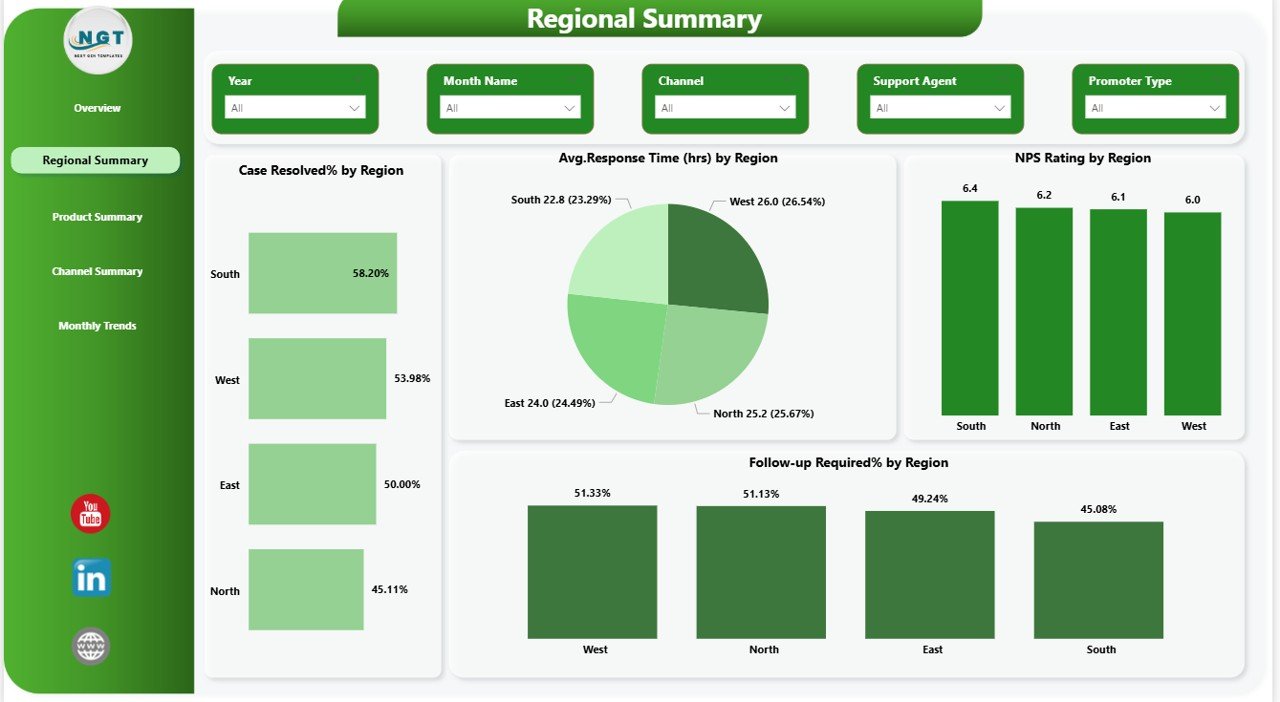
2️⃣ Regional Summary
-
Case Resolved % by Region
-
Average Response Time by Region
-
NPS Rating by Region
-
Follow-Up Required % by Region
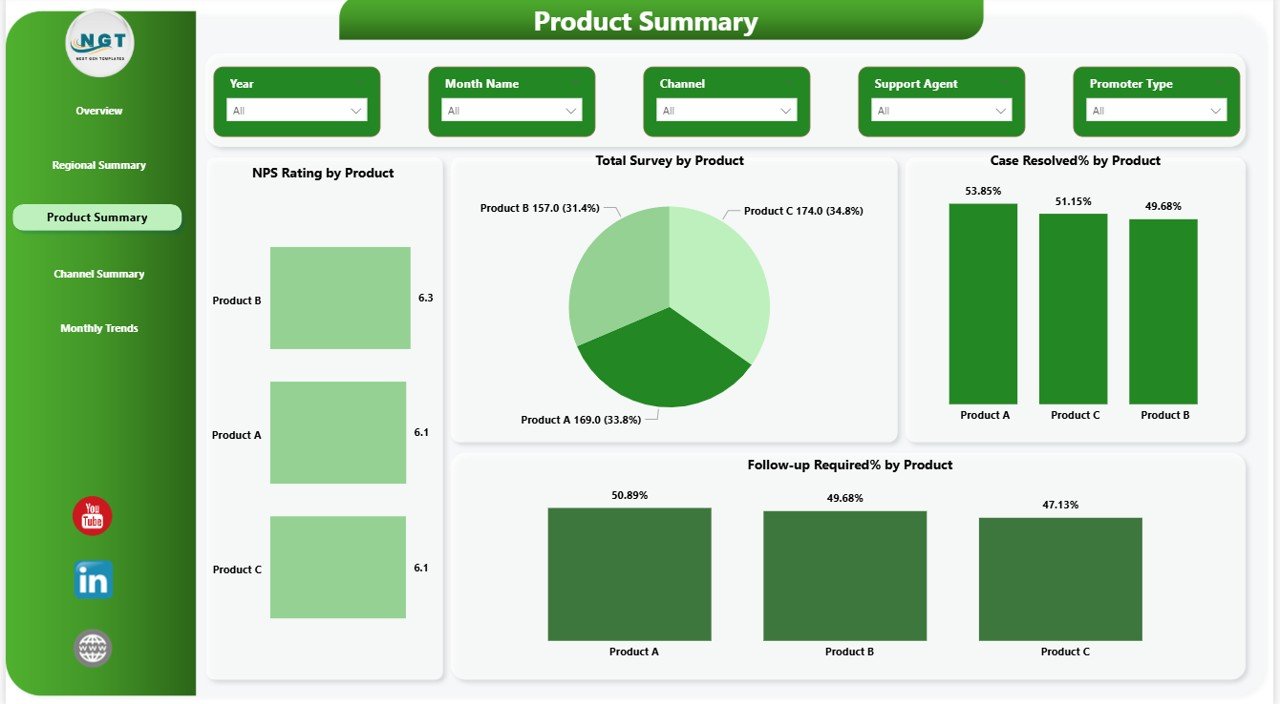
3️⃣ Product Summary
-
NPS Rating by Product
-
Survey Volume by Product
-
Case Resolution % by Product
-
Follow-Up % by Product
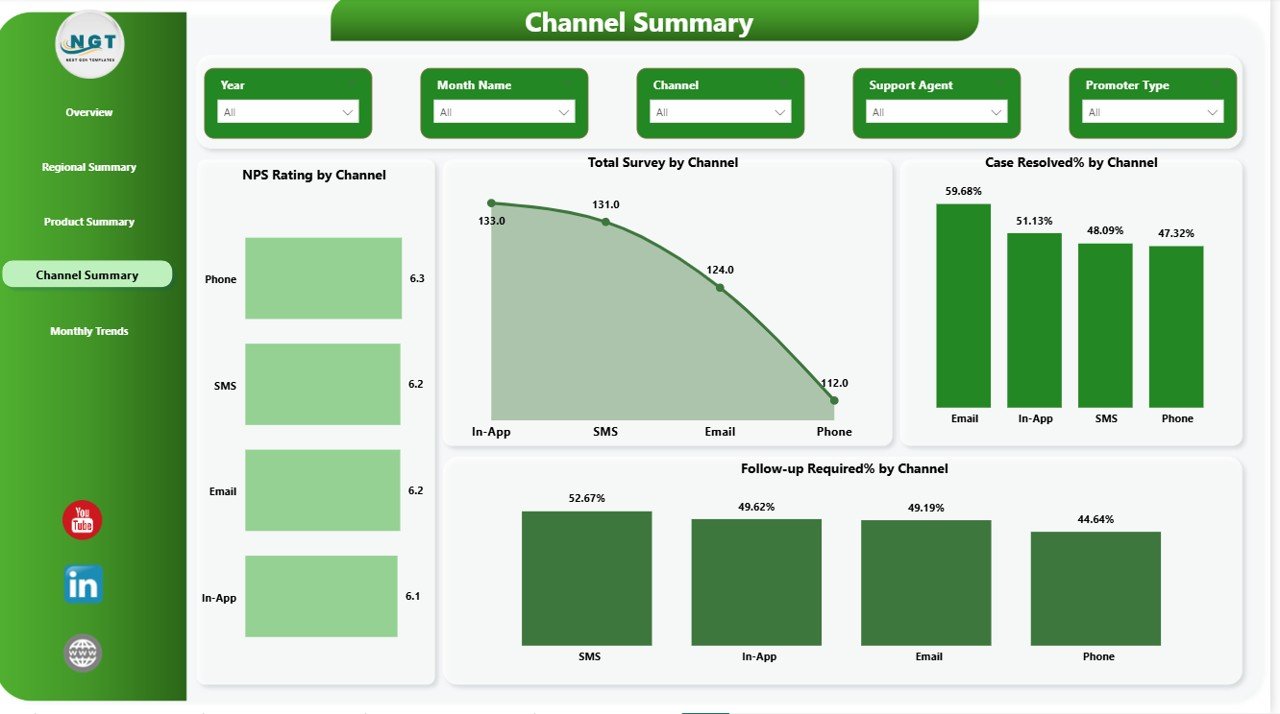
4️⃣ Channel Summary
-
NPS by Channel
-
Total Surveys by Channel
-
Resolution % by Channel
-
Follow-Up % by Channel
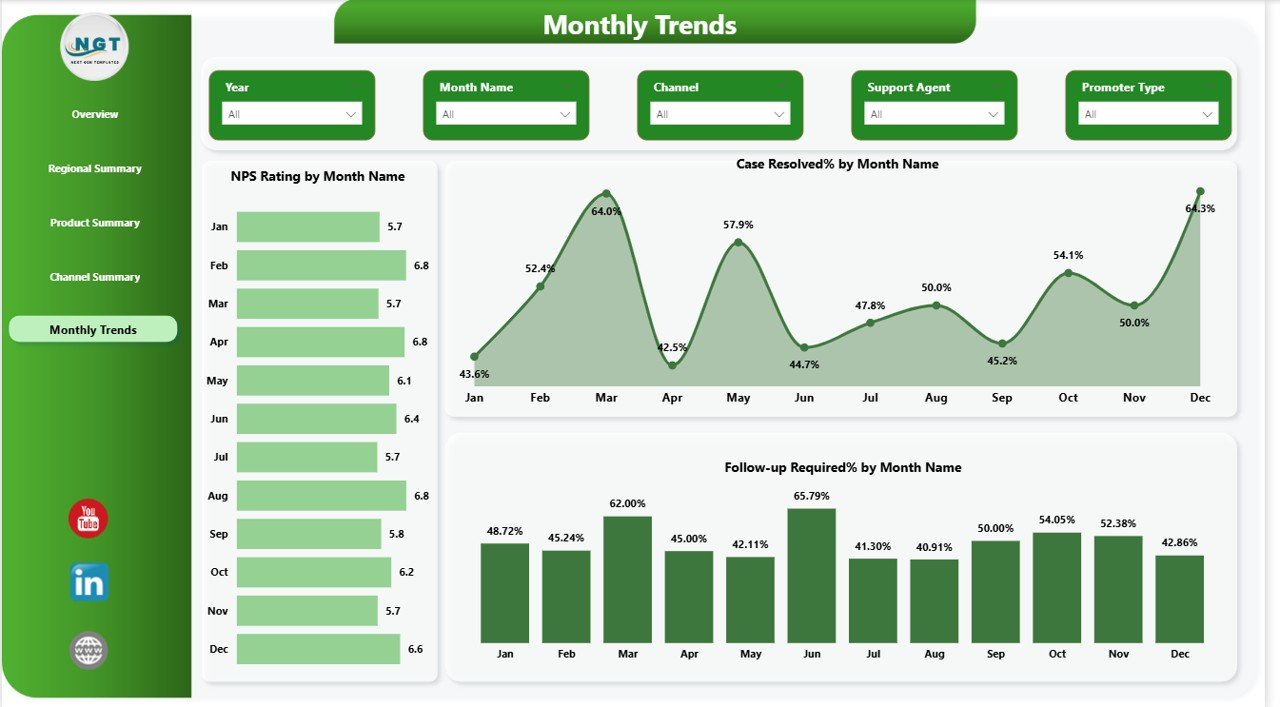
5️⃣ Monthly Trends
-
NPS Trend by Month
-
Resolution Rate Trend
-
Follow-Up Trend
All pages include dynamic slicers for easy filtering and deeper insights.
⚙️ How to Use the NPS Dashboard in Power BI
Using this dashboard is simple:
1️⃣ Import your survey data into Power BI
2️⃣ Refresh the dataset
3️⃣ Use slicers to filter by month, region, product, or channel
4️⃣ Monitor KPI cards and visual insights
5️⃣ Share the dashboard with leadership
Within minutes, you will gain full visibility over customer loyalty performance.
👥 Who Can Benefit from This NPS Dashboard in Power BI?
✔ Customer Experience Managers
✔ Support Team Leaders
✔ Operations Managers
✔ Regional Managers
✔ Product Managers
✔ Business Owners
✔ CX Analysts
✔ Startups & Enterprises
If customer feedback impacts your business, this dashboard is for you.
💡 Why This Dashboard Is a Game-Changer
Companies with strong NPS often grow 2x faster than competitors. A score above 50 indicates strong loyalty. Tracking NPS monthly helps detect service gaps early and improve retention.
This dashboard helps you:
✔ Centralize reporting
✔ Improve accountability
✔ Detect issues faster
✔ Reduce response time
✔ Increase customer retention
✔ Make smarter business decisions
Stop reacting late. Start leading with data.
Click here to read the Detailed blog post
Watch the step-by-step video tutorial:


