


NFT marketplaces have reshaped the digital economy by enabling artists, creators, collectors, and investors to trade digital assets globally. NFT Marketplaces KPI Dashboard in Excel However, as marketplace activity increases, tracking performance becomes more complex. Metrics such as transactions, active users, revenue, and growth trends often remain scattered across multiple reports.
NFT Marketplaces KPI Dashboard in Excel That is exactly why the NFT Marketplaces KPI Dashboard in Excel becomes a must-have performance monitoring solution 🚀.
This ready-to-use Excel dashboard provides a centralized, visual, and data-driven system to track marketplace KPIs efficiently. Instead of switching between tools and spreadsheets, marketplace owners and analysts gain instant clarity on actuals, targets, trends, and historical comparisons—all in one structured Excel file.
Whether you manage an NFT trading platform, creator marketplace, or digital asset ecosystem, this dashboard empowers you to make faster, smarter, and more confident decisions.
🔑 Key Features of NFT Marketplaces KPI Dashboard in Excel
📊 Centralized KPI Tracking
Monitor all NFT marketplace KPIs in one Excel dashboard.
🎯 Target vs Actual Comparison
Identify performance gaps instantly.
📅 MTD & YTD Performance Monitoring
Track both short-term and long-term marketplace growth.
📈 Trend Analysis
Understand transaction and revenue patterns over time.
🚦 Visual Performance Indicators
Green ▲ and Red ▼ arrows highlight KPI status clearly.
🧠 Clear KPI Definitions
Eliminate confusion with standardized KPI logic.
⚙️ Excel-Based & Customizable
No advanced analytics tools required.
📦 What’s Inside the NFT Marketplaces KPI Dashboard in Excel
🏠 Home Sheet – Easy Navigation

The Home Sheet acts as a central index for the entire dashboard.
✔ Six navigation buttons
✔ One-click access to all sheets
✔ Clean and user-friendly layout
This design ensures smooth navigation for both technical and non-technical users.
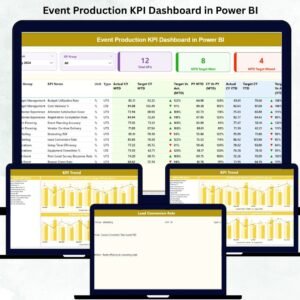
📊 Dashboard Sheet – Complete KPI Overview
The Dashboard Sheet is the core analytical page.
🎛 Month Selection
Users select the reporting month from cell D3. Once selected, the entire dashboard updates automatically.
📋 KPI Performance Table
MTD Metrics
-
Actual MTD
-
Target MTD
-
Previous Year MTD
-
Target vs Actual (%)
-
Previous Year vs Actual (%)
-
▲ / ▼ performance indicator
YTD Metrics
-
Actual YTD
-
Target YTD
-
Previous Year YTD
-
Target vs Actual (%)
-
Previous Year vs Actual (%)
-
▲ / ▼ performance indicator
With visual indicators, users instantly identify underperforming and high-performing KPIs.
📈 KPI Trend Sheet – Deep Performance Analysis
The KPI Trend Sheet enables detailed KPI-level insights.
🎯 KPI Selection
Users select a KPI name from cell C3.
📌 KPI Details Displayed
-
KPI Group
-
Unit of Measurement
-
KPI Type (UTB / LTB)
-
KPI Formula
-
KPI Definition
📊 Trend Charts
-
MTD Trend Chart – Actual vs Target vs PY
-
YTD Trend Chart – Actual vs Target vs PY
These visuals help detect growth trends, seasonal behavior, and performance volatility.
🧾 Input Sheets – Simple & Structured
📥 Actual Numbers Input Sheet
Users enter:
-
KPI Name
-
MTD Actual Value
-
YTD Actual Value
🎯 Target Sheet
Stores KPI-wise:
-
MTD Targets
-
YTD Targets
📆 Previous Year Number Sheet
Captures last year’s MTD and YTD values for year-over-year comparison.
📘 KPI Definition Sheet
Defines:
-
KPI Name
-
KPI Group
-
Unit
-
Formula
-
KPI Definition
This ensures consistent KPI interpretation across teams.
👥 Who Can Benefit from This Dashboard
🎨 NFT marketplace owners
📊 Data & business analysts
🚀 Web3 startups
💼 Founders & product managers
🖼️ Digital asset platforms
📈 Strategy & growth teams
🔍 Click here to read the Detailed blog post
📺 Visit our YouTube channel to learn step-by-step video tutorials
👉 Youtube.com/@PKAnExcelExpert


Reviews
There are no reviews yet.