


The Municipal Services KPI Dashboard in Excel is an essential tool for municipalities, local government agencies, and public service managers to monitor and optimize the performance of essential municipal services. Whether you’re managing waste collection, water supply, road maintenance, or public health initiatives, this customizable dashboard allows you to track key performance indicators (KPIs) related to the delivery of municipal services in real-time.
With this intuitive Excel template, you can monitor service delivery performance, identify operational inefficiencies, and ensure that public services are delivered effectively and equitably. The dashboard provides insights into key service areas, allowing you to assess performance, allocate resources more effectively, and improve overall service quality for the community.
Key Features of the Municipal Services KPI Dashboard
🏙️ Comprehensive Municipal Services KPI Tracking
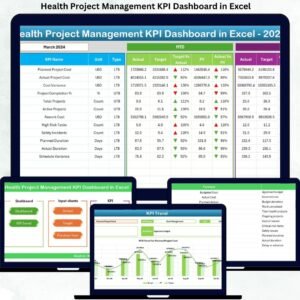
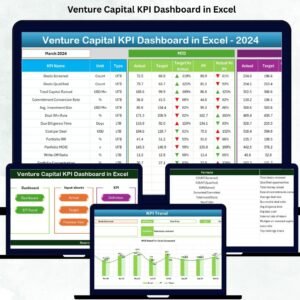
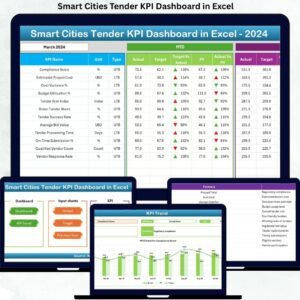
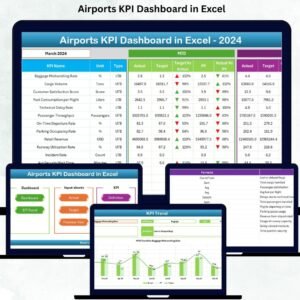
Track critical municipal KPIs such as waste collection efficiency, water usage, response times for public services, and maintenance schedules. Monitor your municipality’s service delivery performance across various departments.
⚡ Real-Time Monitoring of Municipal Services
Monitor the real-time performance of municipal services. Track service delivery times, costs, and satisfaction rates to ensure that services are meeting community expectations.
📈 Service Delivery & Operational Efficiency Insights
Visualize data related to waste management, water supply, street maintenance, and other municipal services. This helps to optimize operations, reduce inefficiencies, and improve service quality for residents.
📅 Customizable KPIs for Different Municipal Services
Easily adjust the dashboard to track specific KPIs relevant to the services in your municipality, whether you’re focusing on waste collection, road repair, water treatment, or community health services.
🖥️ Interactive & User-Friendly Interface
Designed for simplicity, this Excel-based dashboard is easy to use, with an intuitive interface that makes it simple to enter data, analyze trends, and visualize municipal service performance.
Why You’ll Love the Municipal Services KPI Dashboard

✅ Track Key Municipal Service Metrics
Monitor essential metrics like service delivery times, customer satisfaction, maintenance schedules, and operational costs in one centralized dashboard.
✅ Optimize Resource Allocation
Evaluate resource usage across departments, identify inefficiencies, and allocate resources more effectively to ensure timely and cost-effective service delivery.
✅ Enhance Service Quality
Monitor performance across various municipal services, from waste collection to road maintenance, and ensure services are delivered at the required quality levels.
✅ Improve Public Satisfaction
Track resident satisfaction and service feedback to understand the public’s perception of your municipal services. Use these insights to improve service delivery and enhance community engagement.
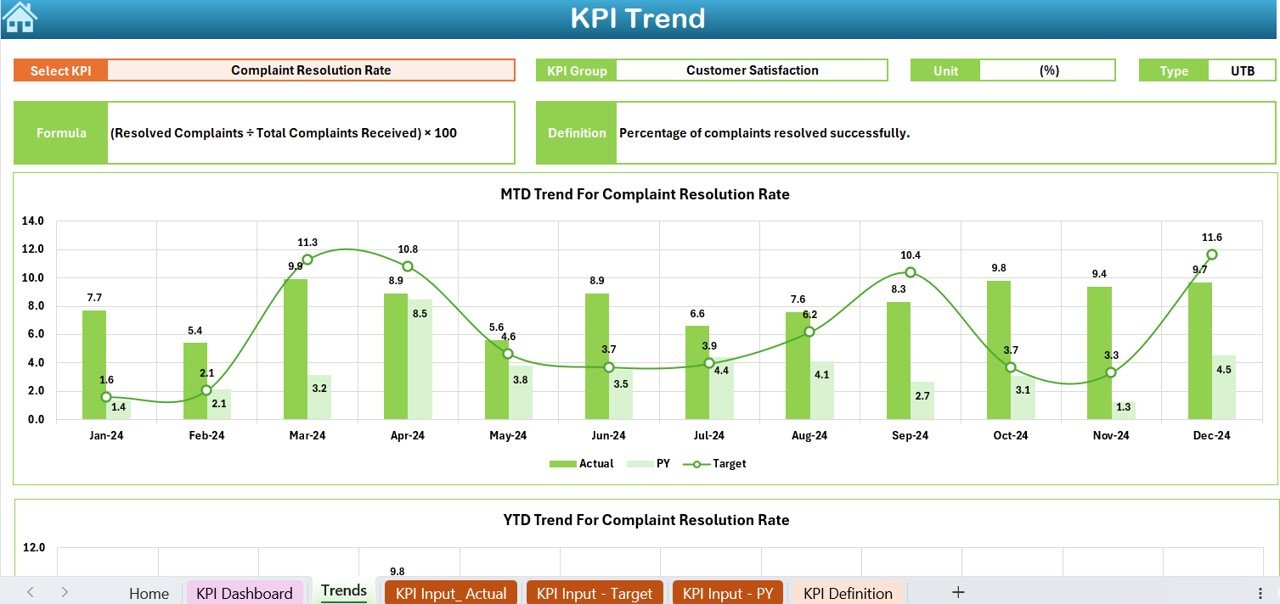
✅ Visualize and Analyze Data for Better Decision Making
Leverage interactive charts and graphs to visualize trends, identify areas for improvement, and make data-driven decisions that positively impact the community.
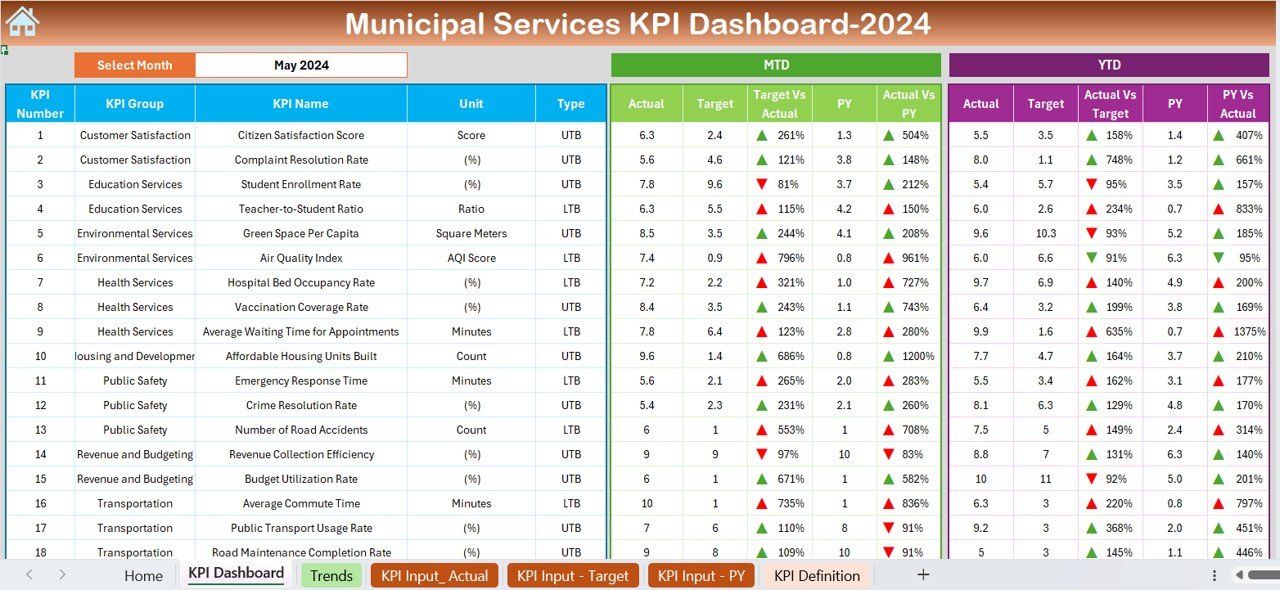
What’s Inside the Municipal Services KPI Dashboard Template?
- KPI Tracking: Monitor key performance indicators like waste collection, water usage, maintenance schedules, and service response times.
- Service Delivery Monitoring: Track and optimize service delivery across various departments, such as public health, waste management, and infrastructure.
- Cost & Resource Insights: Monitor service costs and resource allocation to identify opportunities for cost-saving.
- Satisfaction & Feedback Tracking: Track resident satisfaction, complaints, and feedback to improve service quality and public engagement.
- Customizable Metrics: Adjust the dashboard to track specific KPIs for different municipal services, ensuring the dashboard fits your municipality’s needs.
How to Use the Municipal Services KPI Dashboard
1️⃣ Download the Template: Get instant access to your Municipal Services KPI Dashboard.
2️⃣ Input Your Data: Enter data related to service delivery, costs, maintenance schedules, and public feedback.
3️⃣ Monitor Municipal Services: Use the dashboard to track and compare performance metrics, such as waste collection efficiency and road repair times.
4️⃣ Analyze & Optimize: Use insights from the dashboard to optimize your municipal service delivery, improve efficiency, and enhance community satisfaction.
Who Can Benefit from the Municipal Services KPI Dashboard?
🔹 Municipal Managers & Service Coordinators
🔹 Local Government Agencies
🔹 Public Service Managers (Waste Management, Water Supply, Infrastructure, etc.)
🔹 Community Engagement Coordinators
🔹 Public Health Departments
🔹 Any Organization Focused on Improving Municipal Service Delivery
Monitor, optimize, and improve your municipal service delivery with the Municipal Services KPI Dashboard in Excel. Track key service metrics, enhance operational efficiency, and ensure your municipality delivers high-quality services to the community.
Click here to read the Detailed blog post
Visit our YouTube channel to learn step-by-step video tutorials
Youtube.com/@PKAnExcelExpert


Reviews
There are no reviews yet.