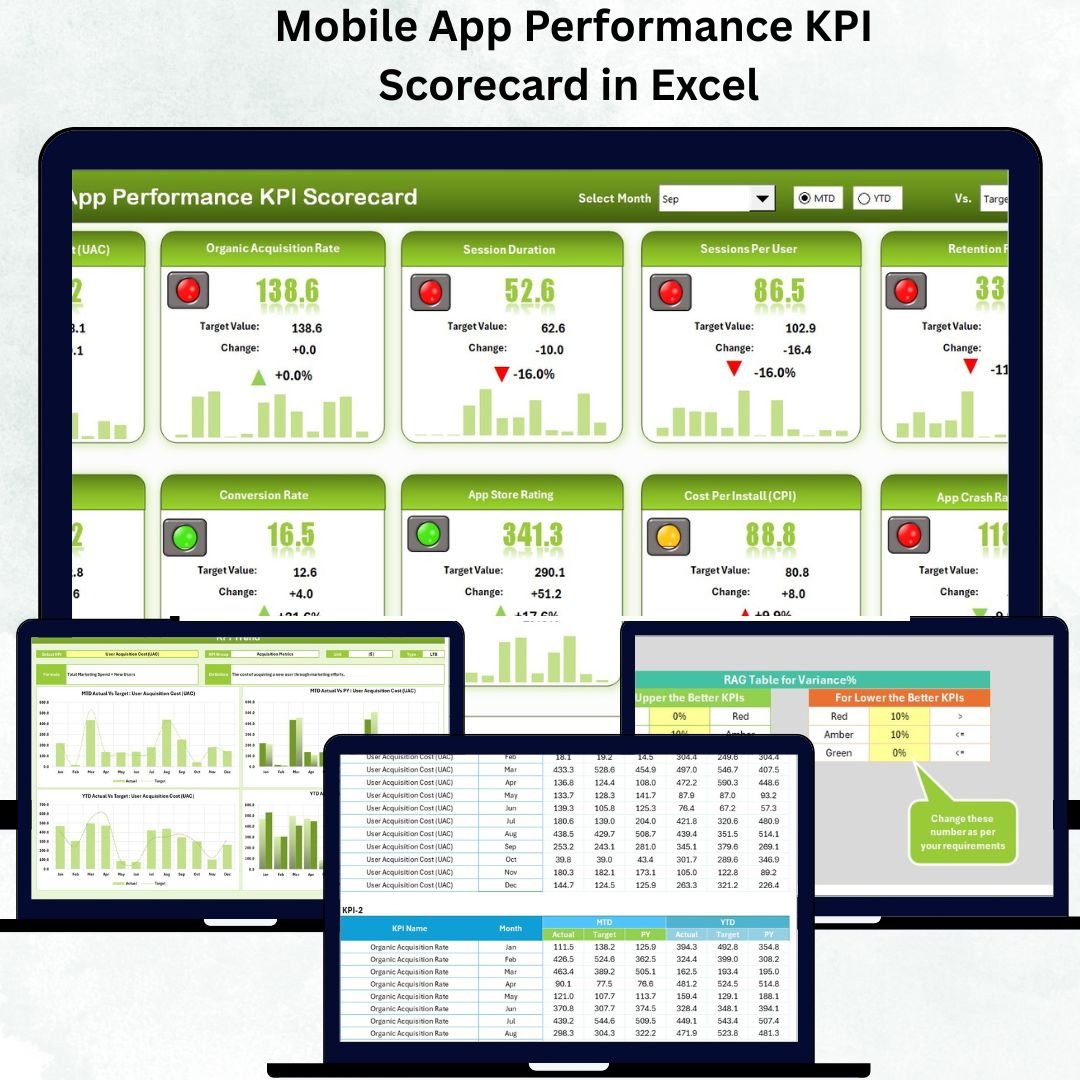
In today’s highly competitive digital landscape, every mobile app competes for user attention, retention, and revenue. Understanding what drives growth — and where performance lags — is essential for success. The Mobile App Performance KPI Scorecard in Excel helps app teams track performance across multiple metrics, analyze trends, and make data-driven decisions — all within an easy-to-use Excel framework.
This powerful, ready-to-use scorecard enables developers, marketers, product managers, and executives to monitor app health in real time through key metrics like downloads, active users, crash rate, churn, and revenue. With just a few clicks, you can view Month-to-Date (MTD) and Year-to-Date (YTD) results, compare actuals vs. targets, and visualize growth patterns.
No coding. No complex tools. Just Excel — made smarter.
⚙️ Key Features of the Mobile App Performance KPI Scorecard in Excel
📊 4 Functional Worksheets – Scorecard, KPI Trend, Input Data, and KPI Definition.
📈 Dropdown Menus – Instantly switch between months and MTD/YTD views.
🎯 Actual vs Target Comparison – Evaluate performance gaps at a glance.
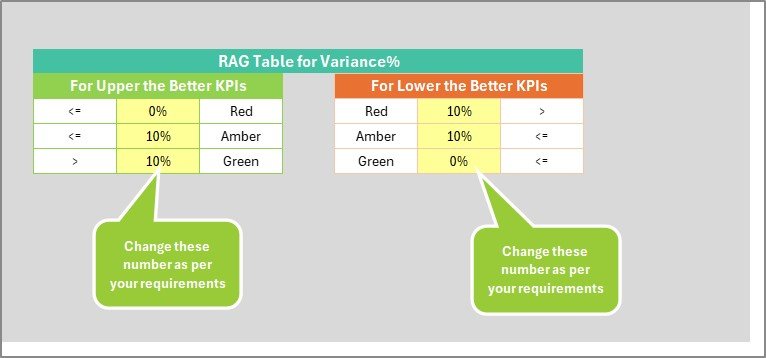
📍 Color-Coded Icons – Green for success, red for underperformance.
💡 Automatic Trend Charts – Visualize KPI progress month by month.
📎 KPI Metadata Display – Unit, formula, and definition for every metric.
📊 Comprehensive KPI View – Track Acquisition, Engagement, Retention, Performance, and Revenue metrics.
💻 Completely Excel-Based – No add-ons, VBA, or external tools needed.
📤 Printable and Shareable – Export visuals for presentations or reports.
🧭 Dashboard Structure Overview
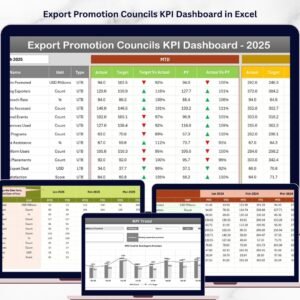
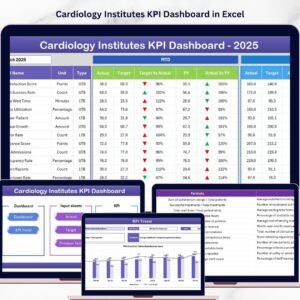
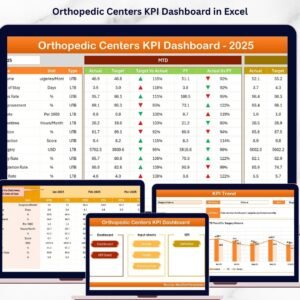
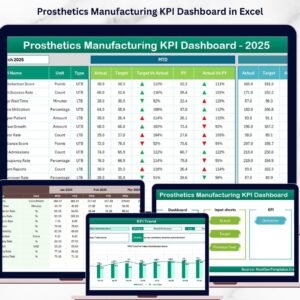
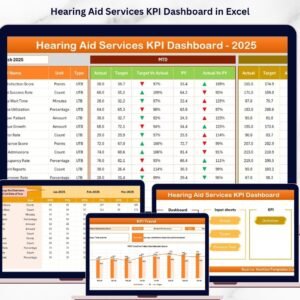
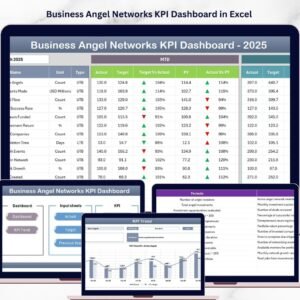
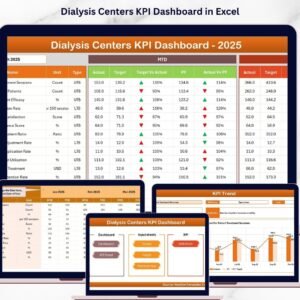
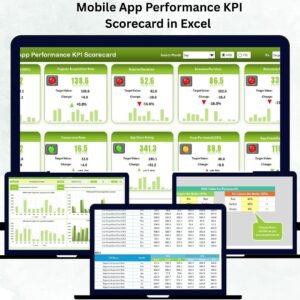
🏠 1️⃣ Scorecard Sheet — The Central Dashboard
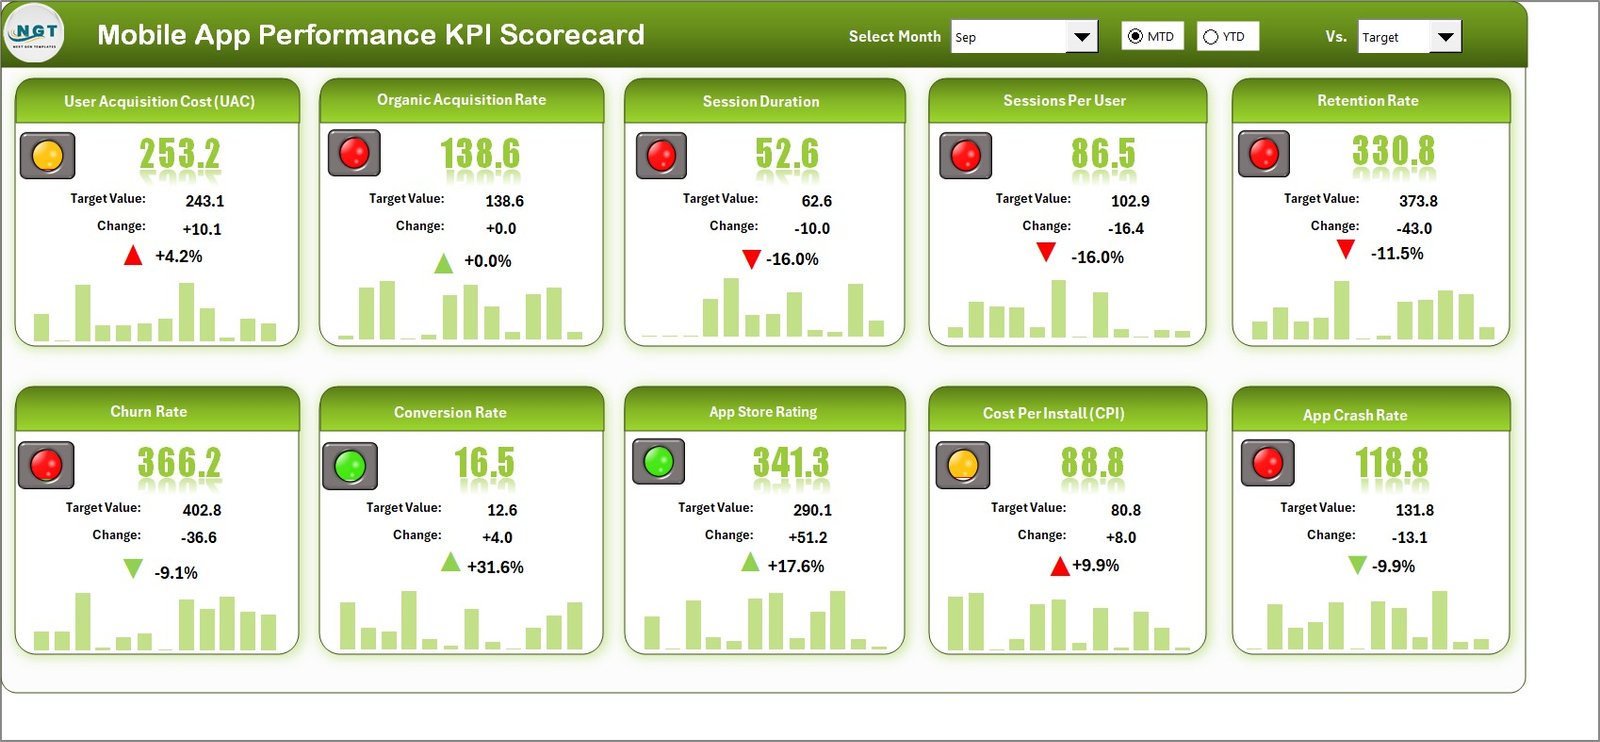
The Scorecard Sheet gives a bird’s-eye view of app performance.
-
Dropdown Filters: Choose Month and MTD/YTD mode.
-
KPI Table: View Actual, Target, and Variance for each KPI.
-
Conditional Formatting: Green/red icons instantly highlight success or shortfalls.
-
KPIs Included: Downloads, DAU, Crash Rate, Retention Rate, ARPU, Revenue, etc.
💡 Purpose: Provide an instant summary of app performance across all key areas.
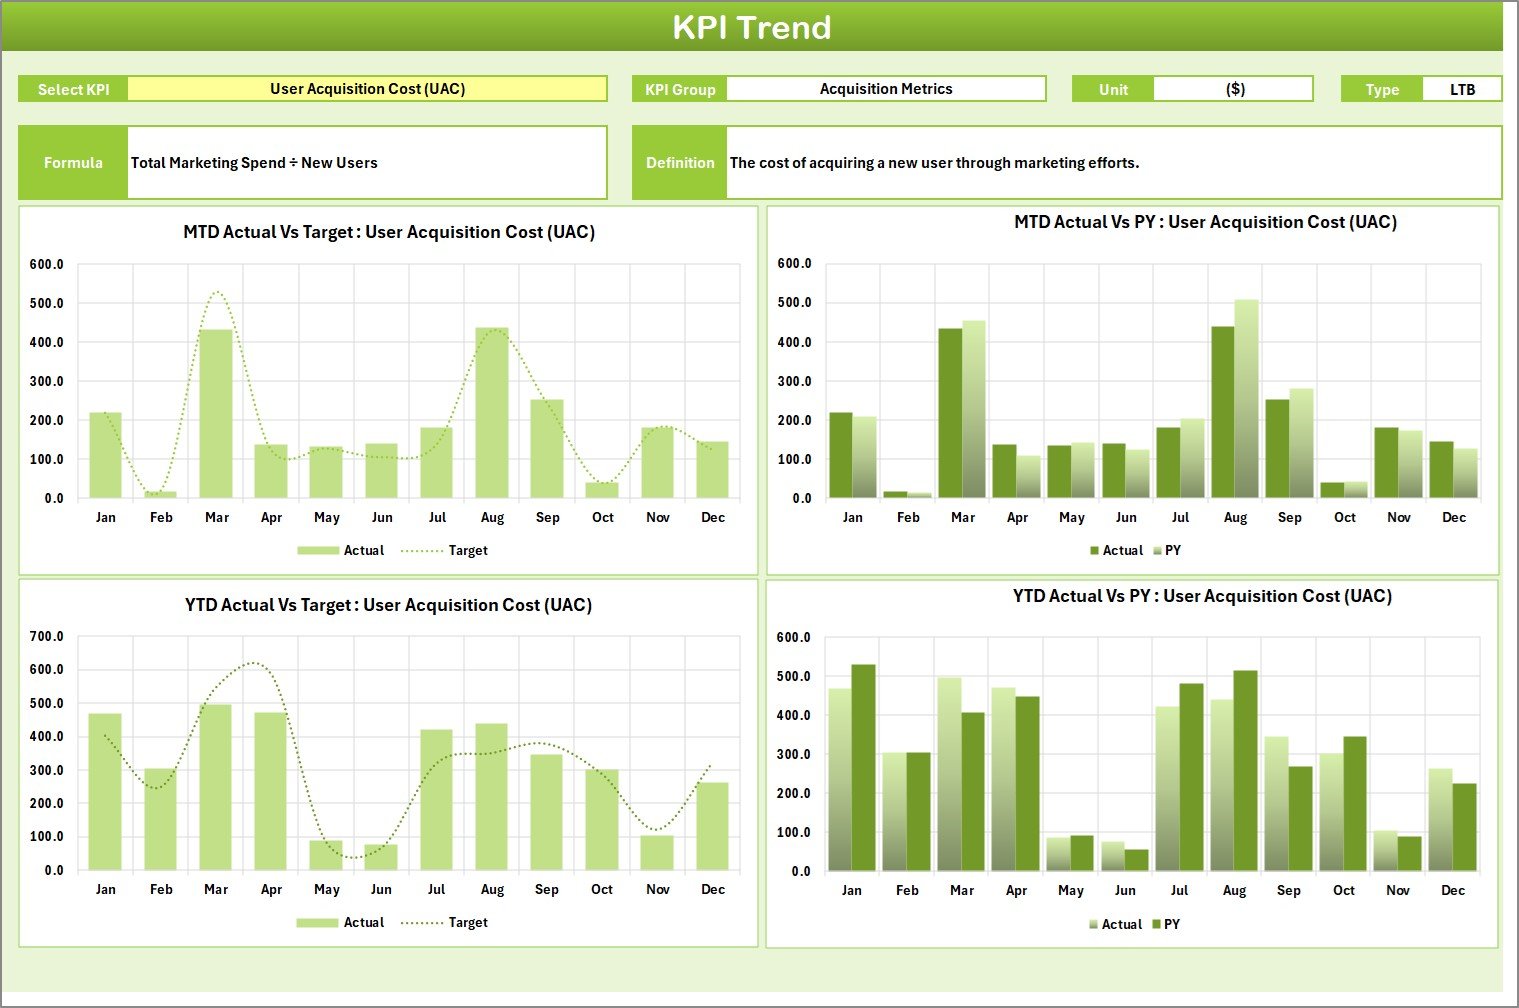
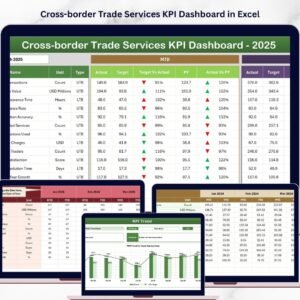
📈 2️⃣ KPI Trend Sheet — Visualize Performance Over Time
Dive deeper into month-over-month progress.
-
KPI Selector: Choose a KPI (cell C3) to analyze detailed trends.
-
Metadata Display: KPI Group, Unit, Type (UTB/LTB), Formula, and Definition auto-populate.
-
Trend Charts: Compare Actual, Target, and Previous Year (PY) for both MTD and YTD.
🎯 Purpose: Identify patterns, spot growth opportunities, and correct issues proactively.
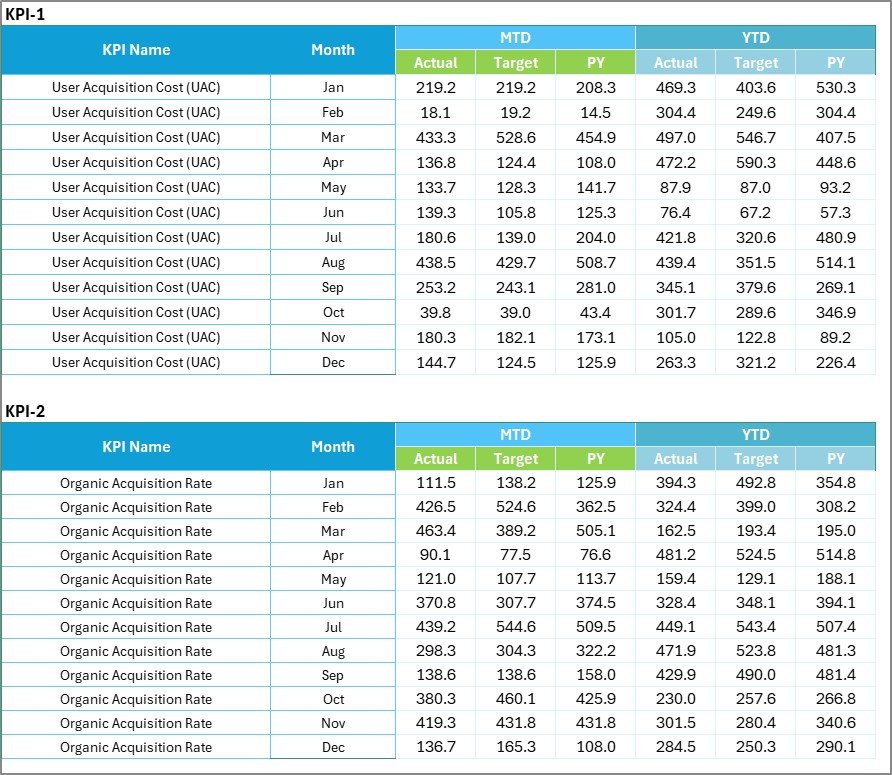
🧮 3️⃣ Input Data Sheet — The Engine Behind the Dashboard
Enter or import monthly data here.
-
Columns Include: KPI Name, Month, MTD Actual, YTD Actual, and Target.
-
Auto-Linking: All visuals and calculations update instantly.
-
Flexible Design: Add new KPIs or months without reconfiguring.
💡 Purpose: Maintain clean, structured, and accurate data flow.
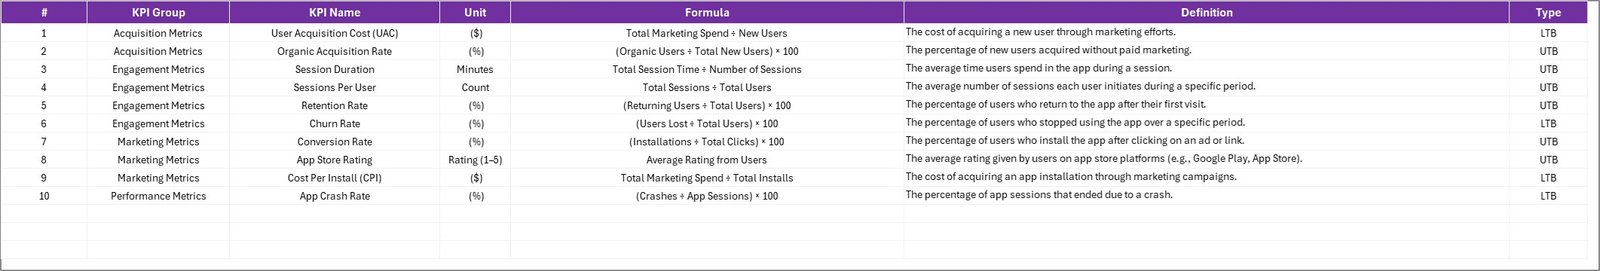
📘 4️⃣ KPI Definition Sheet — The Knowledge Base
Maintain clear documentation for all performance metrics.
-
Fields Include: KPI Group, Name, Unit, Formula, Definition, and Type (UTB/LTB).
-
Standardization: Ensures everyone interprets KPIs consistently.
🎯 Purpose: Keep transparency and clarity across teams.
📊 Common KPIs to Track
🔹 Acquisition KPIs
-
App Downloads
-
Cost per Install (CPI)
-
Conversion Rate
🔹 Engagement KPIs
-
Daily Active Users (DAU)
-
Monthly Active Users (MAU)
-
Session Duration
🔹 Retention & Churn KPIs
-
Retention Rate
-
Churn Rate
-
Session Frequency
🔹 Performance KPIs
-
Crash Rate
-
App Load Time
-
Error Rate
🔹 Revenue KPIs
-
In-App Purchase Revenue
-
Ad Revenue
-
ARPU
-
Customer Lifetime Value (CLV)
Each KPI is tagged as UTB (Upper the Better) or LTB (Lower the Better) for quick analysis.
🌟 Advantages of the Mobile App Performance KPI Scorecard in Excel
✅ Centralized Tracking – All app metrics in one view.
✅ Simple & Intuitive – Ideal for non-technical users.
✅ Real-Time Insights – Instantly updated visuals.
✅ Performance Comparison – MTD, YTD, and PY analysis in one place.
✅ Scalable Design – Add new KPIs, products, or departments easily.
✅ Cost-Effective Solution – No subscriptions or special tools required.
✅ Data-Driven Decisions – Replace guesswork with real insights.
💡 Best Practices for Using the Scorecard
📌 Focus on 10–15 key KPIs that align with your app goals.
📌 Update monthly for consistent insights.
📌 Maintain clean data — avoid blanks or duplicates.
📌 Use consistent currency and units.
📌 Protect formulas to prevent unintentional edits.
📌 Refresh charts after each update for accurate visuals.
📌 Automate with Power Query or integrate with Power BI for live data.
👥 Who Can Benefit
📱 App Developers – Monitor app performance and crash rates.
🎯 Product Managers – Measure feature success and retention.
💰 Marketing Teams – Track installs, conversion rates, and ROI.
📈 Finance Teams – Analyze revenue and ARPU trends.
👨💼 Executives – Get a complete view of app performance KPIs.


Reviews
There are no reviews yet.