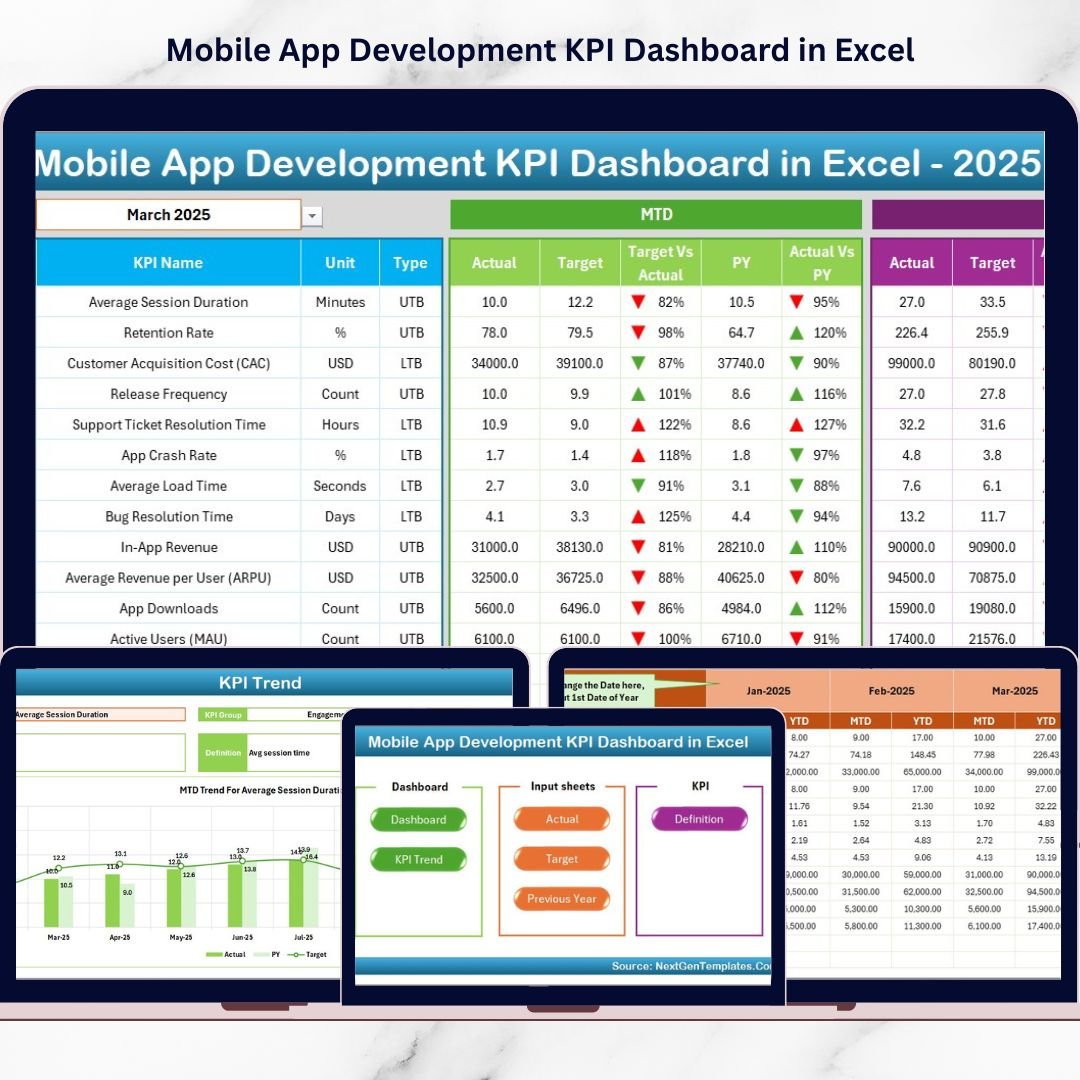
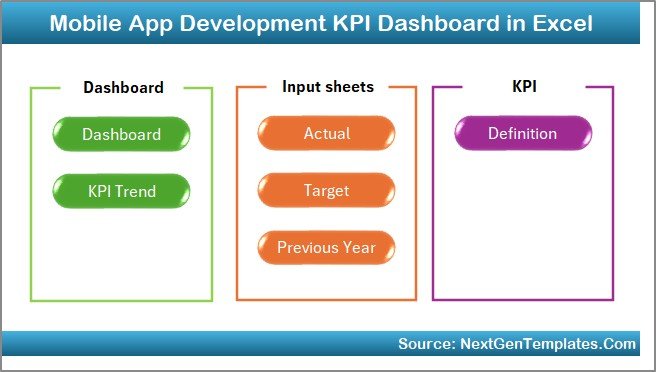
Introducing the Mobile App Development KPI Dashboard in Excel — a ready-to-use, structured performance monitoring system built specifically for mobile app teams.
This powerful Excel dashboard centralizes development metrics, quality indicators, user growth data, and financial KPIs — all in one place.
No complicated software. No technical setup. Just smart tracking and instant clarity.
🚀 Key Feature of Mobile App Development KPI Dashboard in Excel
📊 7 Structured Worksheets – Organized, automated, and easy to navigate.
📅 Dynamic Month Selection (Cell D3) – Instantly switch reporting month.
📈 MTD & YTD Tracking – Monitor short-term and long-term performance.
🎯 Actual vs Target Comparison – Spot performance gaps instantly.
🔁 Previous Year Benchmarking – Measure growth year-over-year.
📉 Conditional Formatting Arrows – Green & Red indicators for quick insights.
📊 KPI Trend Charts – Visual performance tracking for deeper analysis.
🧩 Fully Customizable Template – Add or modify KPIs easily.
📦 What’s Inside the Mobile App Development KPI Dashboard in Excel
This ready-to-use template includes 7 structured worksheets designed for smooth performance management.
1️⃣ Home Sheet – Smart Navigation Hub
✔ 6 Navigation Buttons
✔ Clean Layout
✔ Quick Access to All Sheets
Move between sheets instantly without scrolling through tabs.
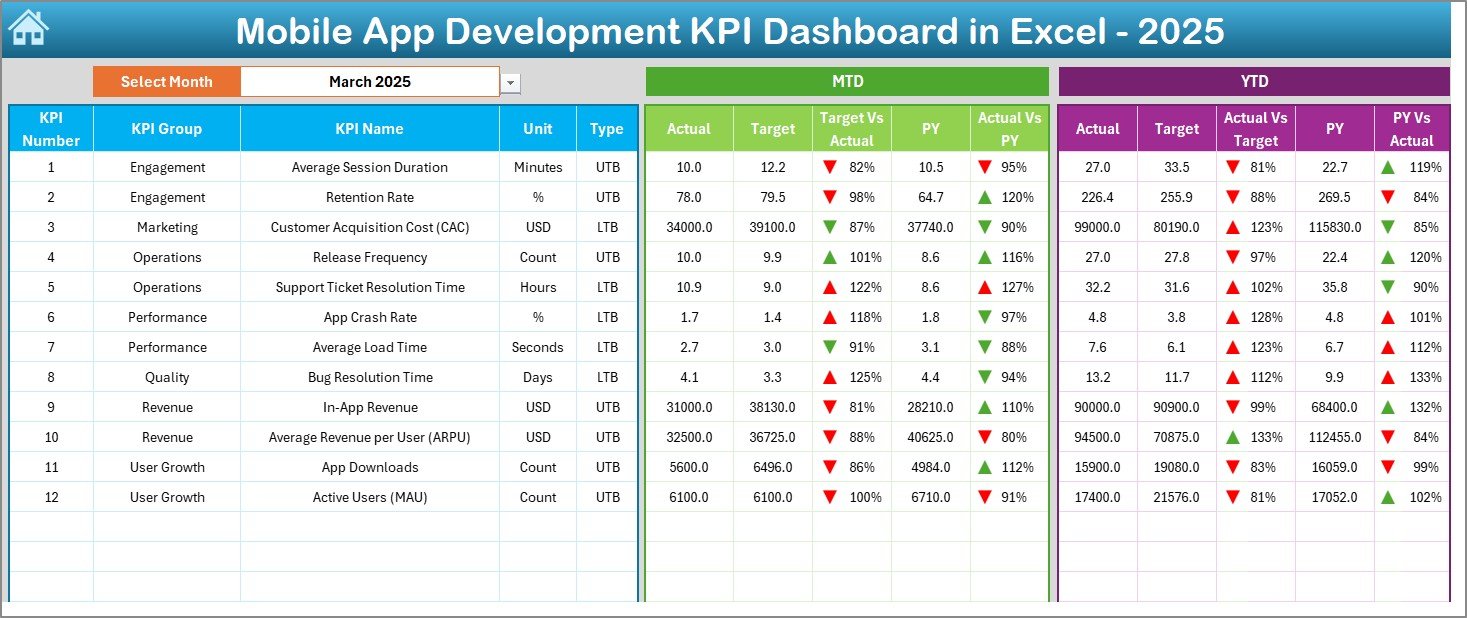
2️⃣ Dashboard Sheet – The Main Performance Screen
This is the heart of the system.
Select the month from cell D3, and the entire dashboard updates automatically.
MTD Section Includes:
-
Actual Values
-
Target Values
-
Previous Year Values
-
Target vs Actual Comparison
-
Previous Year vs Actual Comparison
-
Up/Down Arrow Indicators
YTD Section Includes:
-
YTD Actual
-
YTD Target
-
YTD Previous Year
-
Performance Variance Indicators
Decision-makers can understand performance within seconds.
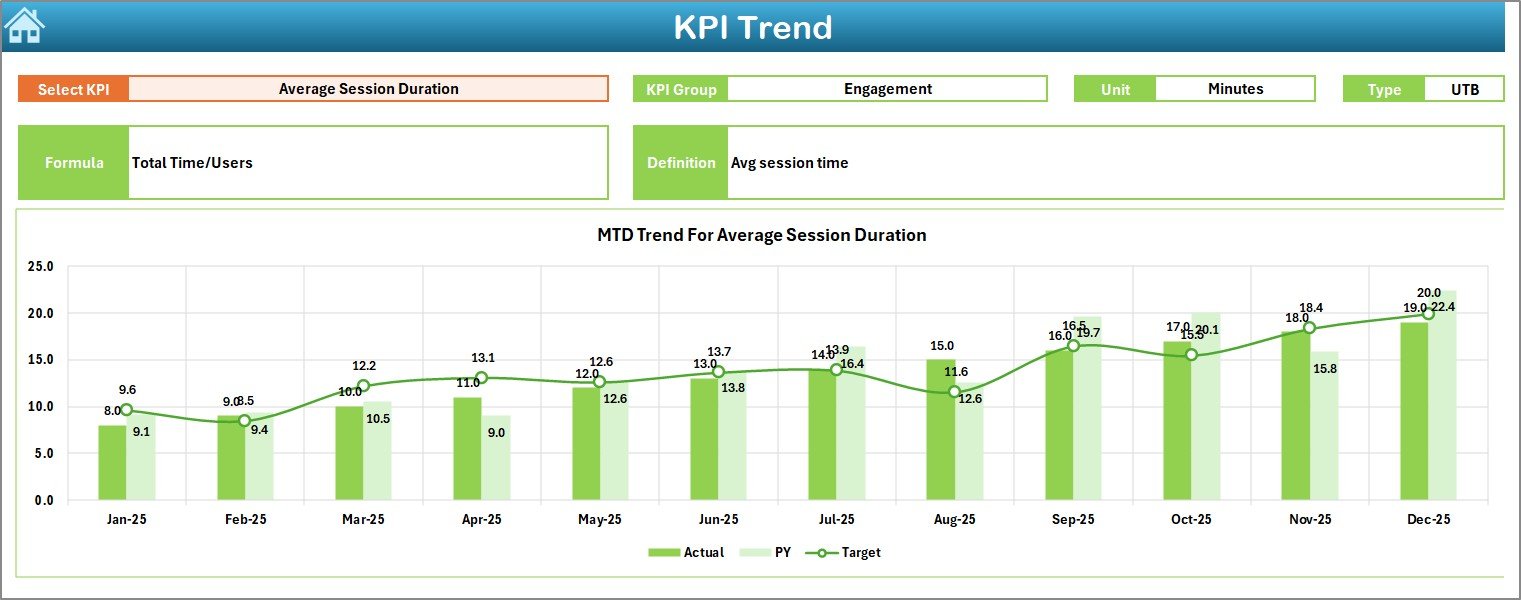
3️⃣ KPI Trend Sheet – Deep Performance Analysis
Select any KPI from cell C3 and analyze:
-
KPI Group
-
KPI Unit
-
KPI Type (LTB / UTB)
-
KPI Formula
-
KPI Definition
-
MTD Trend Chart
-
YTD Trend Chart
Perfect for leadership meetings and performance reviews.
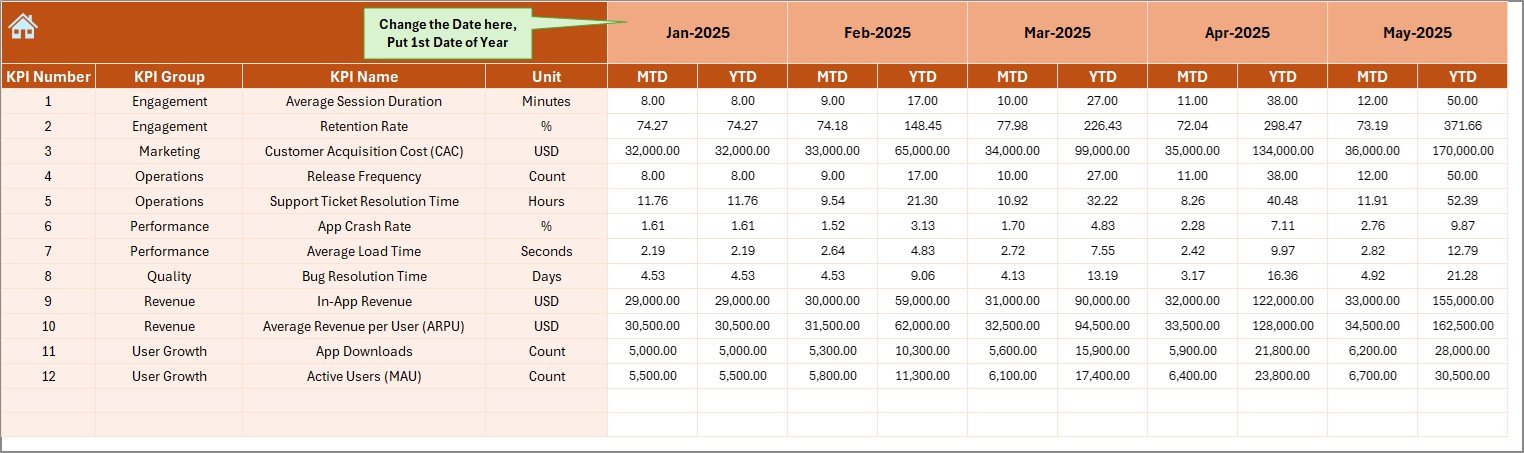
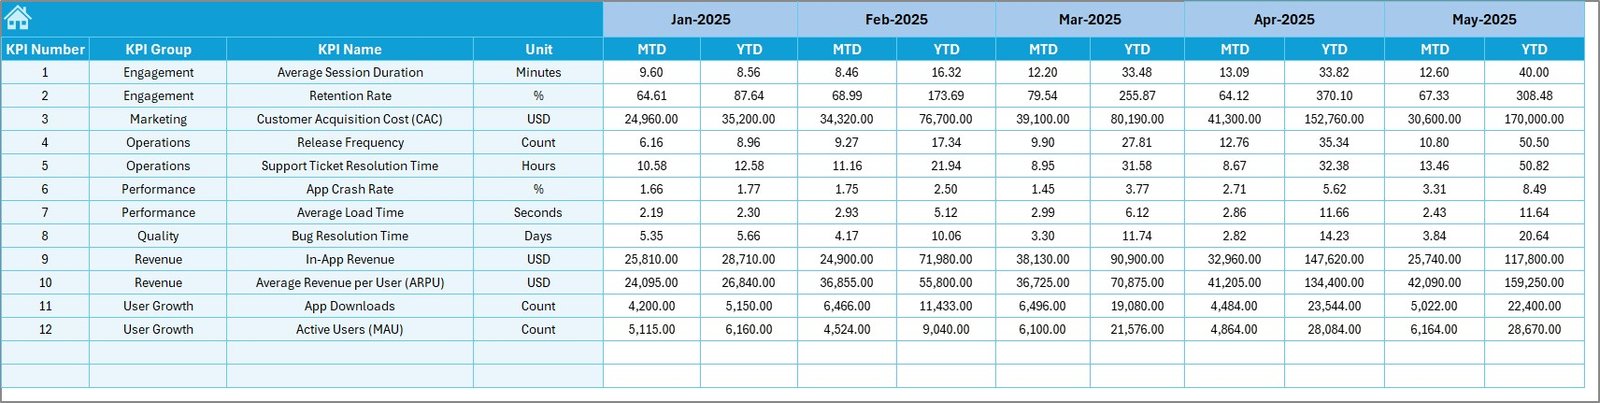
4️⃣ Actual Numbers Input Sheet – Organized Data Entry
✔ Enter First Month in Cell E1
✔ Input MTD & YTD Actual Values
✔ Dashboard Updates Automatically
Clean structure ensures accurate reporting.
5️⃣ Target Sheet – Define Performance Goals
Set:
-
Monthly MTD Targets
-
YTD Targets
Keep teams accountable with visible benchmarks.
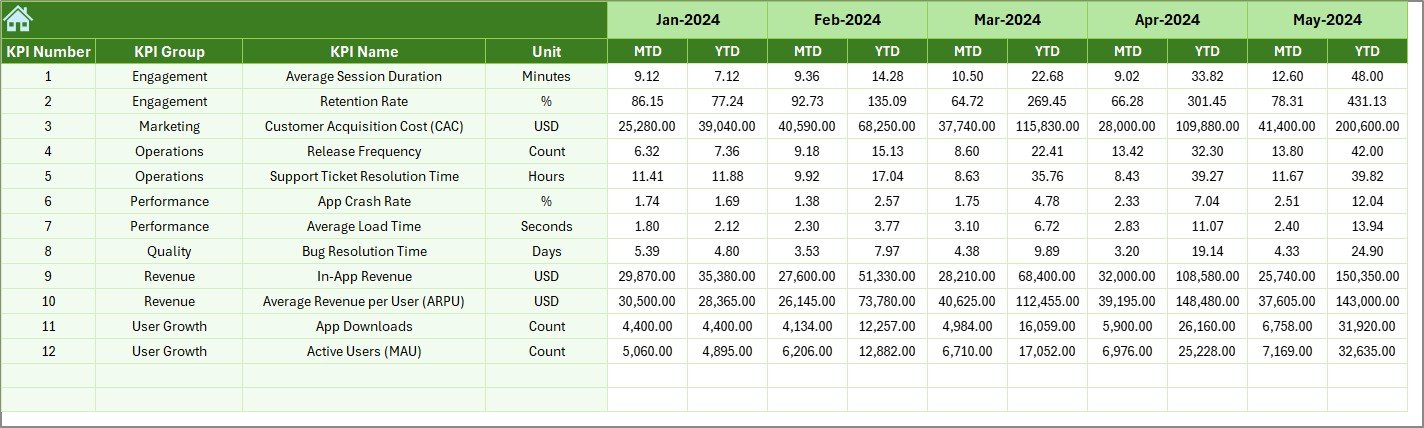
6️⃣ Previous Year Sheet – Growth Benchmarking
Compare:
-
Current Year vs Previous Year
-
Growth Trends
-
Performance Improvements
Historical context leads to smarter strategy.
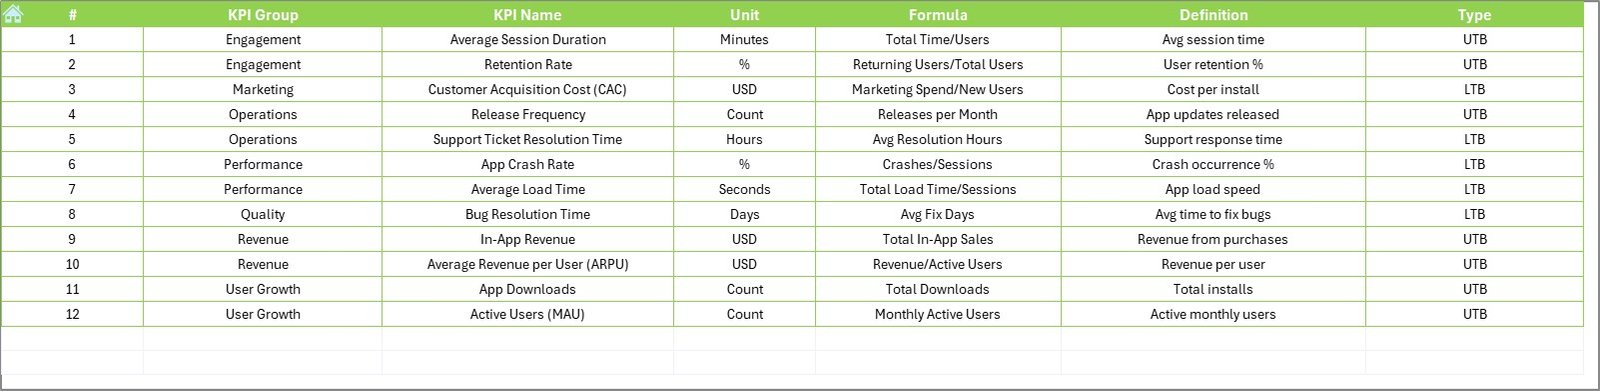
7️⃣ KPI Definition Sheet – KPI Documentation Center
Define:
-
KPI Name
-
KPI Group
-
Unit
-
Formula
-
Definition
Ensure every team member understands each metric clearly.
👥 Who Can Benefit from This Dashboard
✔ Product Managers
✔ App Developers
✔ QA Leads
✔ Marketing Teams
✔ Business Owners
✔ Startup Founders
✔ SaaS Companies
If you build, manage, or monetize mobile apps, this dashboard is built for you.
📊 What KPIs Can You Track?
Development KPIs
-
Sprint Velocity
-
Feature Completion Rate
-
Release Frequency
-
Cycle Time
Quality KPIs
-
Bug Resolution Time
-
Crash Rate
-
Defect Density
User Engagement KPIs
-
Daily Active Users (DAU)
-
Monthly Active Users (MAU)
-
Retention Rate
-
Session Duration
Financial KPIs
-
Customer Acquisition Cost (CAC)
-
Average Revenue Per User (ARPU)
-
App Revenue Growth
-
Conversion Rate
Track development speed, quality, engagement, and revenue — all in one dashboard.
💡 How This Dashboard Improves Decision-Making
Instead of reacting to problems:
-
You detect delays early
-
You control bug growth
-
You monitor user retention trends
-
You track revenue growth clearly
Conditional arrows instantly show improvement or decline.
Trend charts reveal patterns over time.
Targets create accountability.
This is not just reporting. This is performance control.
🛠 How to Use the Mobile App Development KPI Dashboard in Excel
1️⃣ Define your KPIs clearly.
2️⃣ Enter actual performance data monthly.
3️⃣ Set realistic targets.
4️⃣ Review MTD and YTD together.
5️⃣ Conduct monthly KPI review meetings.
Within minutes, you get structured insights ready for management discussions.
🔥 Why Choose Excel?
✔ No expensive software required
✔ Easy to customize
✔ Widely accessible
✔ Fast implementation
✔ Strong formula flexibility
Perfect for startups, product teams, and growing SaaS companies.
If you want to move from scattered reports to structured insights, this dashboard gives you complete control.
It’s time to track smarter.
Click here to read the Detailed blog post
Visit our YouTube channel to learn step-by-step video tutorials
👉 YouTube Channel – PKAnExcelExpert


