Mining operations demand precision. A small delay in production, a slight increase in fuel cost, or a minor safety issue can significantly impact profitability. Yet many mining companies still rely on disconnected spreadsheets that make performance tracking slow and unclear.
Now imagine monitoring production, safety, cost, and operational KPIs in one dynamic scorecard — with traffic lights, up/down arrows, and automatic monthly updates.
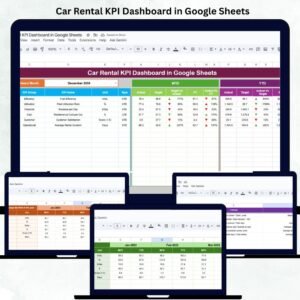
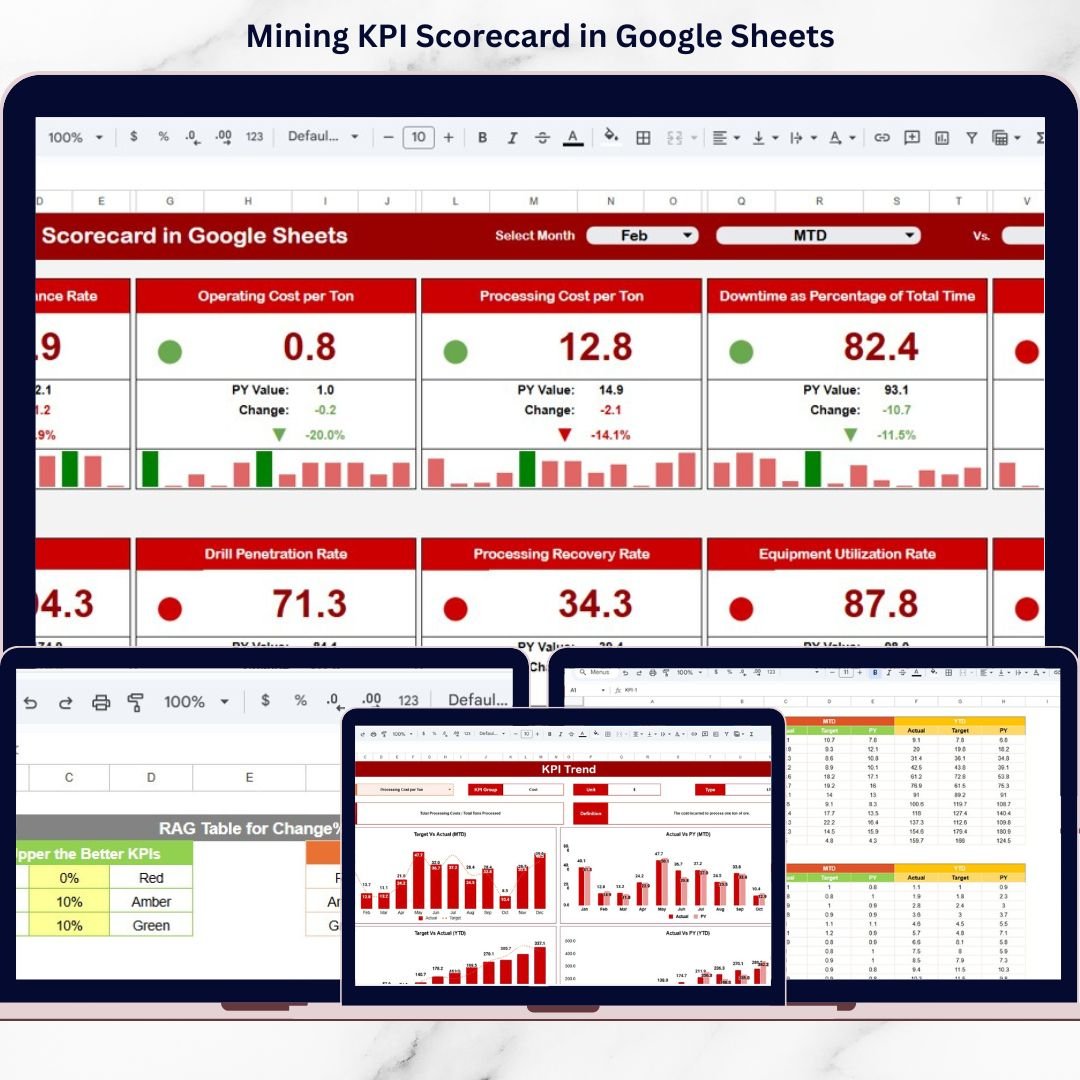
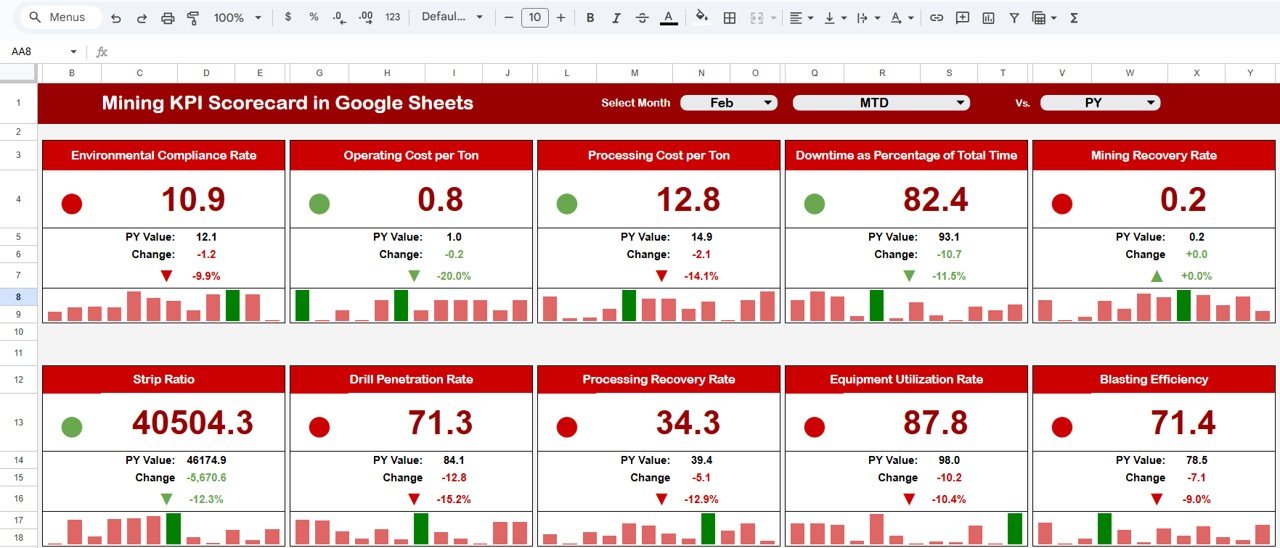
That’s exactly what the Mining KPI Scorecard in Google Sheets delivers.
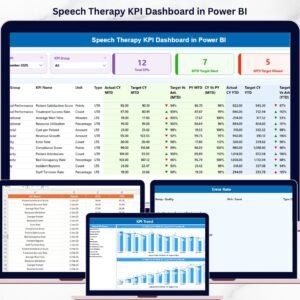
This ready-to-use Google Sheets template tracks 10 critical KPIs with MTD and YTD views, dynamic month selection, visual indicators, and automated calculations. The moment you select a new month, the entire scorecard updates instantly.
If your organization wants stronger operational control, improved safety performance, and better cost management — this scorecard is your decision-making advantage.
🚀 Key Feature of Mining KPI Scorecard in Google Sheets
📅 Dynamic Month Selection – Instantly switch between reporting periods
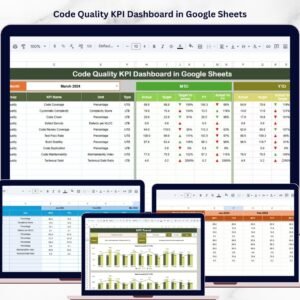
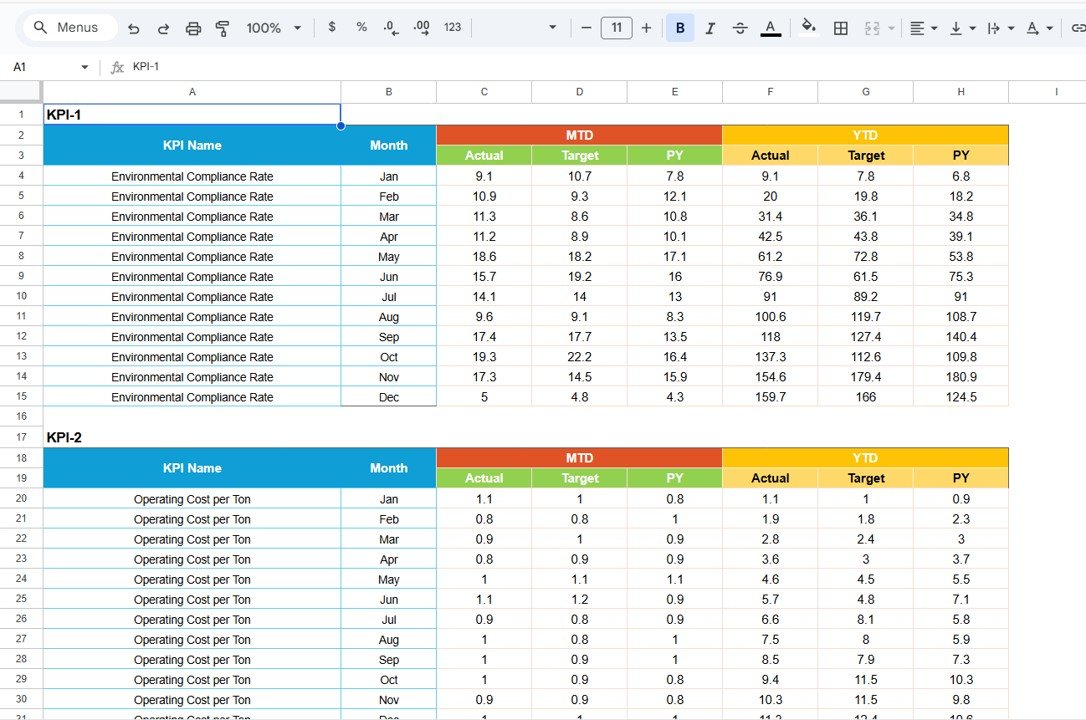
📊 MTD & YTD Views – Track short-term and long-term performance
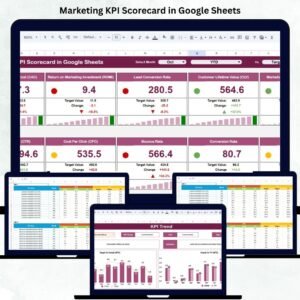
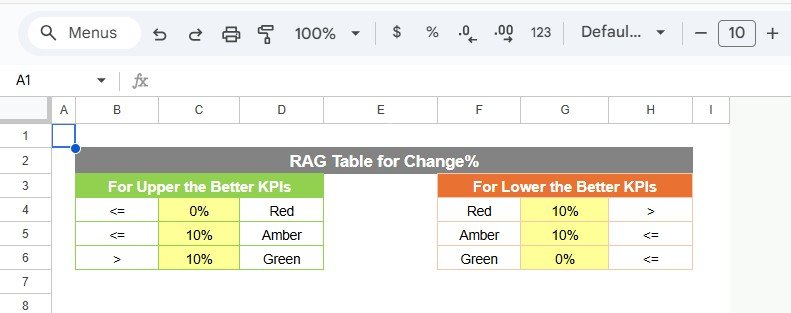
🚦 Traffic Light Indicators (Red/Yellow/Green) – Quick performance visibility
📈 Up/Down Arrows with % Change – Measure improvement instantly
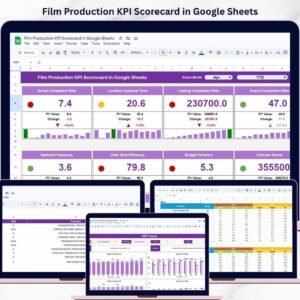
📌 10 Critical KPI Tracking Structure – Production, safety, cost & efficiency
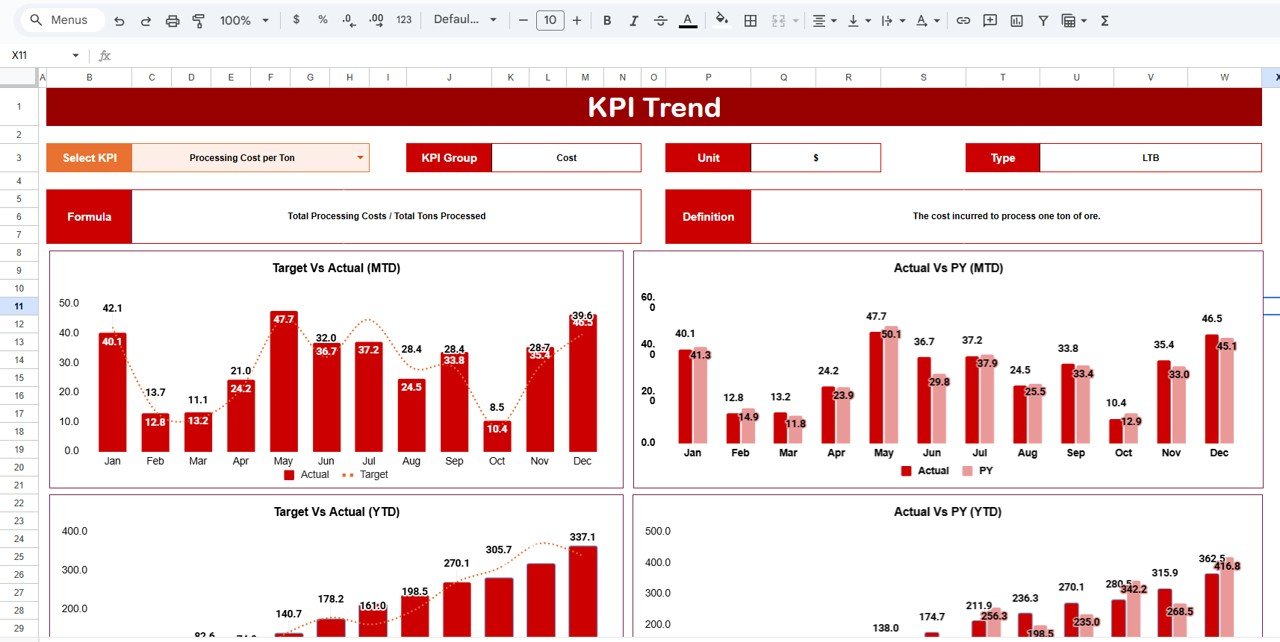
📊 Dedicated KPI Trend Sheet (Cell C3) – Deep KPI analysis
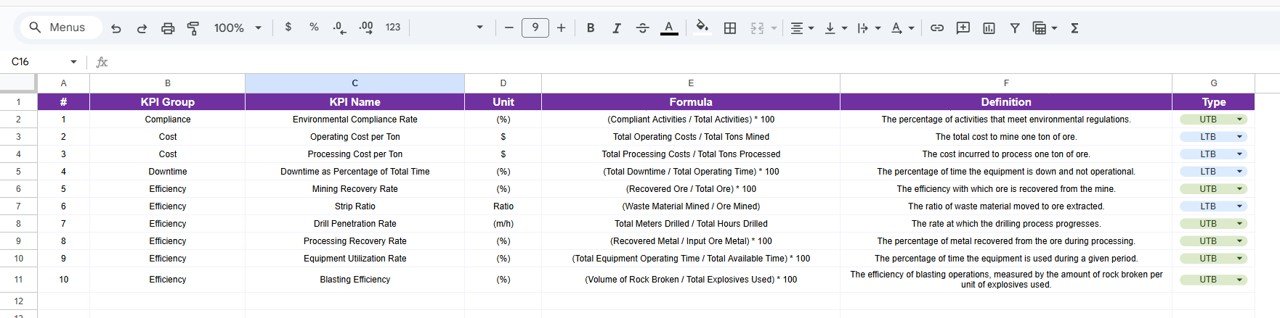
📑 KPI Definition Sheet – Standardized formulas and explanations
🎨 Colour Settings Customization – Control thresholds & benchmarks
🌐 Cloud-Based & Shareable – Accessible anywhere via Google Sheets
Everything is structured, automated, and easy to manage.
📂 What’s Inside the Mining KPI Scorecard in Google Sheets
This professional scorecard includes multiple structured worksheets:
1️⃣ Main Scorecard Sheet
-
Month dropdown at the top
-
Traffic light indicators
-
MTD and YTD toggle view
-
Percentage change from previous period
-
Automatic update when month changes
2️⃣ Trend Sheet
-
KPI dropdown in Cell C3
-
KPI Group, Unit, Type (LTB/UTB)
-
KPI Formula & Definition
-
Trend chart visualization
3️⃣ KPI Definition Sheet
-
KPI Name
-
KPI Group
-
Unit
-
Formula
-
KPI Definition
4️⃣ Data Input Sheet
-
Monthly KPI values
-
Target values
-
Previous period data
-
Yearly cumulative numbers
5️⃣ Colour Settings Sheet
-
Traffic light threshold control
-
Performance benchmark customization
Each sheet serves a clear purpose, ensuring professional and structured KPI monitoring.
⚙️ How to Use the Mining KPI Scorecard in Google Sheets
Using the scorecard is simple:
1️⃣ Enter monthly KPI values in the Data Input Sheet.
2️⃣ Define or update targets as required.
3️⃣ Adjust thresholds in the Colour Settings Sheet (optional).
4️⃣ Select your reporting month from the dropdown at the top of the Scorecard.
That’s it.
The scorecard automatically updates MTD, YTD, performance indicators, traffic lights, and percentage changes. Managers instantly see which KPIs meet targets and which require action.
No complex formulas or technical setup required.
🎯 Who Can Benefit from This Mining KPI Scorecard?
This scorecard is ideal for:
⛏️ Mining Operations Managers
🏗️ Production Supervisors
⚙️ Maintenance Teams
🛢 Fuel & Cost Control Managers
🦺 Safety Officers
📊 Performance & Strategy Teams
💰 Financial Controllers
Whether you manage a small site or a multi-location mining operation, this scorecard adapts easily.
You can track KPIs such as:
-
Production Volume per Month
-
Cost per Ton
-
Equipment Utilization Rate
-
Downtime Hours
-
Fuel Efficiency
-
Safety Incident Rate
-
Lost Time Injury Frequency
-
Maintenance Compliance %
-
Ore Recovery Rate
-
Labor Productivity
Because it supports both Lower the Better (LTB) and Upper the Better (UTB) KPIs, you can track any operational metric efficiently.
With traffic light visualization and automated updates, leaders gain clarity in seconds — not hours.
This is more than a spreadsheet. It’s a performance control system for mining excellence.
📖 Click here to read the Detailed blog post
Watch the step-by-step video tutorial: