Brewing great beer is an art.
Running a profitable microbrewery is a science. 🍺📊
You carefully select ingredients. You perfect fermentation. You craft unique flavors. However, if you are not tracking production efficiency, wastage, sales growth, and margins every month, profits can quietly slip away.
That is why you need structured visibility.
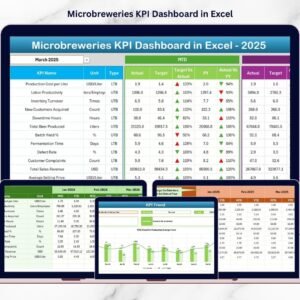
The Microbreweries KPI Dashboard in Excel gives you complete operational and financial clarity in one powerful, ready-to-use workbook. Instead of relying on scattered spreadsheets, notebooks, or accounting reports, you monitor all critical KPIs in a centralized system.
From production volume to gross margin — everything becomes measurable, comparable, and actionable.
Key Feature of Microbreweries KPI Dashboard in Excel 🍺
This professional Excel dashboard is built specifically for craft breweries and microbreweries.
It includes:
✅ Month Selection Dropdown (Cell D3) – Analyze any month instantly
✅ MTD & YTD Tracking – Monitor short-term and long-term performance
✅ Actual vs Target Comparison – Measure accountability clearly
✅ Previous Year Comparison – Track real business growth
✅ Conditional Formatting Arrows – Visual performance indicators
✅ Detailed KPI Trend Charts – Analyze patterns and seasonality
✅ Structured KPI Definition Sheet – Maintain clarity and consistency
✅ 7 Organized Worksheets – Professional, easy navigation
Because it runs in Excel, you can customize everything according to your brewing model.
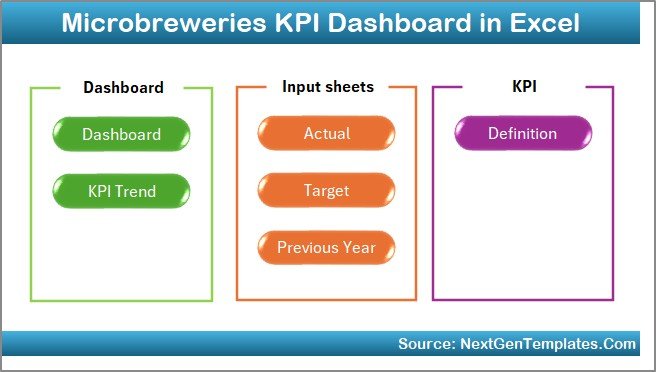
What’s Inside the Microbreweries KPI Dashboard in Excel 📁
You receive a fully structured Excel workbook with 7 powerful worksheets.
🏠 1️⃣ Home Sheet – Navigation Center
This sheet works as your index page.
It includes 6 interactive buttons that help you jump directly to any sheet.
You save time, avoid confusion, and maintain a clean workflow.
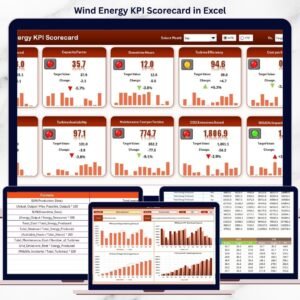
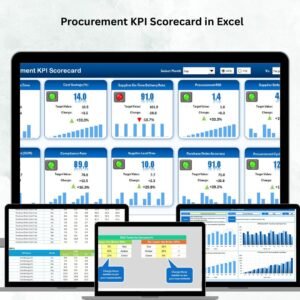
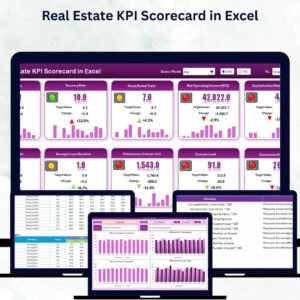
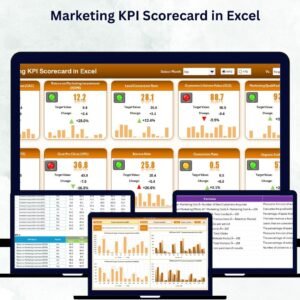
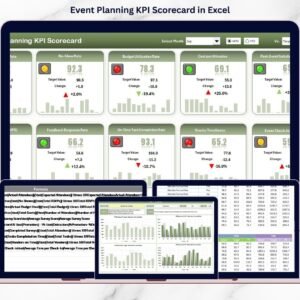
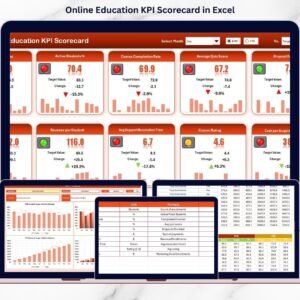
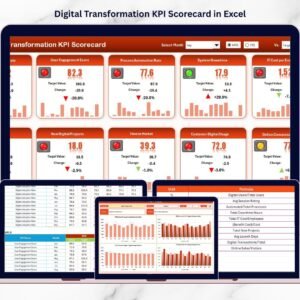
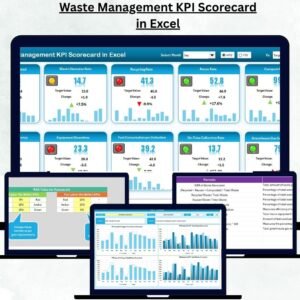
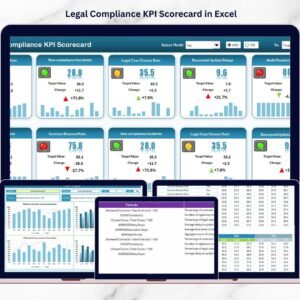
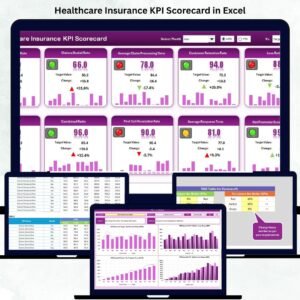
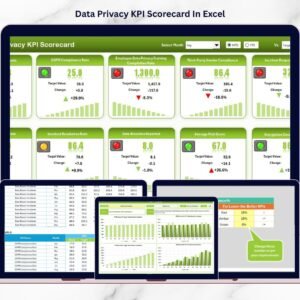
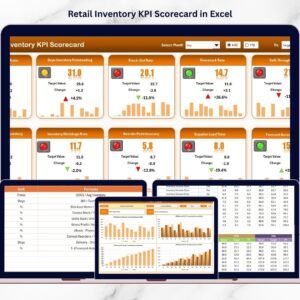
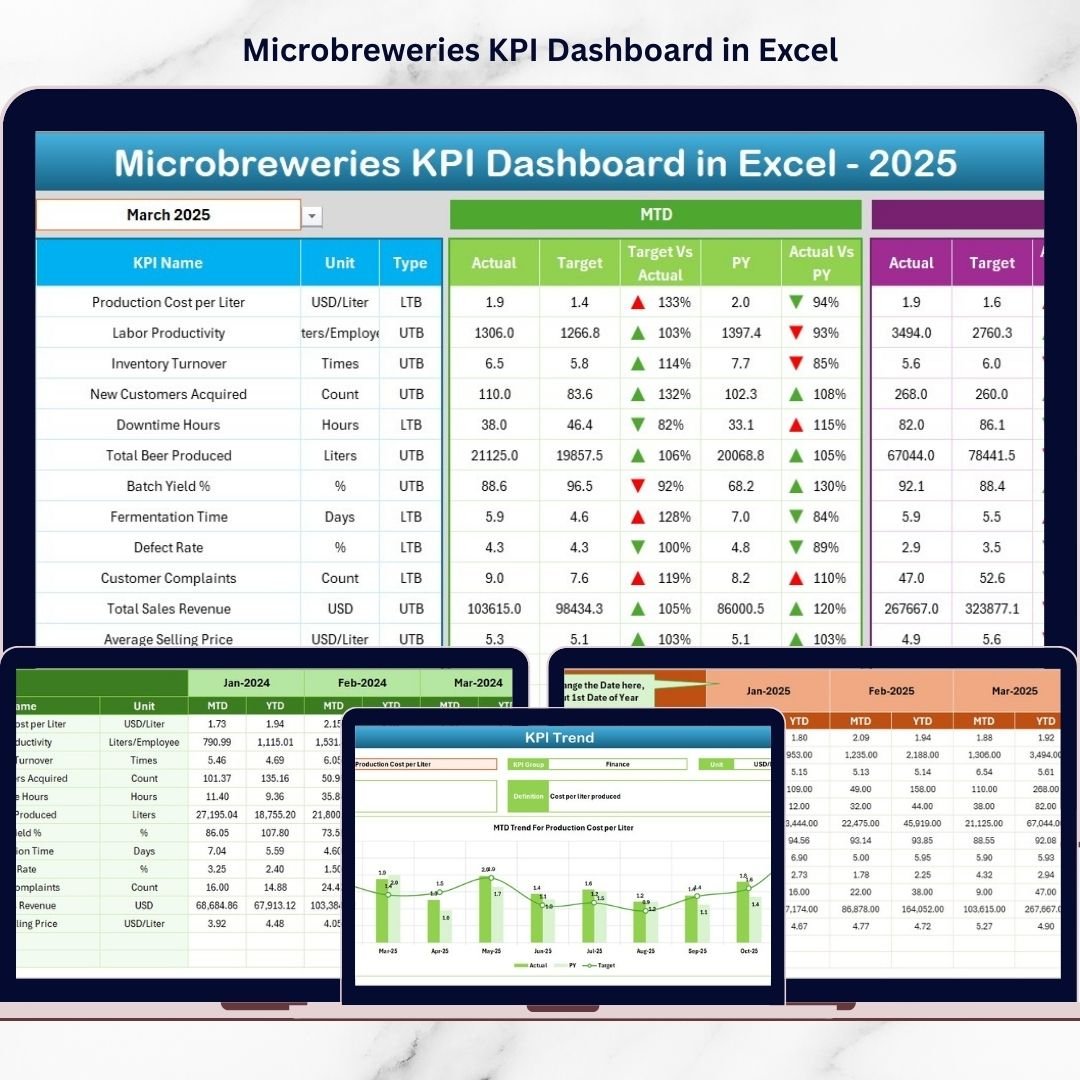
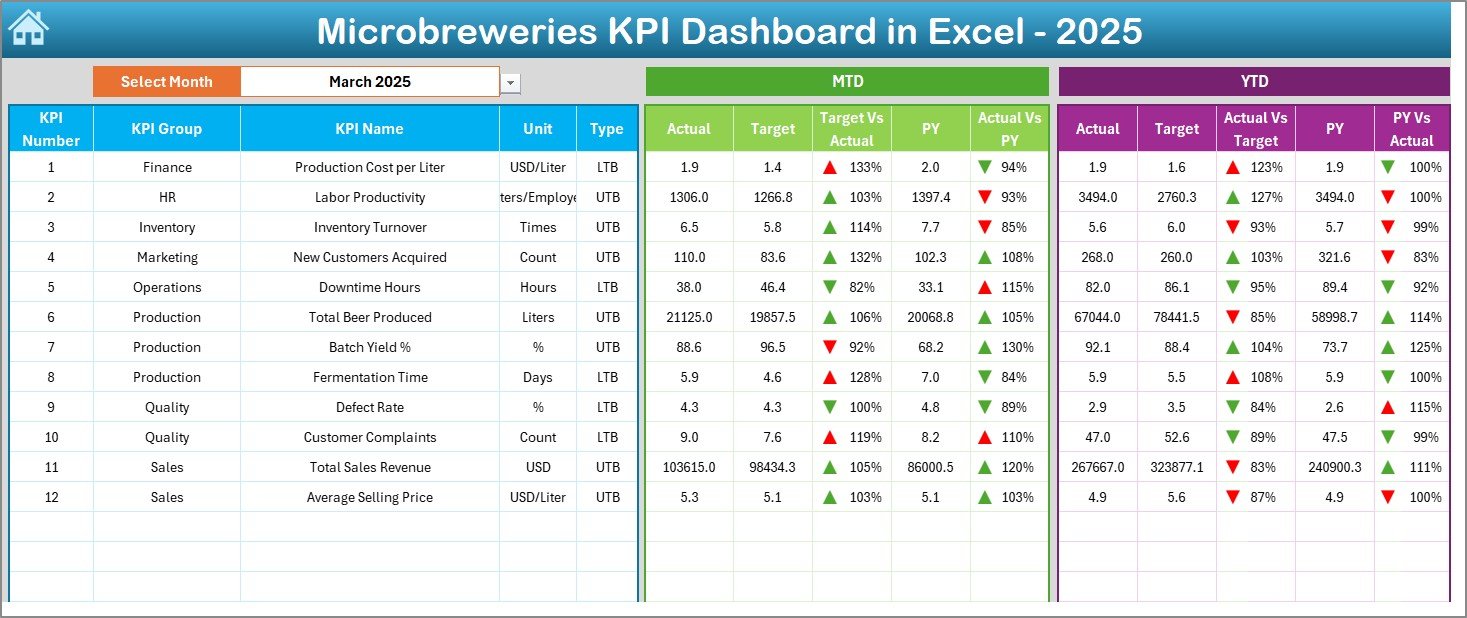
📊 2️⃣ Dashboard Sheet – Main Performance Overview
This is the heart of the dashboard.
🔹 Select Month from Cell D3
As soon as you select a month:
-
All KPI numbers update automatically
-
All comparisons refresh instantly
-
All performance arrows change dynamically
You can view:
MTD Section:
-
Actual
-
Target
-
Previous Year
-
Target vs Actual %
-
PY vs Actual %
YTD Section:
-
Actual
-
Target
-
Previous Year
-
Target vs Actual %
-
PY vs Actual %
Up arrows highlight improvement.
Down arrows signal underperformance.
Within seconds, you know where your brewery stands.
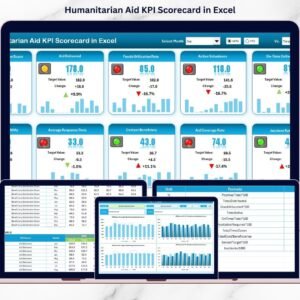
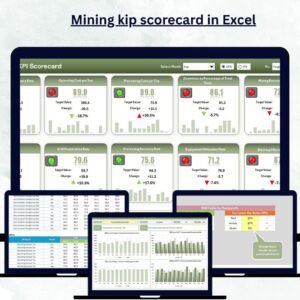
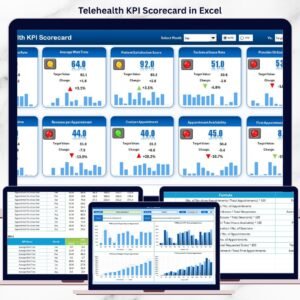
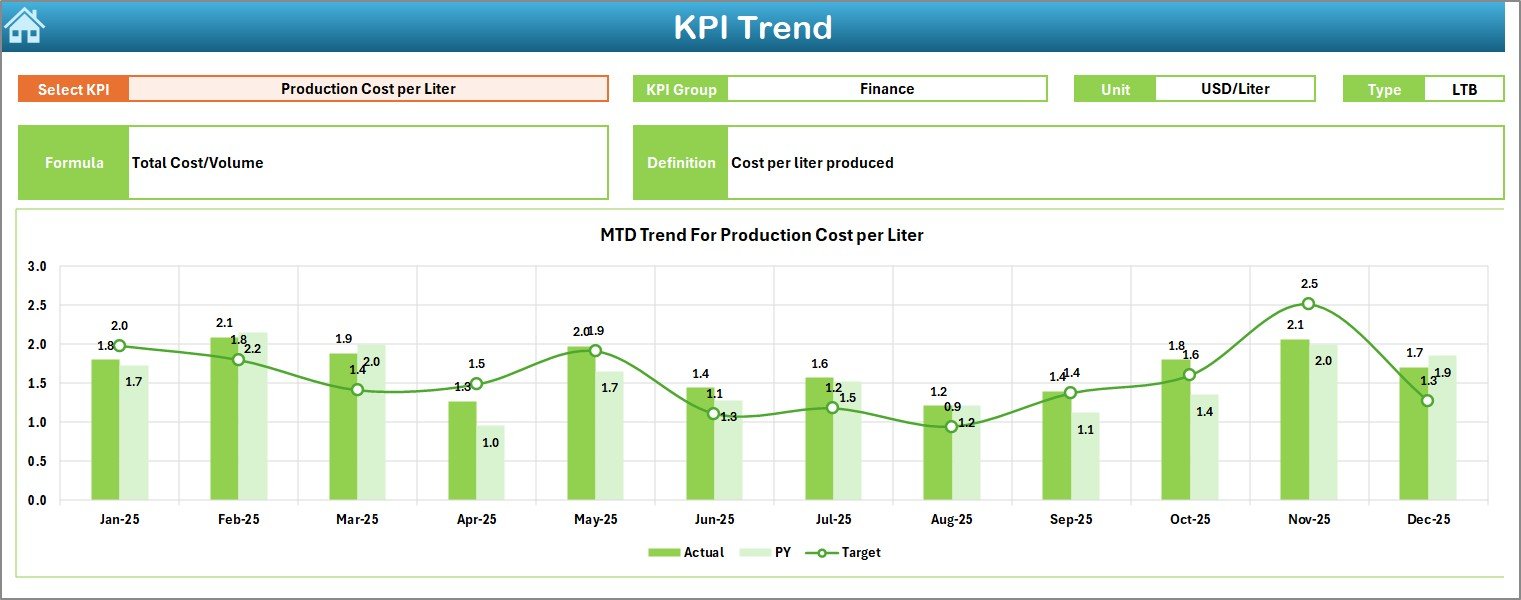
📈 3️⃣ KPI Trend Sheet – Deep KPI Analysis
Select any KPI from dropdown (Cell C3).
Instantly view:
-
KPI Group
-
Unit
-
Type (Lower the Better / Upper the Better)
-
Formula
-
Definition
Plus two powerful charts:
📊 MTD Trend (Actual vs Target vs PY)
📊 YTD Trend (Actual vs Target vs PY)
This helps you detect:
-
Seasonal demand patterns
-
Yield decline trends
-
Rising ingredient costs
-
Margin fluctuations
You stop reacting to numbers — you start anticipating trends.
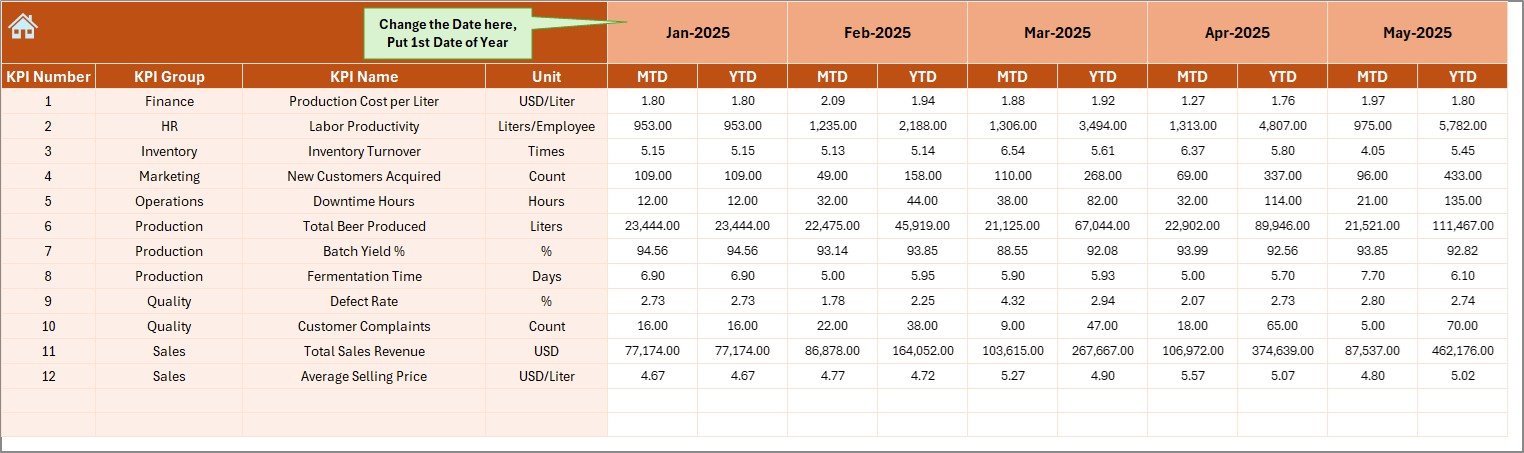
📝 4️⃣ Actual Numbers Input Sheet
Enter:
-
Monthly MTD data
-
Monthly YTD data
Set first month in Cell E1.
The dashboard connects automatically.
No manual calculations required.
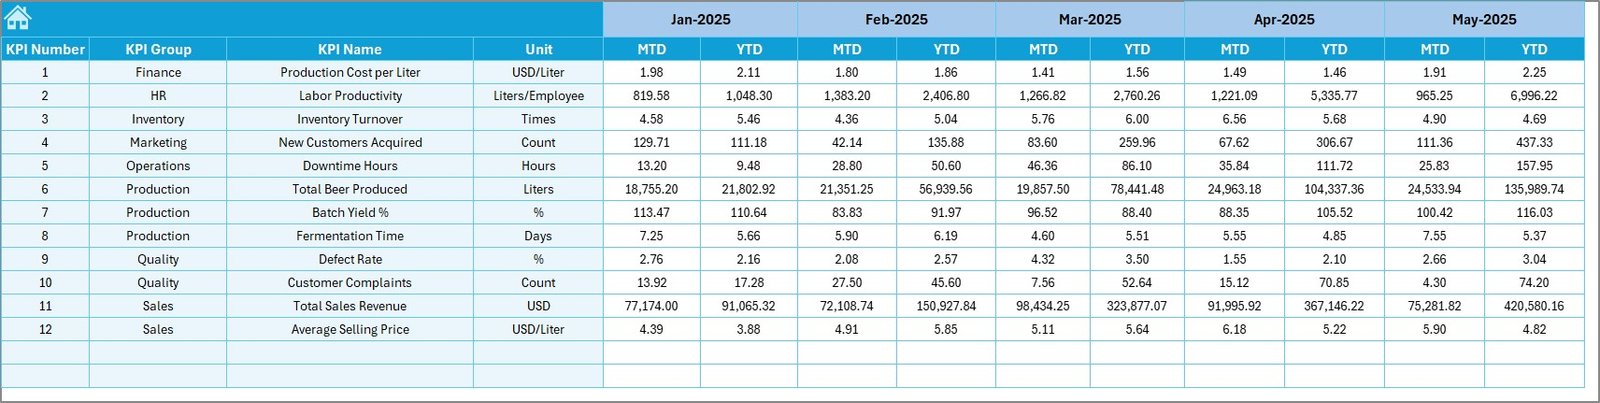
🎯 5️⃣ Target Sheet
Define:
-
Monthly MTD targets
-
Monthly YTD targets
Clear targets create measurable accountability for:
-
Production efficiency
-
Cost control
-
Revenue growth
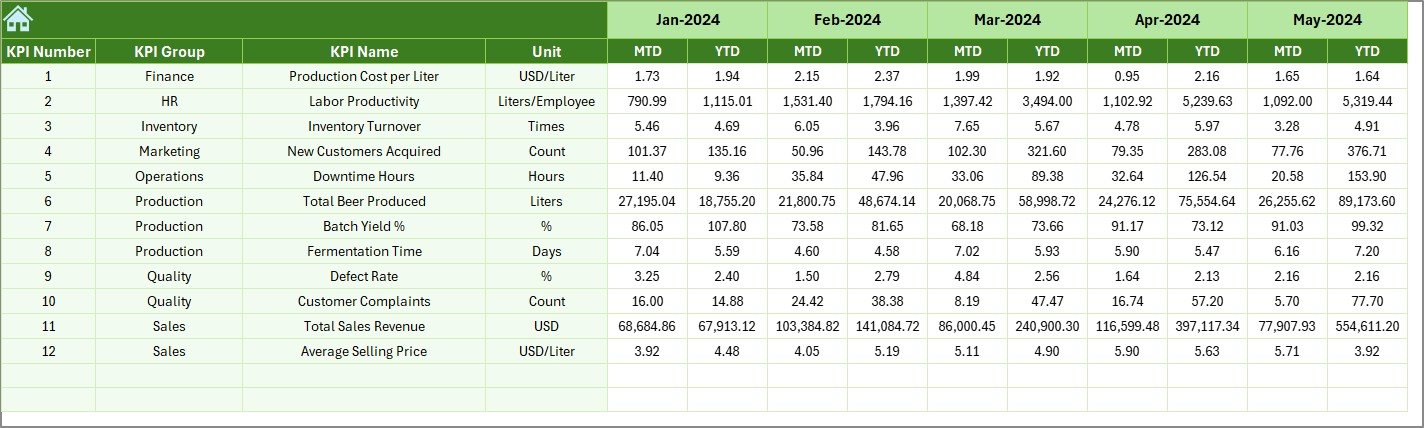
📅 6️⃣ Previous Year Numbers Sheet
Enter last year’s data.
This allows you to:
-
Measure growth
-
Analyze improvement
-
Compare marketing effectiveness
-
Evaluate operational progress
Growth tracking becomes simple and structured.
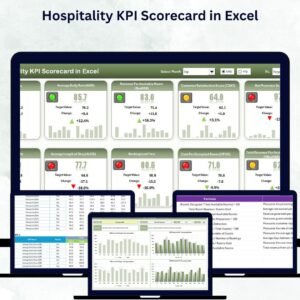
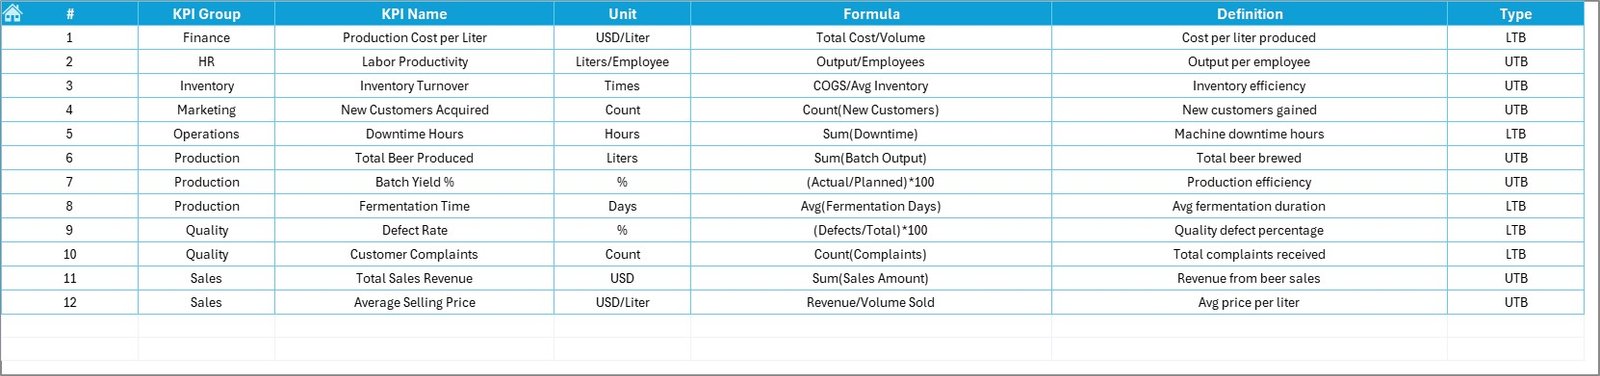
📘 7️⃣ KPI Definition Sheet
This sheet standardizes all KPIs:
-
KPI Name
-
KPI Group
-
Unit
-
Formula
-
Definition
It ensures clarity across:
-
Brewmasters
-
Production teams
-
Finance managers
-
Sales teams
Everyone works with the same definitions.
Who Can Benefit from This Dashboard 👥
This dashboard is ideal for:
✔ Microbrewery Owners
✔ Brewmasters
✔ Production Managers
✔ Finance Managers
✔ Craft Brewery Consultants
✔ Taproom Managers
Whether you run a small local brewery or a growing craft brand, this tool supports data-driven expansion.
How This Dashboard Improves Profitability 💰
When you track KPIs consistently:
🔹 You reduce brewing loss
🔹 You optimize ingredient cost
🔹 You improve fermentation efficiency
🔹 You monitor high-margin SKUs
🔹 You detect slow-moving products
🔹 You control utility and overhead expenses
Small improvements in yield and cost control significantly impact your bottom line.
Instead of guessing, you manage with clarity.
Brew Smarter, Grow Faster 🚀
Passion creates great beer.
Data builds great business.
The Microbreweries KPI Dashboard in Excel helps you:
📊 Monitor production
📈 Track sales growth
🎯 Control targets
📅 Compare performance
📉 Reduce waste
💰 Increase profitability
If you want structured performance monitoring without complex software, this Excel dashboard delivers simplicity, clarity, and control.
Click here to read the Detailed blog post
Visit our YouTube channel to learn step-by-step video tutorials
👉 https://youtube.com/@PKAnExcelExpert