Marketing teams spend heavily on campaigns, channels, and managers—but without a clear comparison between spend and revenue, budgets quickly spiral while returns remain unclear. Separate reports, manual calculations, and delayed reviews make it difficult to know what truly works. As a result, businesses overspend on low-performing initiatives and miss opportunities to scale winning strategies.Marketing Spend and Revenue Dashboard in Google Sheets
That is exactly why the Marketing Spend and Revenue Dashboard in Google Sheets is a game-changing solution.
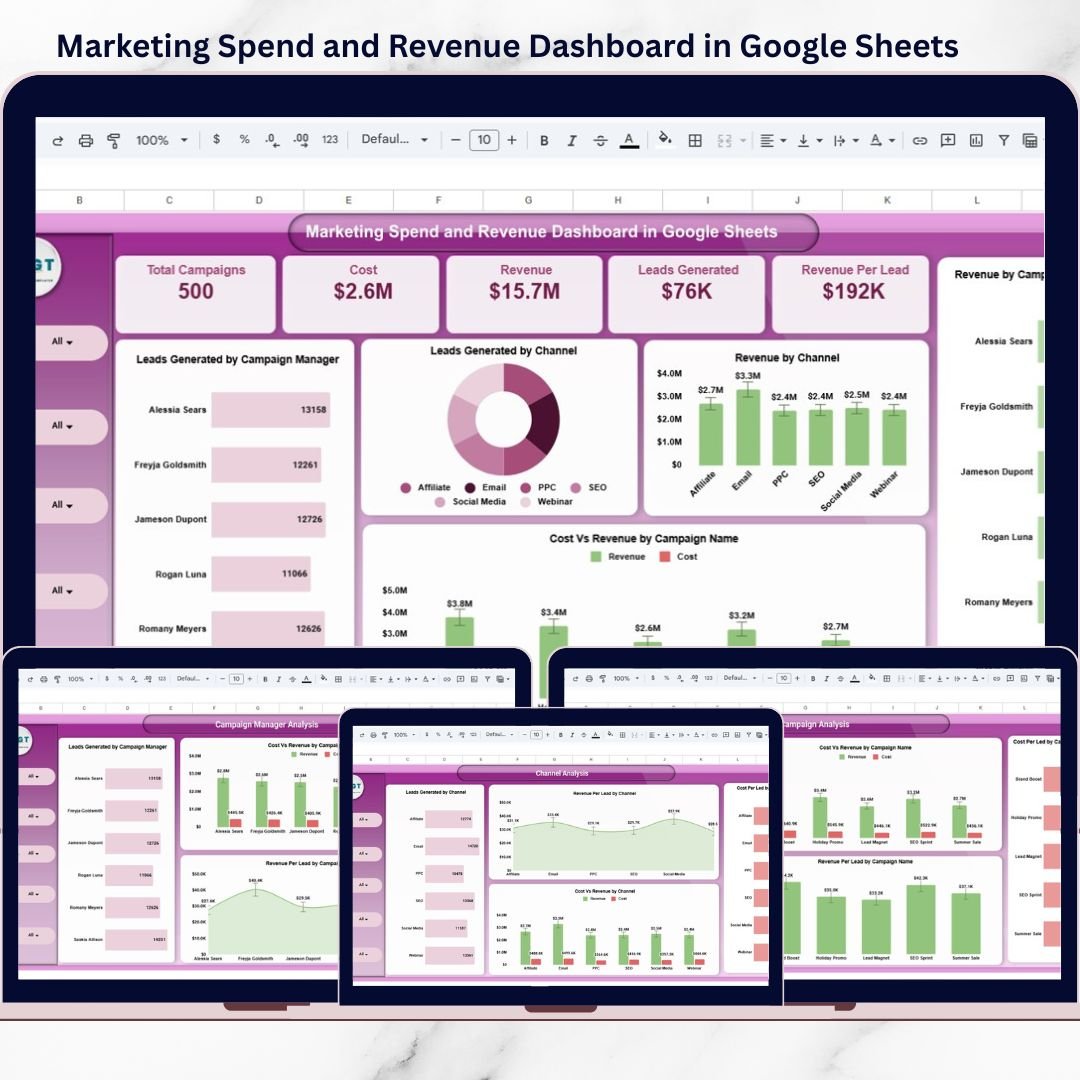
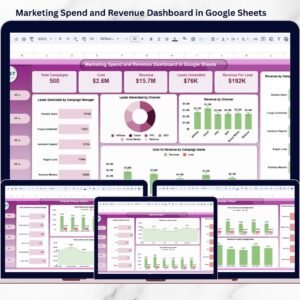
This ready-to-use Google Sheets dashboard gives you a single, centralized view of marketing cost, revenue, leads, cost per lead, revenue per lead, and ROI. Instead of working with raw tables, the dashboard transforms your data into clear KPI cards, visual comparisons, and trend analysis—so decisions are faster, smarter, and data-driven.
Because it is built entirely in Google Sheets, the dashboard is cloud-based, easy to share, simple to update, and perfect for collaboration across teams.Marketing Spend and Revenue Dashboard in Google Sheets
## 🚀 Key Features of Marketing Spend and Revenue Dashboard in Google Sheets
💰 Marketing Cost vs Revenue Tracking
Instantly compare spend and revenue across campaigns, channels, and managers.
📊 Lead Efficiency Metrics
Track cost per lead and revenue per lead to understand true campaign effectiveness.
📣 Campaign-Level Performance Analysis
Identify top-performing and underperforming campaigns quickly.
👤 Campaign Manager Performance Insights
Measure how each manager contributes to leads, revenue, and ROI.
📢 Channel-Wise Efficiency Comparison
Analyze Affiliate, Email, PPC, SEO, Social Media, Webinar, and more.
📆 Monthly Performance Trends
Spot seasonal patterns and spending inefficiencies over time.
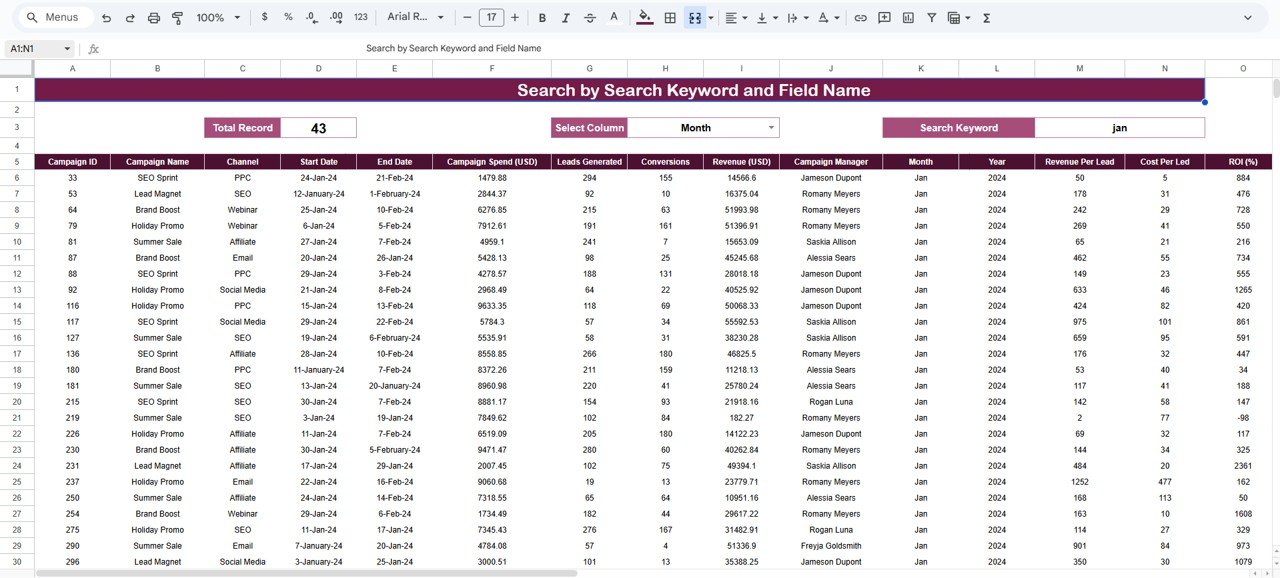
🔍 Searchable Campaign Data Table
Drill down into individual campaign details instantly.
☁️ 100% Google Sheets Based
No software installation—easy sharing and real-time collaboration.
## 📦 What’s Inside the Marketing Spend and Revenue Dashboard
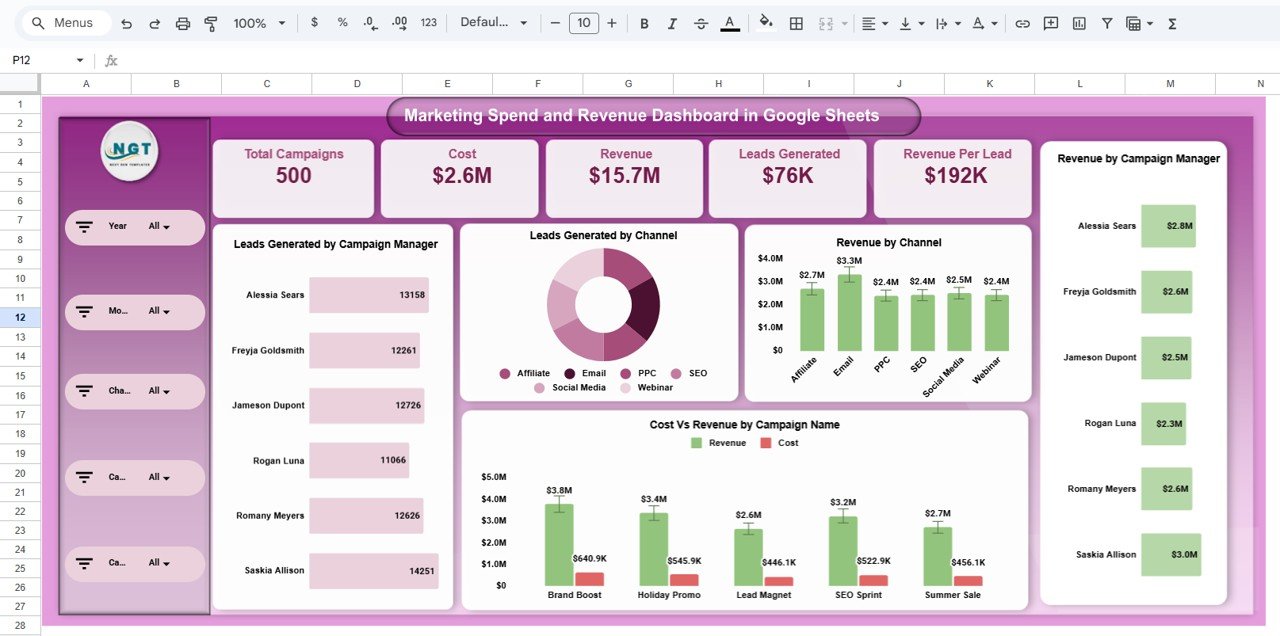
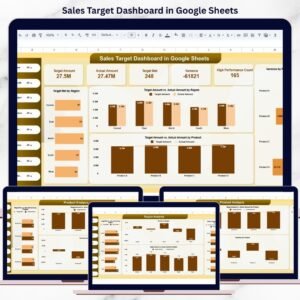
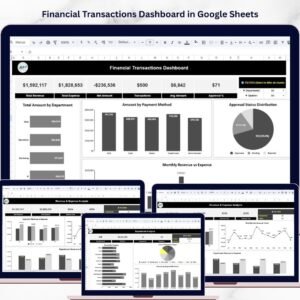
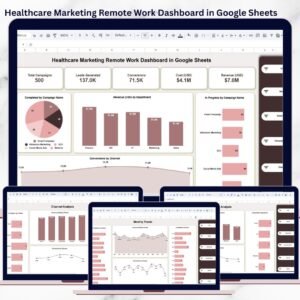
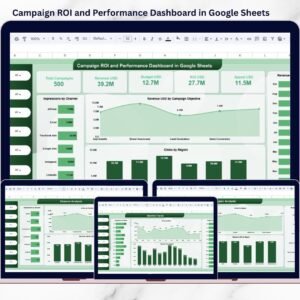
📄 Overview Page
High-level KPIs such as total campaigns, total cost, total revenue, leads generated, and revenue per lead.
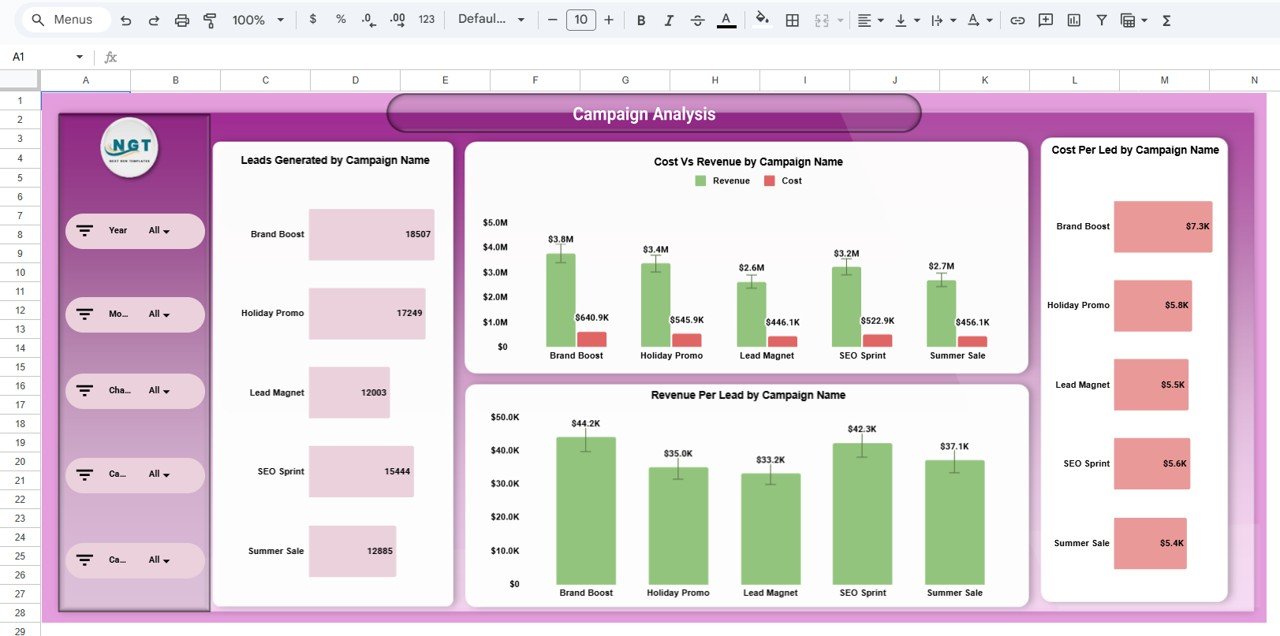
📣 Campaign Analysis Page
Compare cost vs revenue, leads, cost per lead, and revenue per lead by campaign name.
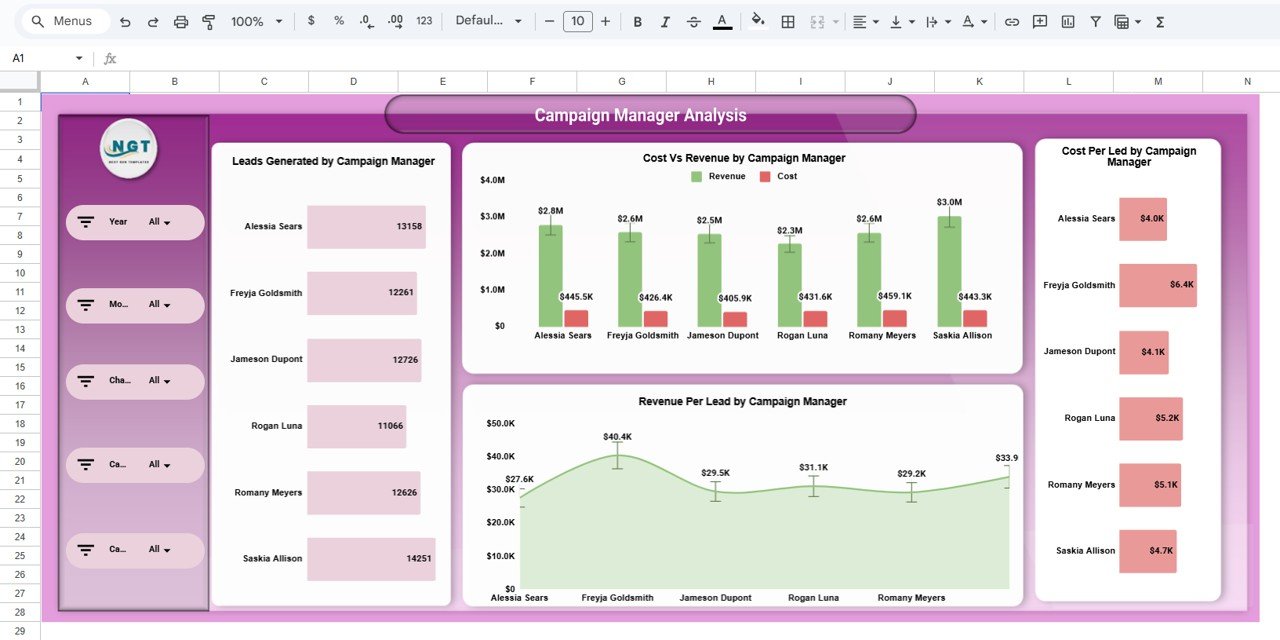
👤 Campaign Manager Analysis Page
Evaluate marketing performance and accountability by campaign owner.
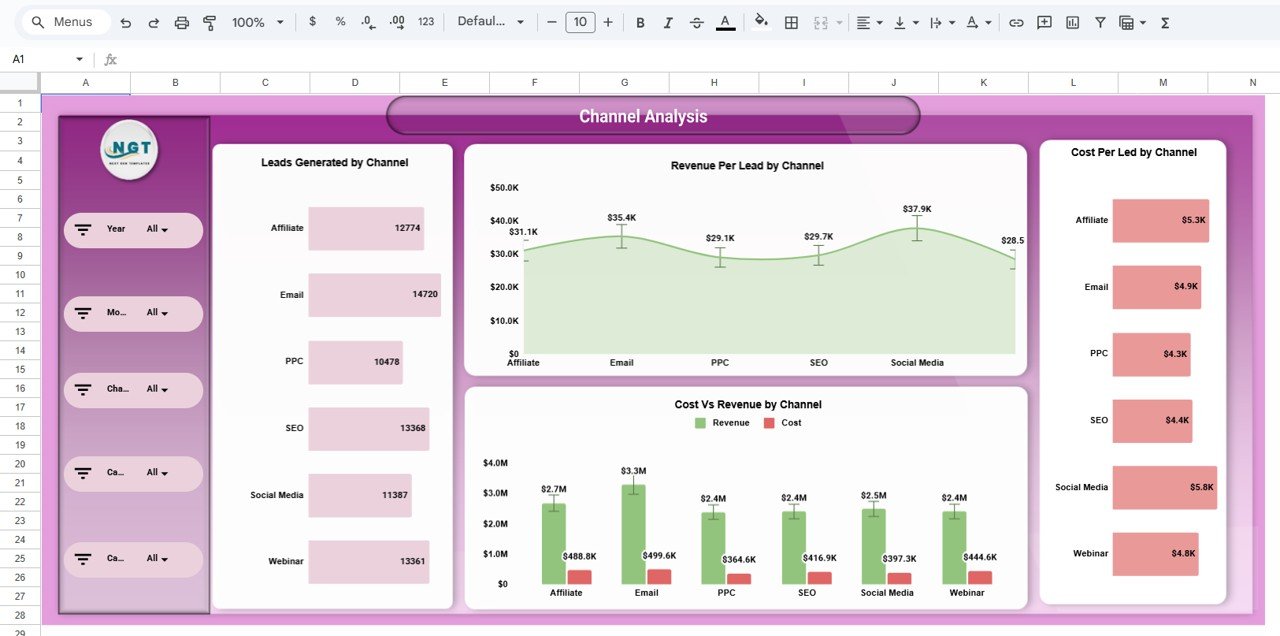
📢 Channel Analysis Page
Compare efficiency across marketing channels to identify high-ROI platforms.
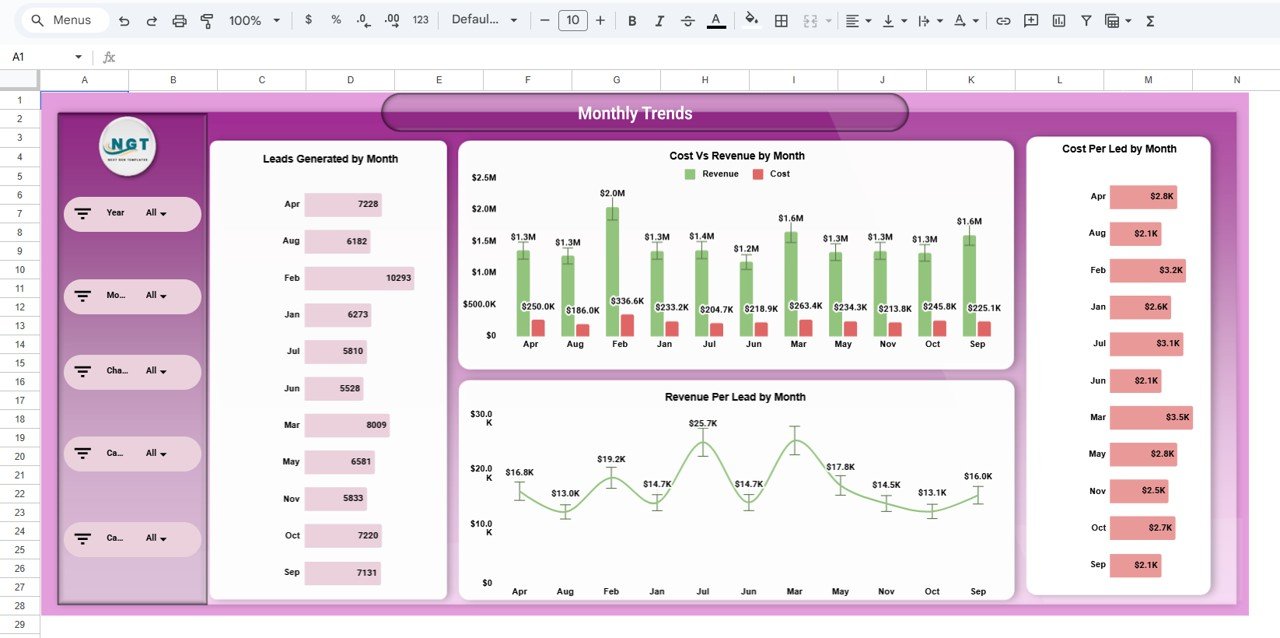
📆 Monthly Trends Page
Track how spend, revenue, and lead efficiency change month by month.
📋 Detailed Data Table View
Campaign-level visibility with search and column-based filtering.
## 🛠️ How to Use the Marketing Spend and Revenue Dashboard
1️⃣ Enter or paste marketing data into the raw data table
2️⃣ KPI cards and charts update automatically
3️⃣ Use slicers to filter by campaign, channel, manager, month, or year
4️⃣ Compare spend vs revenue and analyze lead efficiency
5️⃣ Share the dashboard with stakeholders for real-time insights
No advanced Google Sheets knowledge required—the dashboard is beginner-friendly and ready to use.
## 🎯 Who Can Benefit from This Marketing Spend and Revenue Dashboard
📊 Marketing Managers controlling budgets
🚀 Digital & Performance Marketing Teams
📈 Growth Teams optimizing ROI
🏢 Marketing Agencies managing multiple campaigns
💼 Business Owners & Founders
🌱 Startups and Enterprises
This dashboard is ideal for anyone who wants full visibility, cost control, and revenue-focused marketing decisions.


Reviews
There are no reviews yet.