
Marketing budgets are growing every year, but many businesses still struggle to answer one simple question: Are our marketing campaigns actually profitable? Without a clear ROI measurement system, teams often spend money without knowing which channels, regions, or campaigns truly deliver results.
That is exactly why the Marketing ROI Dashboard in Power BI is a must-have analytics solution for modern marketing teams 📊.
This ready-to-use Power BI dashboard helps you track marketing performance, measure ROI accurately, control budgets, and make confident data-driven decisions. Instead of working with scattered spreadsheets or static reports, you get one centralized, interactive dashboard that tells the complete story of your marketing investments.
Because the dashboard is built in Power BI, it delivers dynamic visuals, slicers, KPI cards, and drill-down insights that allow you to analyze performance from multiple angles in just a few clicks.
## 🚀 Key Features of Marketing ROI Dashboard in Power BI
✅ Interactive slicers to analyze data by campaign, channel, region, and time period
✅ KPI cards for instant visibility into total campaigns, budget, spend, and revenue
✅ ROI-focused metrics including ROI, CTR, impressions, clicks, and conversions
✅ Channel-level, region-level, and campaign objective analysis
✅ Monthly trend analysis for budget, spend, and engagement tracking
✅ Clean, professional, and management-ready dashboard layout
✅ Easy integration with Excel and other data sources
This dashboard transforms raw marketing data into actionable insights that leadership teams can trust.
## 📦 What’s Inside the Marketing ROI Dashboard
When you download this product, you receive a fully designed Power BI dashboard with multiple analysis pages, including:
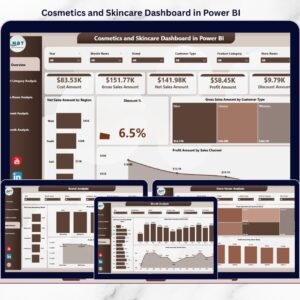
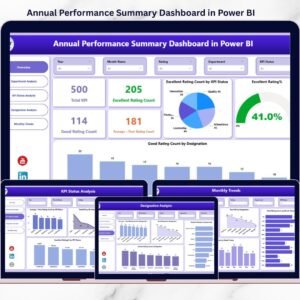
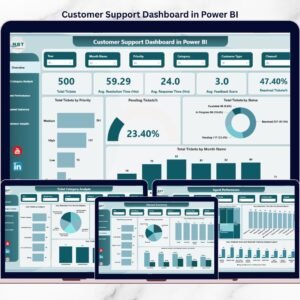
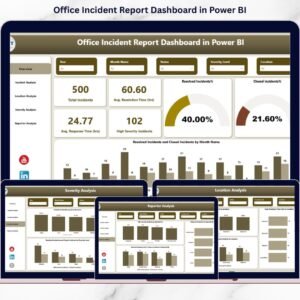
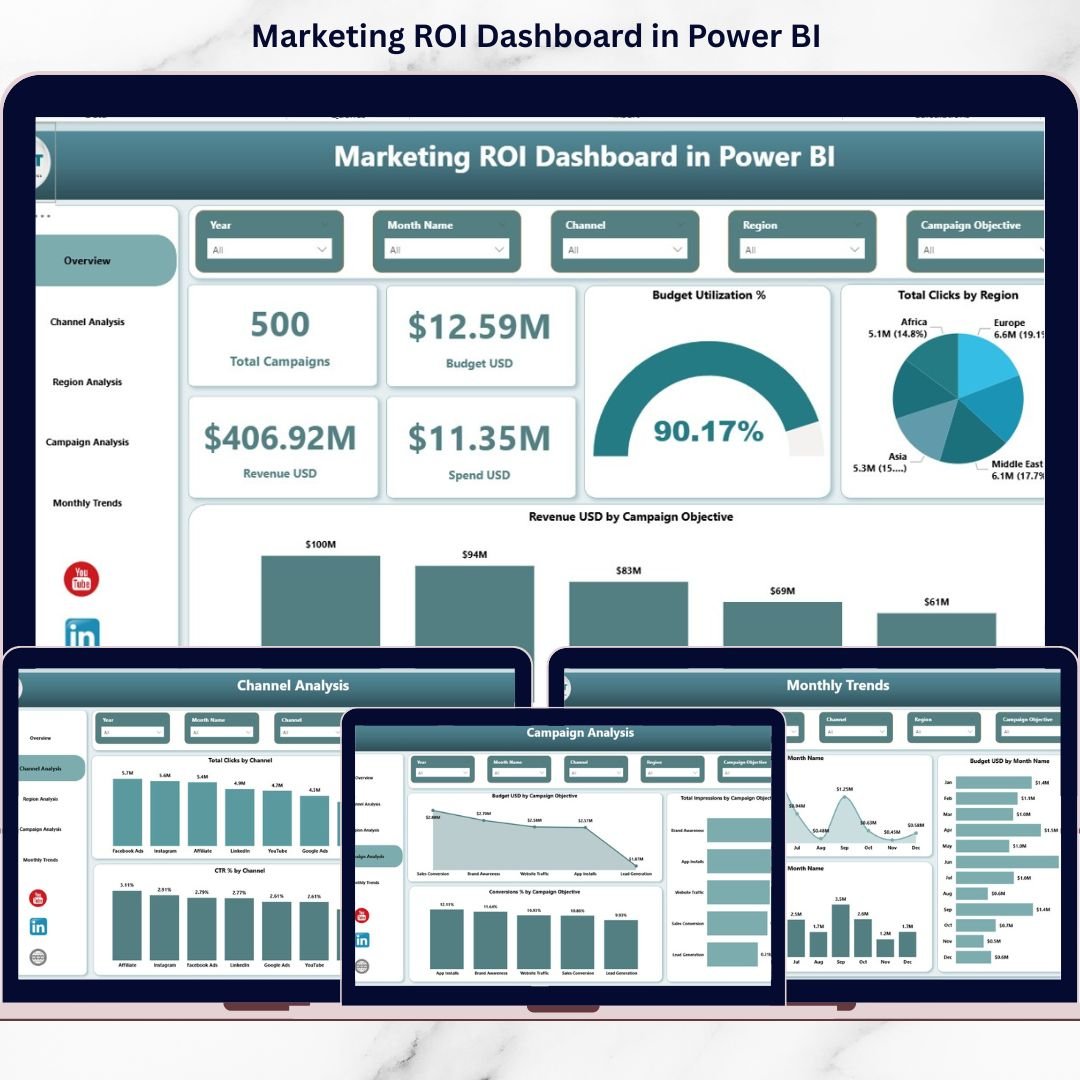
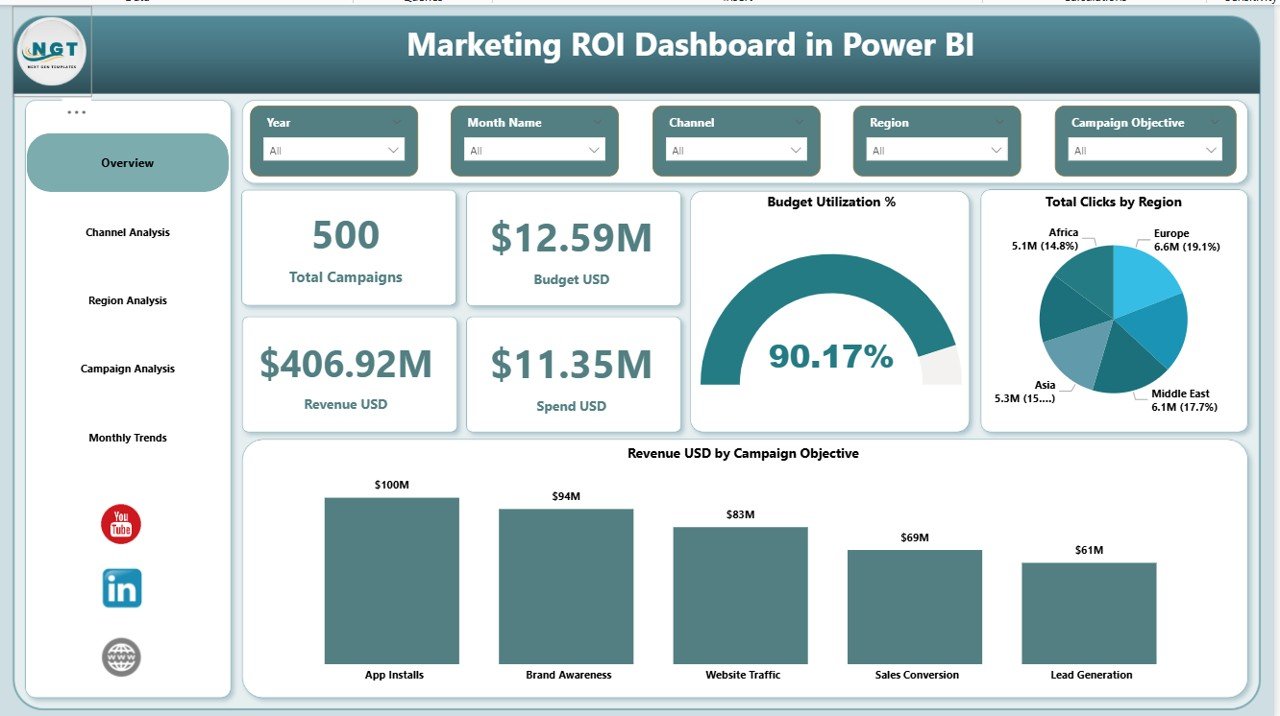
📌 Overview Page – A complete snapshot of overall marketing performance with KPI cards and summary visuals
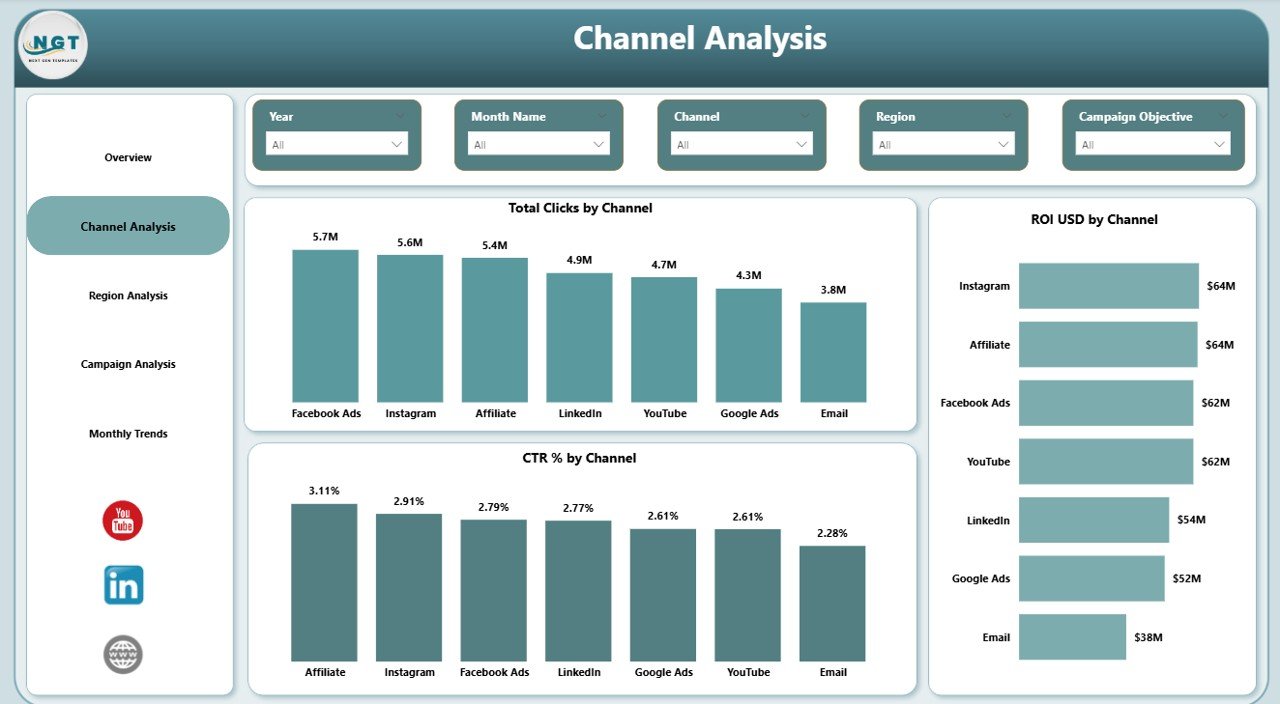
📌 Channel Analysis Page – Compare clicks, ROI, and CTR across marketing channels
📌 Region Analysis Page – Analyze budgets, impressions, and conversions by region
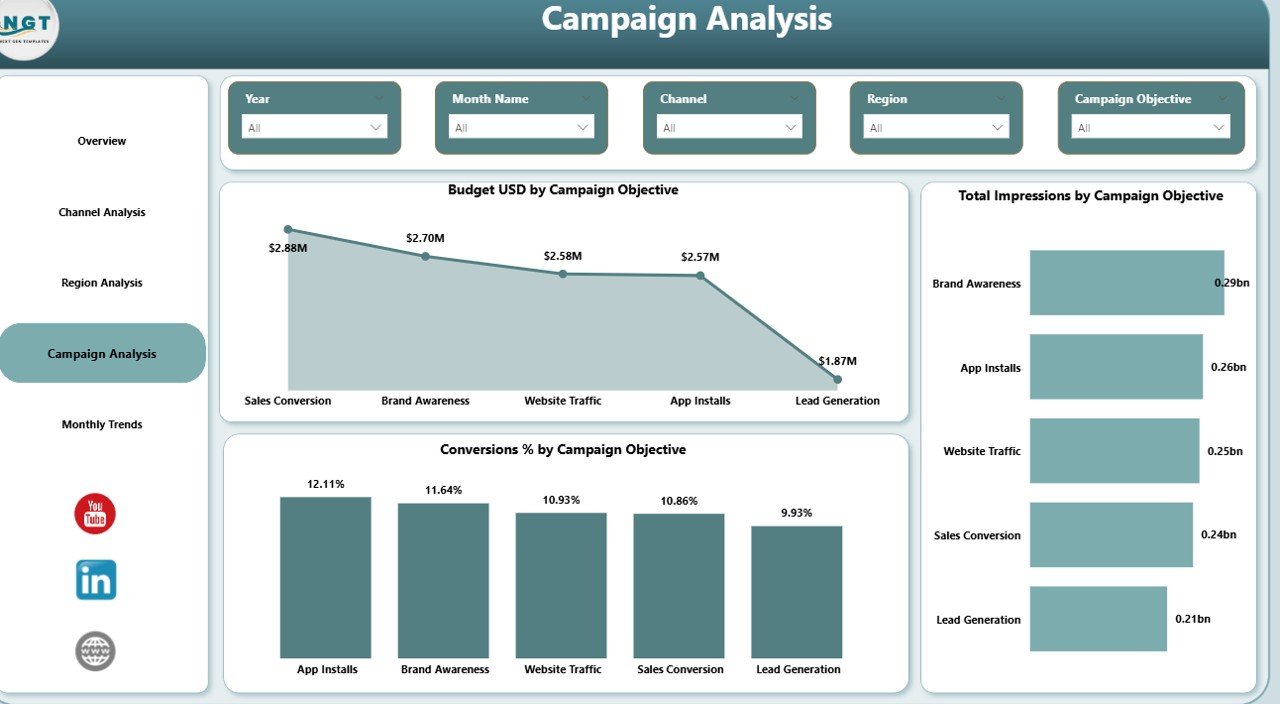
📌 Campaign Analysis Page – Evaluate performance by campaign objectives
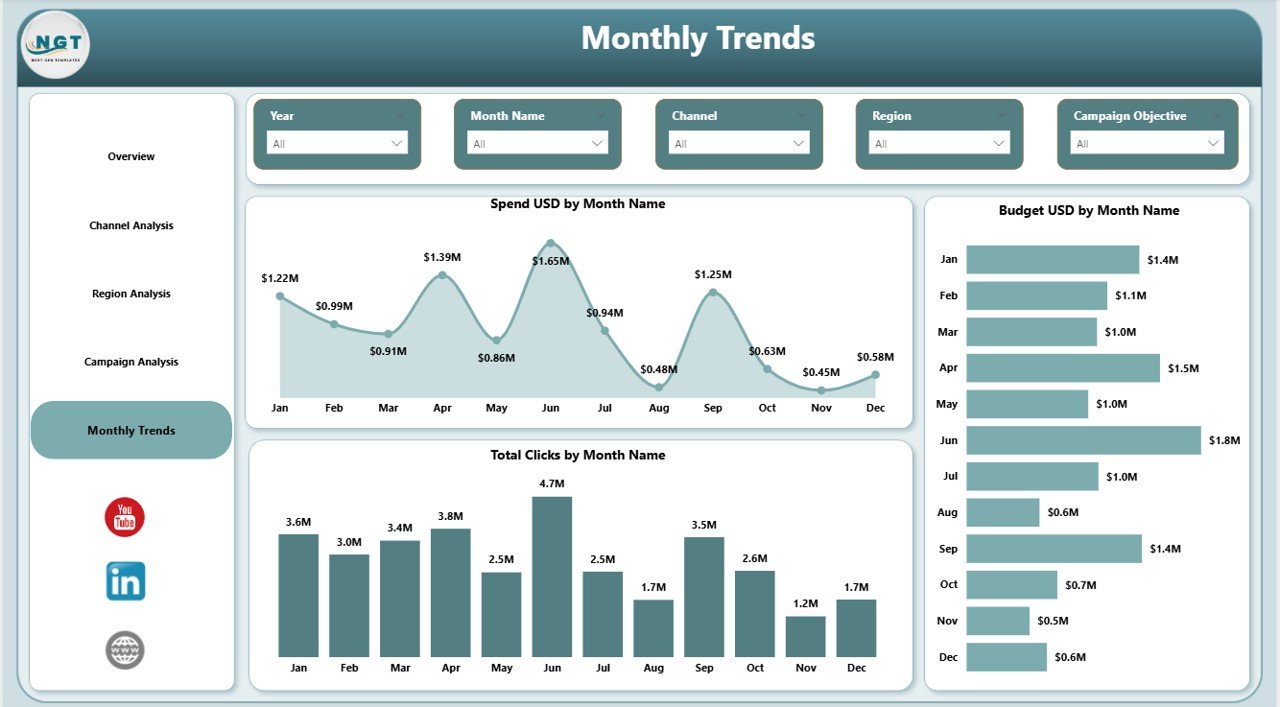
📌 Monthly Trends Page – Track spending, budgets, and clicks over time
Each page is fully interactive and updates instantly based on slicer selections.
## 🛠️ How to Use the Marketing ROI Dashboard
Using the Marketing ROI Dashboard in Power BI is simple and user-friendly:
1️⃣ Enter or connect your marketing data using Excel or supported sources
2️⃣ Refresh the Power BI dashboard
3️⃣ Use slicers to filter by campaign, channel, region, or month
4️⃣ Review KPI cards and visuals to identify trends and gaps
5️⃣ Make informed decisions to optimize marketing performance
No coding or advanced technical skills are required. The dashboard is designed for both technical and non-technical users.
## 🎯 Who Can Benefit from This Marketing ROI Dashboard
This dashboard is ideal for:
🎯 Marketing Managers tracking campaign performance
🎯 Digital Marketing Teams optimizing channel ROI
🎯 Business Owners monitoring marketing effectiveness
🎯 Marketing Analysts building data-driven insights
🎯 Executives reviewing marketing ROI at a glance
🎯 Agencies managing multiple campaigns and clients
If your goal is to maximize returns and reduce wasted marketing spend, this dashboard is built for you.
Click here to read the Detailed Blog Post
Watch the step-by-step video tutorial: