Marketing teams spend heavily across channels, regions, and campaigns to drive growth. But without a clear link between spend and revenue, it becomes almost impossible prevent wasted budgets. Many organizations still depend on fragmented reports from ad platforms and finance sheets, which hide true ROI and slow decision-making.
That is exactly why the Marketing ROI Dashboard in Google Sheets becomes an essential performance analytics tool.
This ready-to-use dashboard converts raw campaign data into a structured, visual, and insight-driven reporting system. It helps marketing teams, growth managers, and leadership track budget, spend, revenue, and return on investment in one centralized Google Sheets dashboard. Instead of guessing which campaigns work, you gain clear answers backed by data.
Because the dashboard is built entirely in Google Sheets, it offers real-time updates, easy collaboration, automatic calculations, and cloud-based access—without the need for expensive BI or marketing software.
✨ Key Features of the Marketing ROI Dashboard in Google Sheets
📊 1. Centralized ROI Tracking
Track marketing performance across all campaigns, channels, and regions in one dashboard—no more switching between tools.
💰 2. Clear Spend vs Revenue Visibility
Instantly compare budget, actual spend, and revenue to understand true marketing ROI.
📈 3. Multi-Dimensional Performance Analysis
Analyze performance by channel, region, campaign objective, and month for deeper insights.
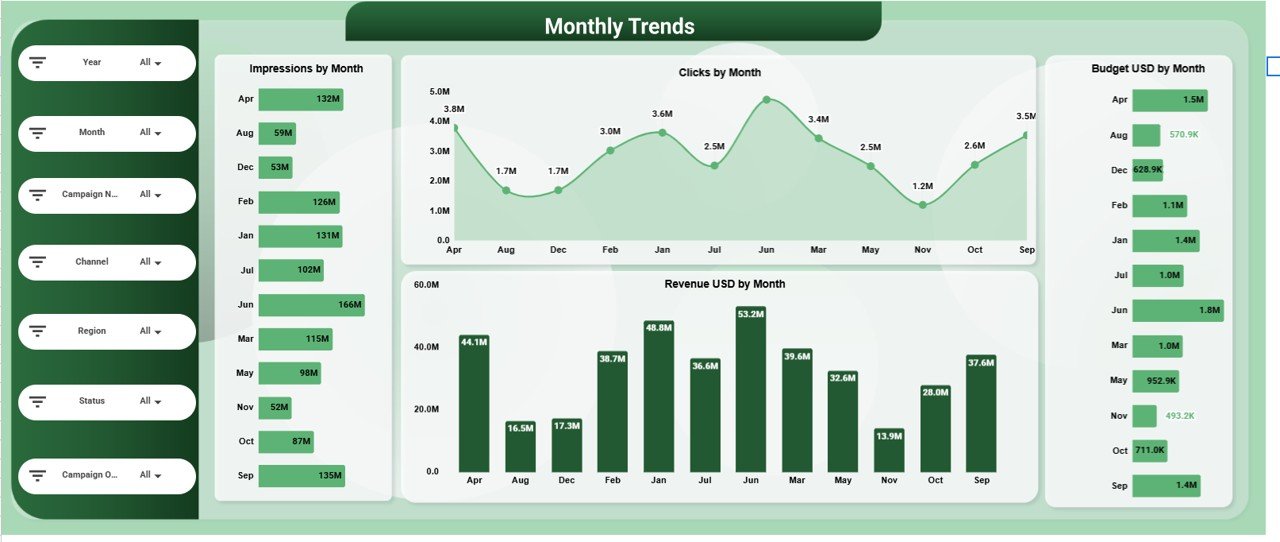
📅 4. Monthly Trend Monitoring
Track impressions, clicks, spend, and revenue trends over time to spot seasonality and campaign timing impact.
🤝 5. Google Sheets-Based Collaboration
Marketing, finance, and leadership teams can work together in real time with controlled access.
📦 What’s Inside the Marketing ROI Dashboard in Google Sheets
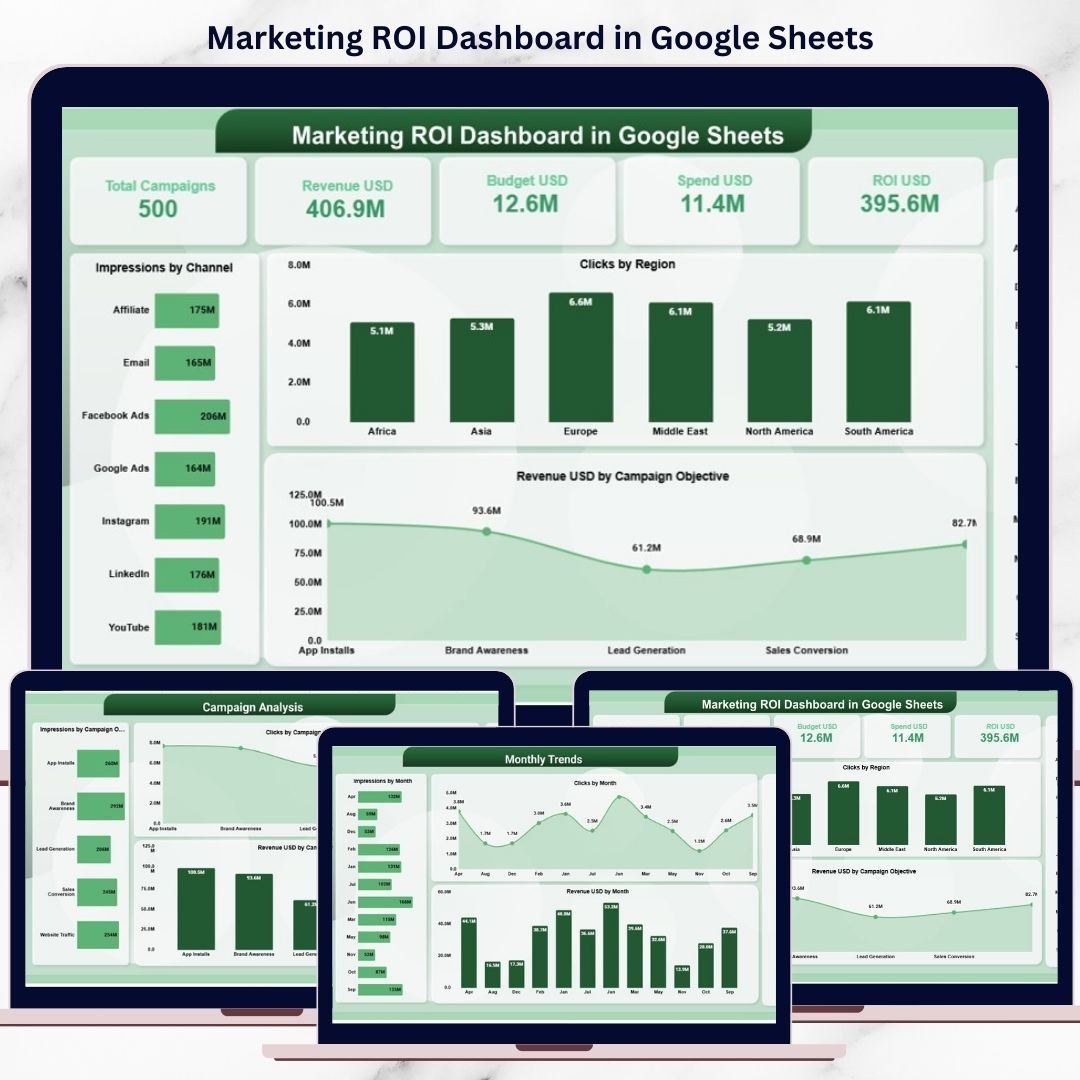
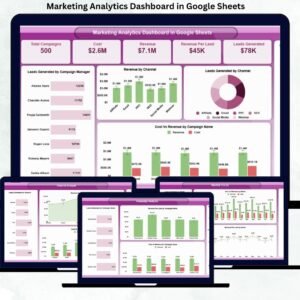
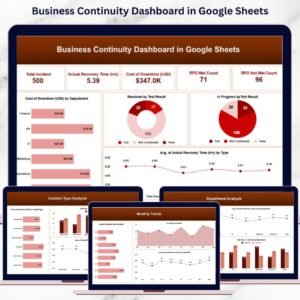
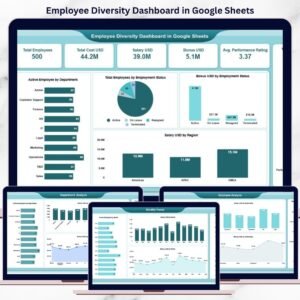
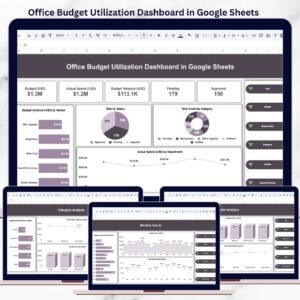
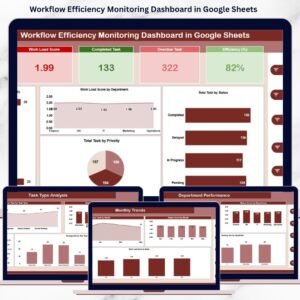
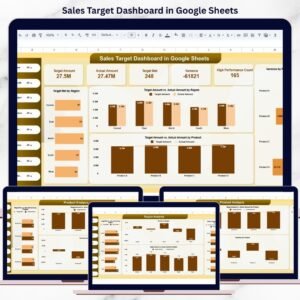
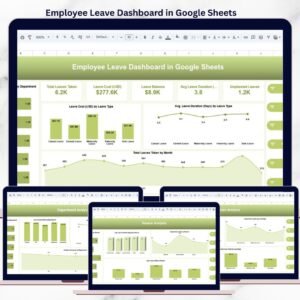
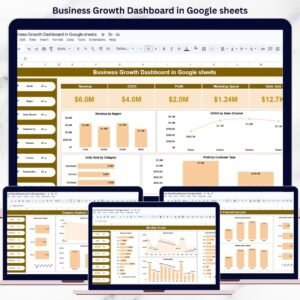
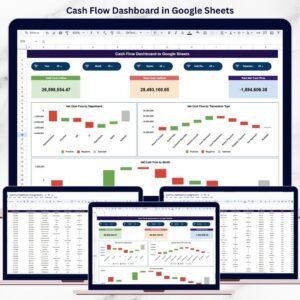
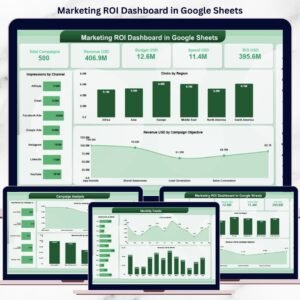
🖥️ Overview Sheet Tab – Marketing Performance Snapshot
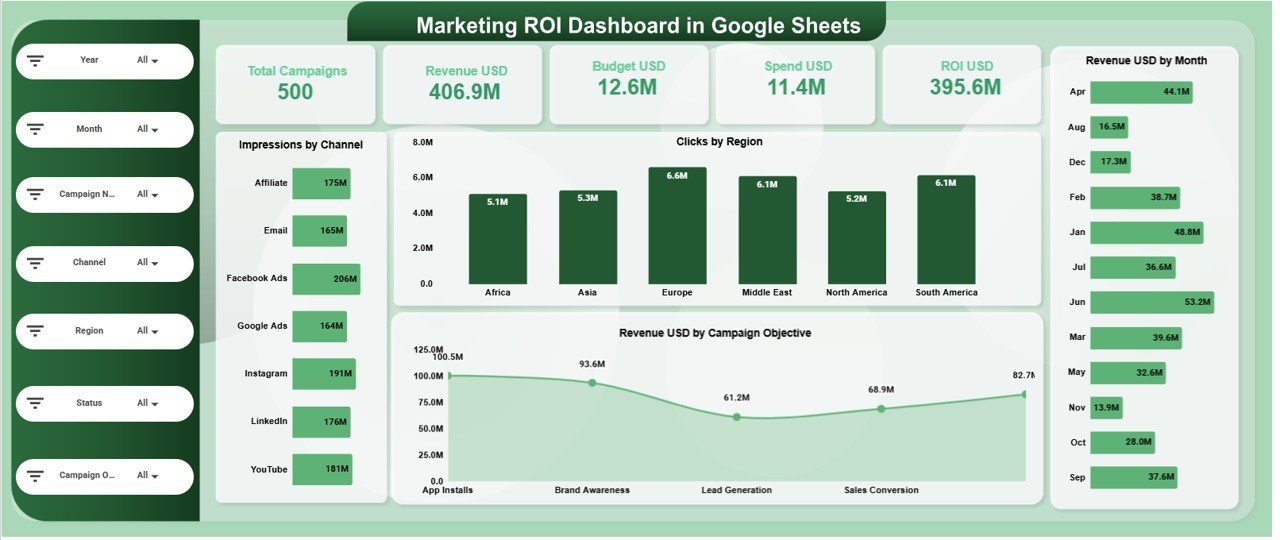
This is the main dashboard view that provides a high-level summary using KPI cards and charts.
📌 KPI Cards on the Dashboard
-
Total Campaigns – Number of active and completed campaigns
-
Revenue USD – Total revenue generated
-
Budget USD – Planned marketing budget
-
Spend USD – Actual marketing spend
-
ROI USD – Return on investment based on revenue vs spend
These cards allow leadership to assess marketing effectiveness instantly.
📊 Charts in the Overview Section
Impressions by Channel
Shows where brand visibility originates—social, search, email, display, and more.
Clicks by Region
Highlights audience engagement across geographic regions.
Revenue USD by Month
Tracks how marketing revenue evolves over time.
Revenue USD by Campaign Objective
Compares revenue contribution from awareness, lead generation, and conversion campaigns.
All visuals update automatically when data changes.
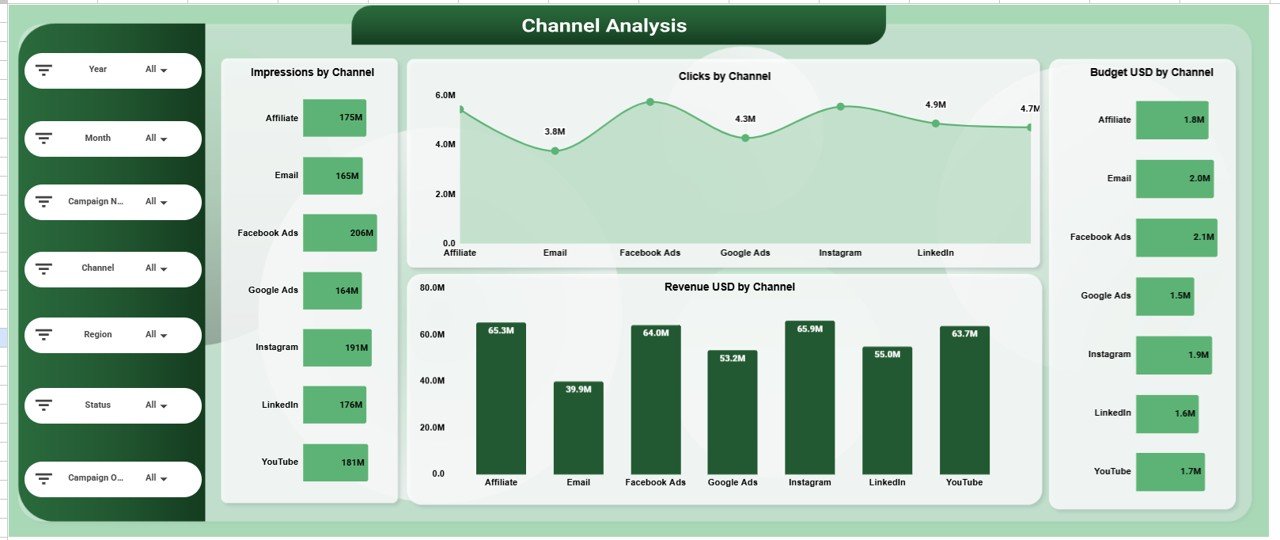
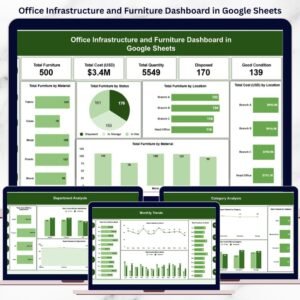
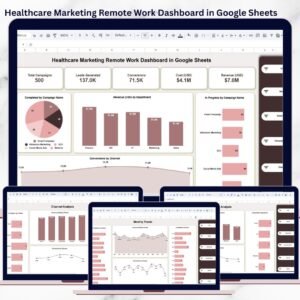
📣 Channel Analysis Section
This section evaluates marketing efficiency by channel using:
-
Impressions by Channel
-
Clicks by Channel
-
Budget USD by Channel
-
Revenue USD by Channel
It helps marketers identify high-ROI channels and cut low-performing spend.
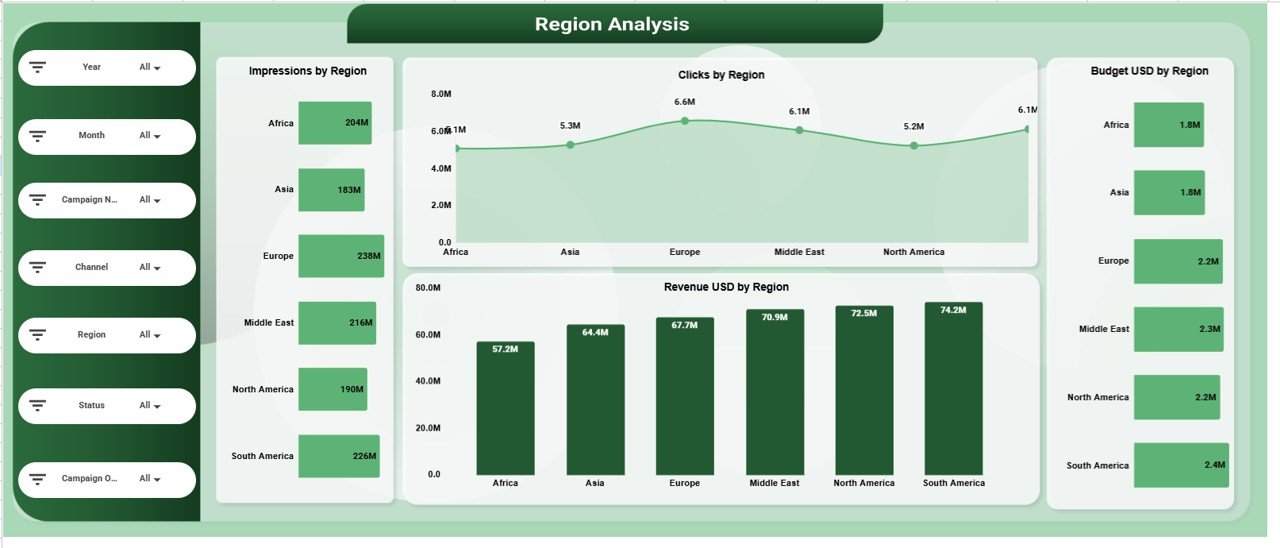
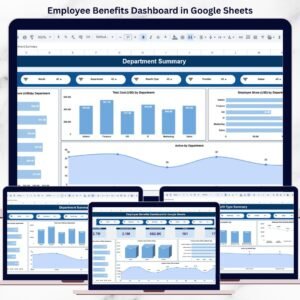
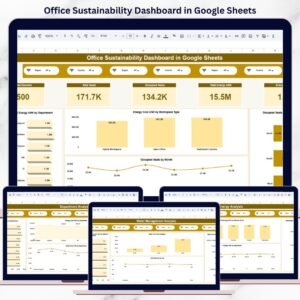
🌍 Region Analysis Section
This section focuses on geographic performance:
-
Impressions by Region
-
Clicks by Region
-
Budget USD by Region
-
Revenue USD by Region
It supports smarter regional targeting and budget reallocation.
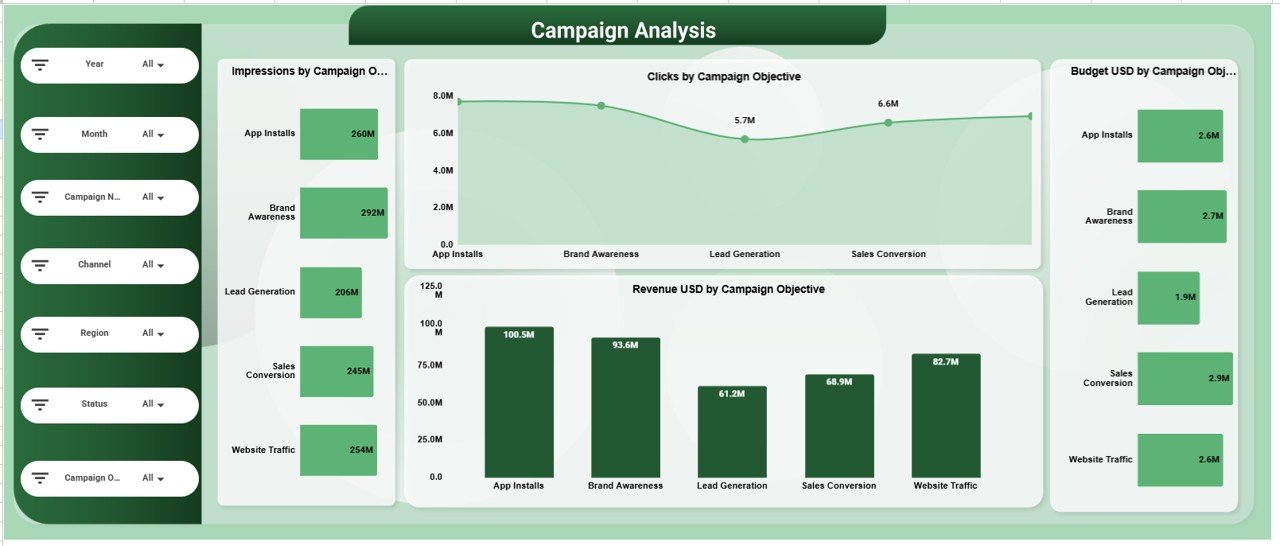
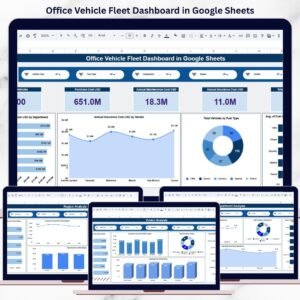
🎯 Campaign Analysis Section
This section analyzes campaigns by objective:
-
Impressions by Campaign Objective
-
Clicks by Campaign Objective
-
Budget USD by Campaign Objective
-
Revenue USD by Campaign Objective
It ensures marketing spend aligns with business outcomes.
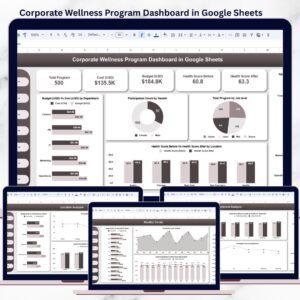
📅 Monthly Trends Analysis Section
Track performance consistency and seasonality using:
-
Impressions by Month
-
Clicks by Month
-
Budget USD by Month
-
Revenue USD by Month
This helps optimize campaign timing and forecast ROI.
📄 Data Input Sheet – Dashboard Foundation
The Data Sheet powers the entire dashboard. Typical columns include:
-
Campaign Name
-
Campaign Objective
-
Channel
-
Region
-
Month
-
Impressions
-
Clicks
-
Budget USD
-
Spend USD
-
Revenue USD
Once data is updated, all KPI cards and charts refresh automatically.
🎯 Who Can Benefit from This Marketing ROI Dashboard
📊 Marketing Teams
Track campaign performance and justify budgets with data.
🚀 Growth Managers
Optimize spend and maximize ROI across channels.
📈 Marketing Analysts
Analyze trends, efficiency, and performance drivers.
👔 Executives & Leadership
Gain instant visibility into marketing impact on revenue.
🏢 Scalable Organizations
Standardize ROI reporting across teams and regions.


Reviews
There are no reviews yet.