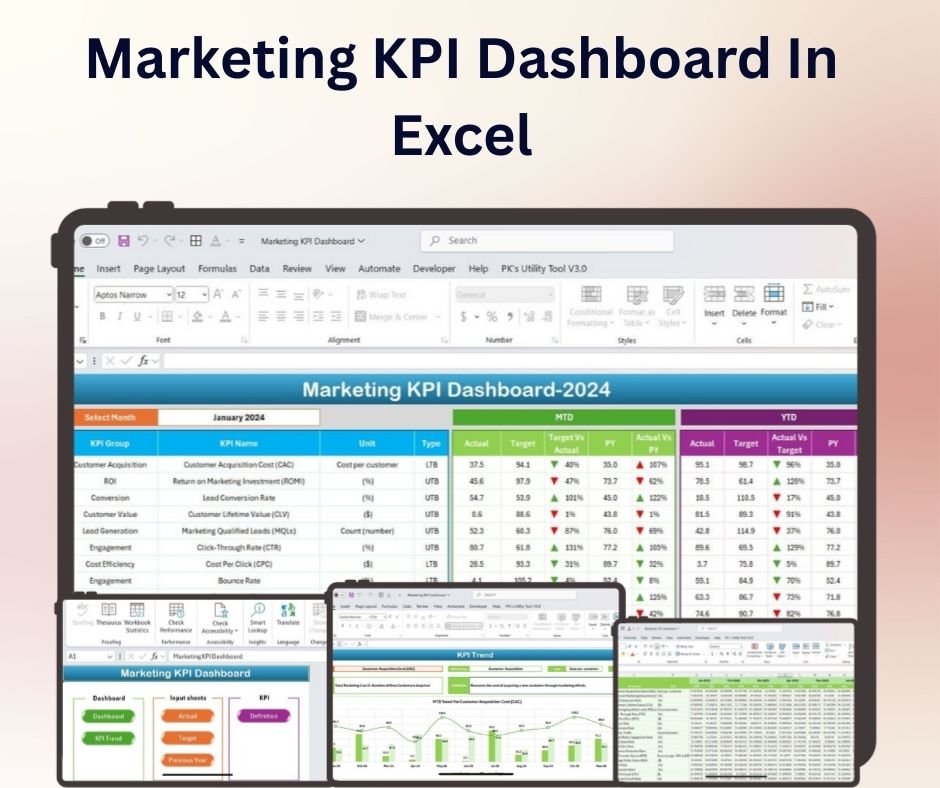
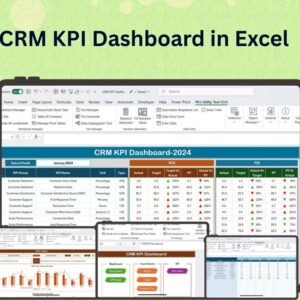
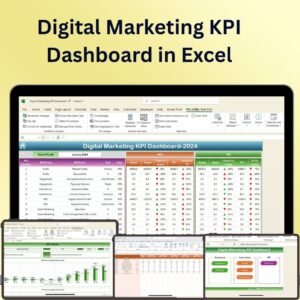
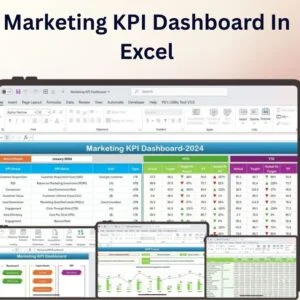
The Marketing KPI Dashboard in Excel is a powerful and customizable tool designed to help marketers track and analyze key performance indicators (KPIs) in a visually engaging and efficient way. Whether you’re managing online campaigns, social media growth, or overall marketing strategies, this Excel dashboard allows you to quickly assess performance and make informed decisions.
With clear visuals and real-time tracking, this dashboard simplifies the process of monitoring marketing efforts. It’s perfect for marketing teams, business owners, and digital marketing professionals who need an easy-to-use tool to visualize metrics such as website traffic, conversion rates, customer acquisition cost, and more.

Key Features of the Marketing KPI Dashboard in Excel:
📊 Dynamic KPI Tracking
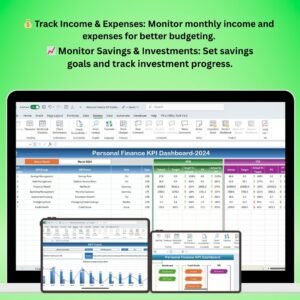
Track multiple marketing KPIs, including website traffic, conversion rates, lead generation, and more—all in one place.
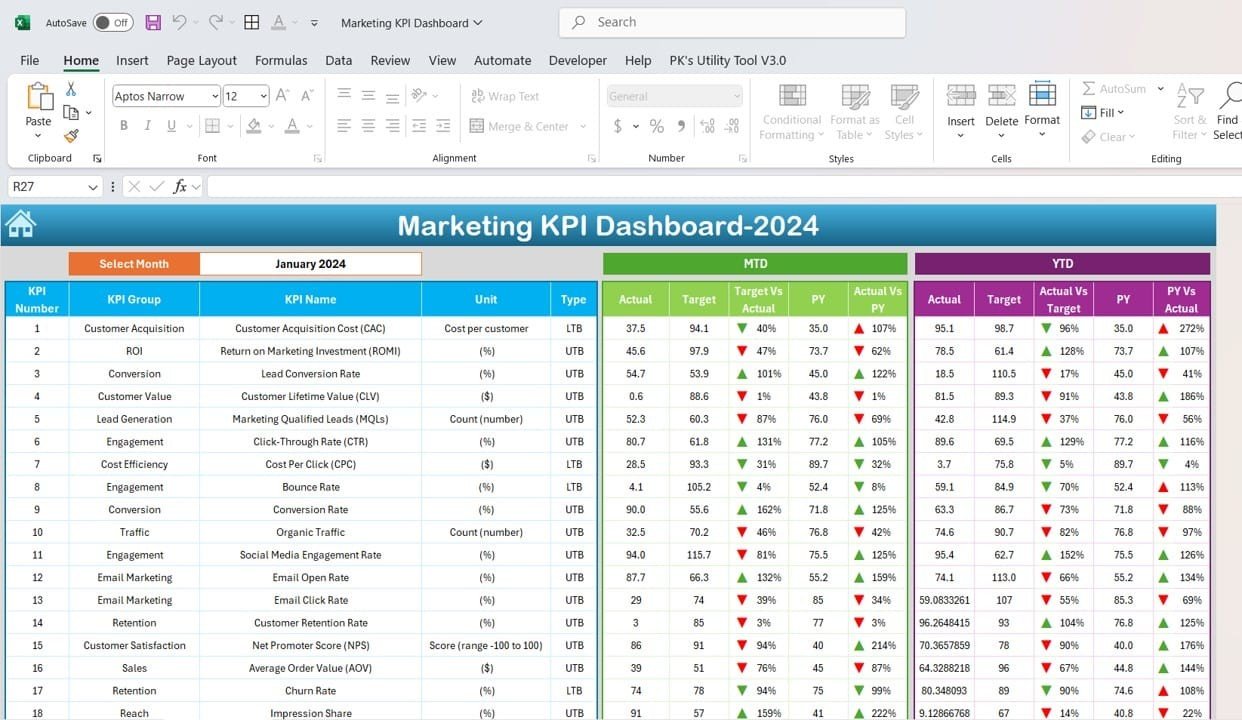
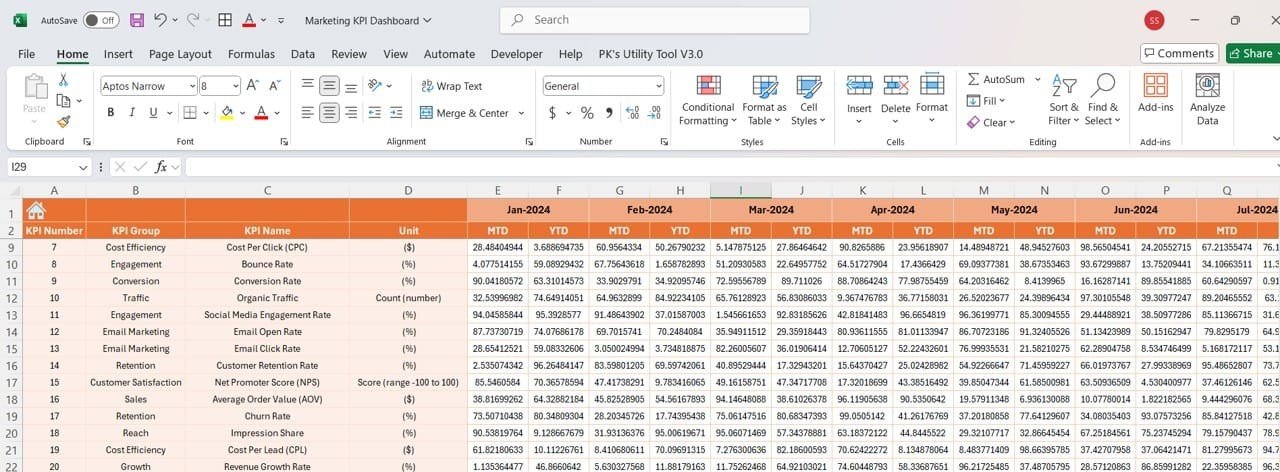
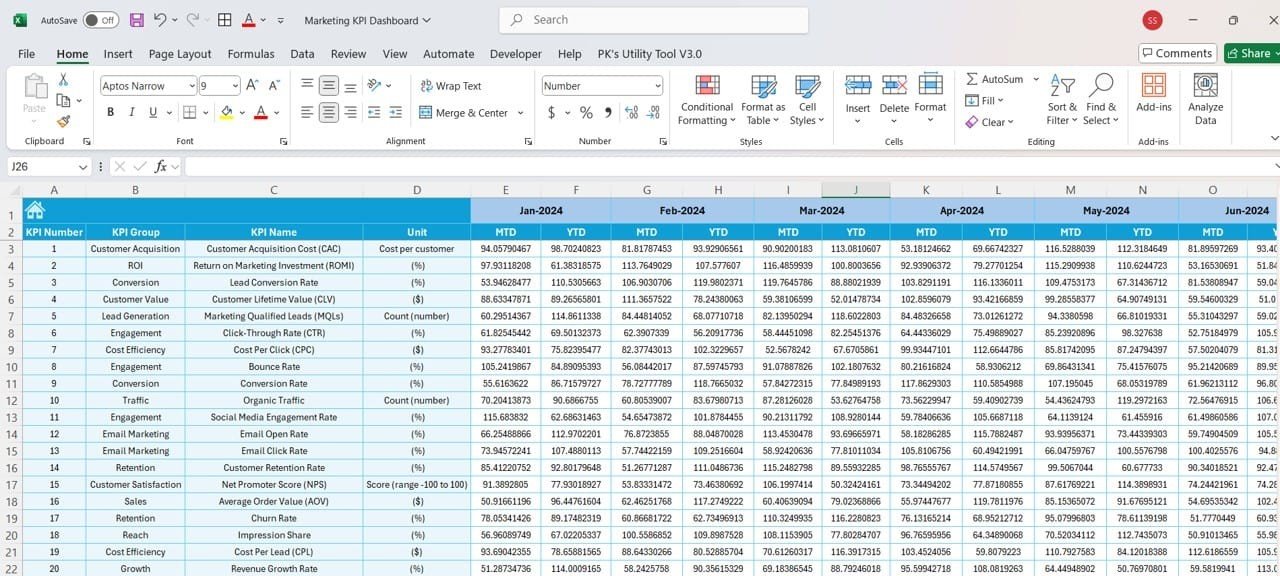
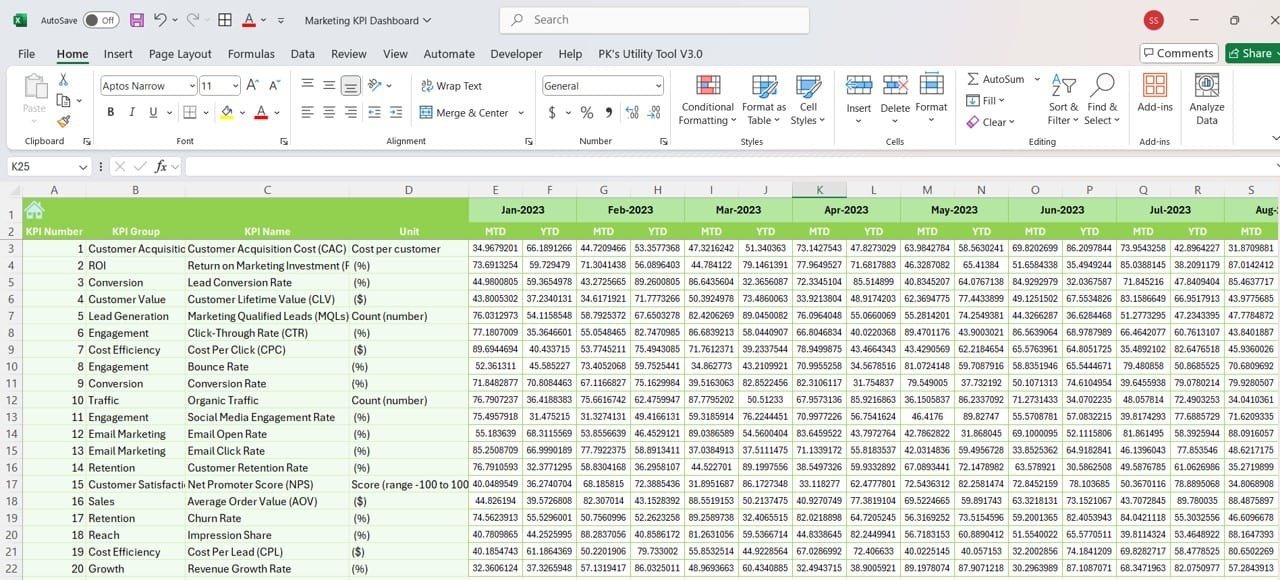
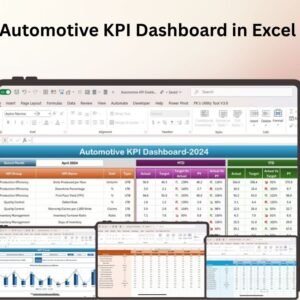
📈 Month-to-Date (MTD) and Year-to-Date (YTD) KPIs
Track your marketing performance in real time with up-to-date MTD and YTD statistics, helping you understand how you’re progressing towards your goals.
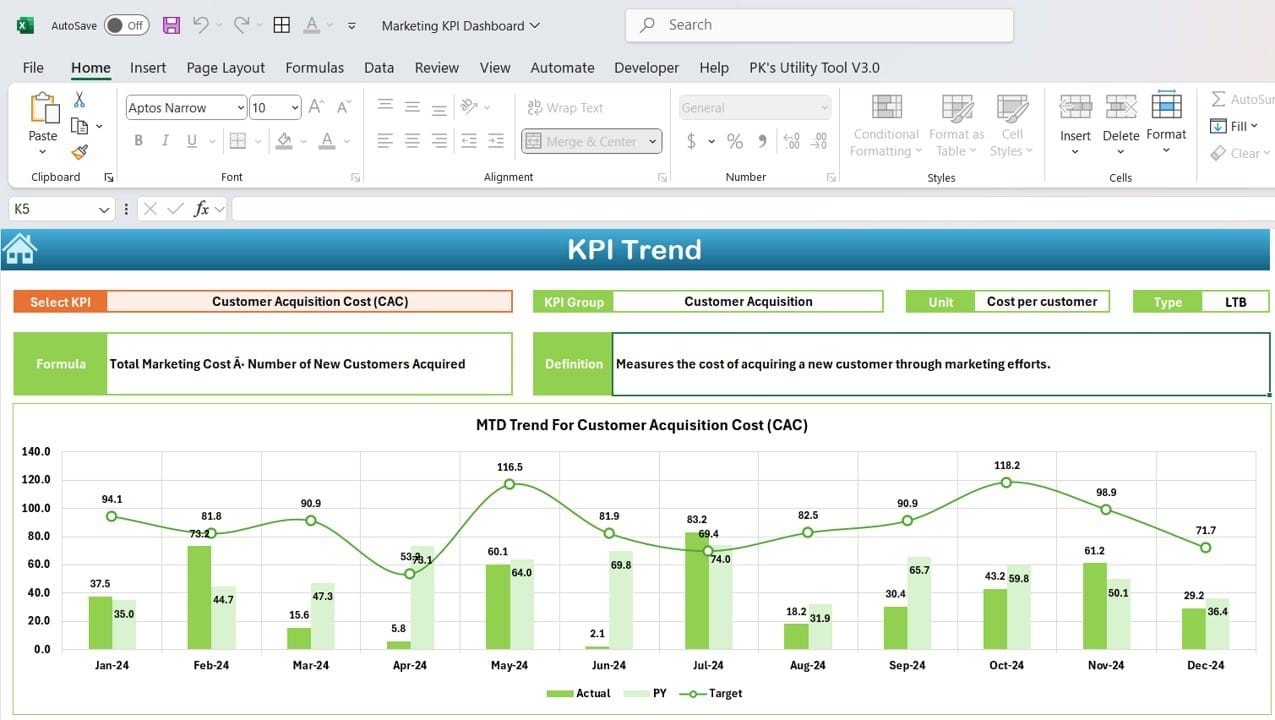
📅 Trend Visualization
Visualize trends over time with easy-to-read charts and graphs. Keep an eye on how your marketing strategies are performing month over month.
💡 Target Setting and Comparison
Set monthly and annual goals for your KPIs and track actual performance against these targets. This helps you measure success and adjust your strategies when needed.
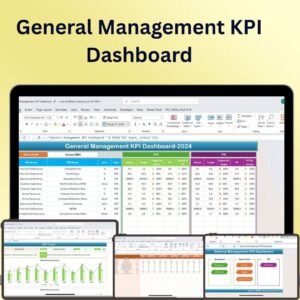
🛠 Customizable Dashboard
Easily customize the dashboard to track the KPIs that matter most to your business. From social media metrics to website engagement, the template adapts to your needs.
🔔 Conditional Formatting Alerts
Get real-time visual alerts with color-coded indicators for KPIs that are on target, falling behind, or exceeding expectations.
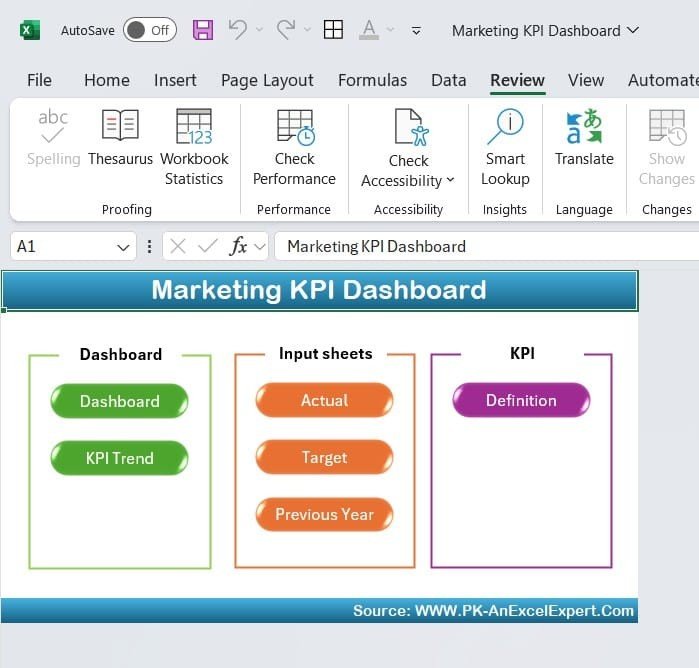
📝 Comprehensive Data Input
Record your marketing data easily with a well-organized input sheet. The template’s structure makes data entry quick and simple, ensuring accuracy across all metrics.
🚀 Why You’ll Love the Marketing KPI Dashboard in Excel:
✅ Effortless Marketing Tracking – Consolidate all your marketing KPIs in one place, making it easy to stay on top of your goals.
✅ Quick Decision-Making – Visualize trends and compare performance against targets to make informed decisions quickly.
✅ Boost Marketing Performance – With clear insights, adjust your strategies to boost ROI and drive better results.
✅ Highly Customizable – Tailor the dashboard to fit your business’s specific marketing goals, ensuring it works for your team.
✅ Easy-to-Use Interface – The intuitive layout makes it simple for anyone to start tracking KPIs without needing technical skills.
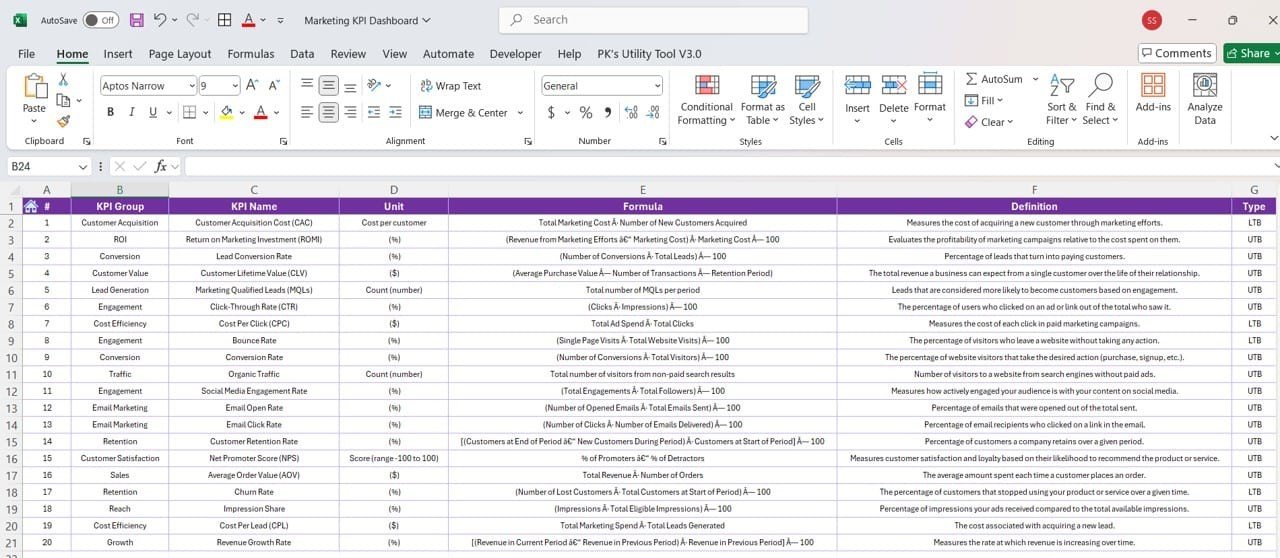
What’s Inside the Marketing KPI Dashboard in Excel:
- Website Traffic KPI: Track the number of visitors, page views, and session duration.
- Conversion Rate KPI: Measure the percentage of visitors who take the desired action (e.g., sign up, purchase).
- Cost per Acquisition (CPA): Monitor the cost of acquiring new customers through different marketing channels.
- Social Media Metrics: Track engagement, reach, and follower growth across various platforms.
- Lead Generation: Measure the number of leads generated through your marketing campaigns.
- Return on Investment (ROI): Calculate the ROI of your marketing efforts to determine the cost-effectiveness of your strategies.
How to Use the Marketing KPI Dashboard in Excel:
1️⃣ Download the Template – Instantly access your Excel file upon purchase.
2️⃣ Input Your Data – Enter your marketing metrics into the template’s pre-built fields.
3️⃣ Set Targets – Define your monthly and yearly goals for each KPI.
4️⃣ Track Progress – Monitor your performance in real time and compare it to your goals.
5️⃣ Generate Reports – Export your data for reporting purposes or team meetings.
Who Can Benefit from the Marketing KPI Dashboard in Excel:
- Marketing Managers
- Digital Marketers
- Social Media Managers
- Business Owners
- Marketing Teams
- Advertising Agencies
- E-Commerce Brands
This Marketing KPI Dashboard in Excel is an essential tool for anyone serious about optimizing their marketing performance. Track your KPIs, visualize trends, and make informed decisions to drive business success.
Click here to read the Detailed blog post
https://www.pk-anexcelexpert.com/marketing-kpi-dashboard-in-excel/
Visit our YouTube channel to learn step-by-step video tutorials
Youtube.com/@PKAnExcelExpert


Reviews
There are no reviews yet.