


The Manufacturing Process Improvement KPI Dashboard in Excel is an essential tool for manufacturers and production managers looking to streamline their operations and improve overall efficiency. This Excel-based dashboard allows you to track and analyze key performance indicators (KPIs) related to production processes, including cycle time, downtime, yield, throughput, and quality control.
With this dashboard, you can gain valuable insights into your manufacturing processes, identify bottlenecks, monitor key metrics, and implement improvements in real-time. Whether you are managing a small production line or overseeing a large manufacturing facility, this dashboard helps you optimize operations and enhance productivity.
Key Features of the Manufacturing Process Improvement KPI Dashboard in Excel
📊 Cycle Time & Throughput Monitoring
Track the time it takes to complete each production cycle and monitor throughput. This allows you to identify areas where time is being wasted and streamline processes to improve overall production speed.
🛠 Downtime Tracking
Monitor downtime across machines and production lines. Identify the root causes of downtime, whether it’s due to maintenance, technical issues, or staffing shortages, and implement strategies to minimize disruptions.
📈 Yield & Quality Control Tracking
Measure the yield from each production batch and ensure that your quality standards are being met. Track defective products and set thresholds for acceptable quality levels to maintain high production standards.
📅 Time-Based Performance Analysis
Analyze your manufacturing KPIs over time to identify trends, seasonal variations, and areas for improvement. Use this data to make informed decisions about process adjustments and long-term strategies.
⚙️ Customizable KPIs & Metrics
The dashboard is customizable, allowing you to track the KPIs that are most relevant to your manufacturing goals. Add custom metrics, adjust formulas, and tailor the dashboard to your specific production needs.
🔑 Data Visualization & Insights
Utilize dynamic charts, graphs, and tables to visualize your data. Real-time performance tracking and data analysis enable you to make quick, informed decisions to boost production efficiency.
Why You’ll Love the Manufacturing Process Improvement KPI Dashboard in Excel

✅ Optimize Production Processes
Track and analyze cycle times, throughput, and downtime to optimize production workflows, reduce inefficiencies, and increase overall productivity.
✅ Improve Product Quality
Ensure that quality control metrics are consistently met by monitoring yield, defects, and other quality-related KPIs in real time.
✅ Data-Driven Decision Making
Make informed decisions based on real-time data and insights into your production process. Spot trends, identify problems early, and implement corrective actions promptly.
✅ Customizable & Scalable
The dashboard is fully customizable to fit your specific needs and scalable for businesses of all sizes. Whether you’re managing a small operation or a large manufacturing facility, this dashboard can be tailored to suit your needs.
✅ Monitor Performance Over Time
Track your KPIs over time to identify performance trends, areas of improvement, and opportunities for growth in your manufacturing operations.
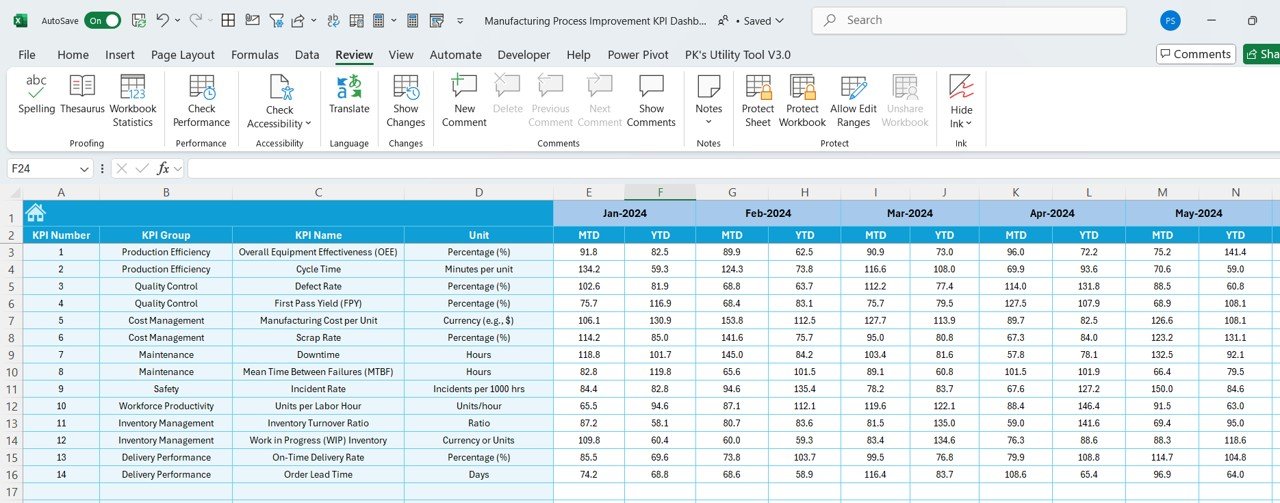
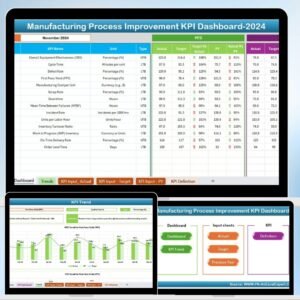
What’s Inside the Manufacturing Process Improvement KPI Dashboard in Excel?
-
Cycle Time & Throughput Tracking: Track production speed and efficiency.
-
Downtime Monitoring: Identify and reduce downtime with targeted solutions.
-
Yield & Quality Control Tracking: Measure product yield and monitor quality.
-
Time-Based Analysis: Analyze trends and data over different time periods.
-
Customizable KPIs: Tailor the dashboard to your manufacturing needs.
-
Data Visualization: Utilize dynamic charts and tables to visualize performance.
How to Use the Manufacturing Process Improvement KPI Dashboard in Excel
1️⃣ Download the Template: Access the Manufacturing Process Improvement KPI Dashboard in Excel instantly.
2️⃣ Input Your Production Data: Enter data such as cycle times, throughput, and downtime for real-time tracking.
3️⃣ Track Key Metrics: Monitor critical KPIs, including yield, cycle times, and downtime.
4️⃣ Analyze Trends & Data: Use time-based analysis to track performance and identify areas for improvement.
5️⃣ Make Improvements: Implement strategies based on insights to improve your manufacturing process.
Who Can Benefit from the Manufacturing Process Improvement KPI Dashboard in Excel?
🔹 Manufacturing Managers & Production Supervisors
🔹 Operations Managers
🔹 Quality Control Teams
🔹 Industrial Engineers
🔹 Supply Chain & Logistics Teams
🔹 Small & Medium-Sized Manufacturing Businesses
🔹 Large-Scale Manufacturing Enterprises
Ensure that your manufacturing processes are running smoothly and efficiently with the Manufacturing Process Improvement KPI Dashboard in Excel. Track cycle times, quality, downtime, and throughput to drive operational improvements and increase productivity.
Click here to read the Detailed blog post
Visit our YouTube channel to learn step-by-step video tutorials
Youtube.com/@PKAnExcelExpert


Reviews
There are no reviews yet.