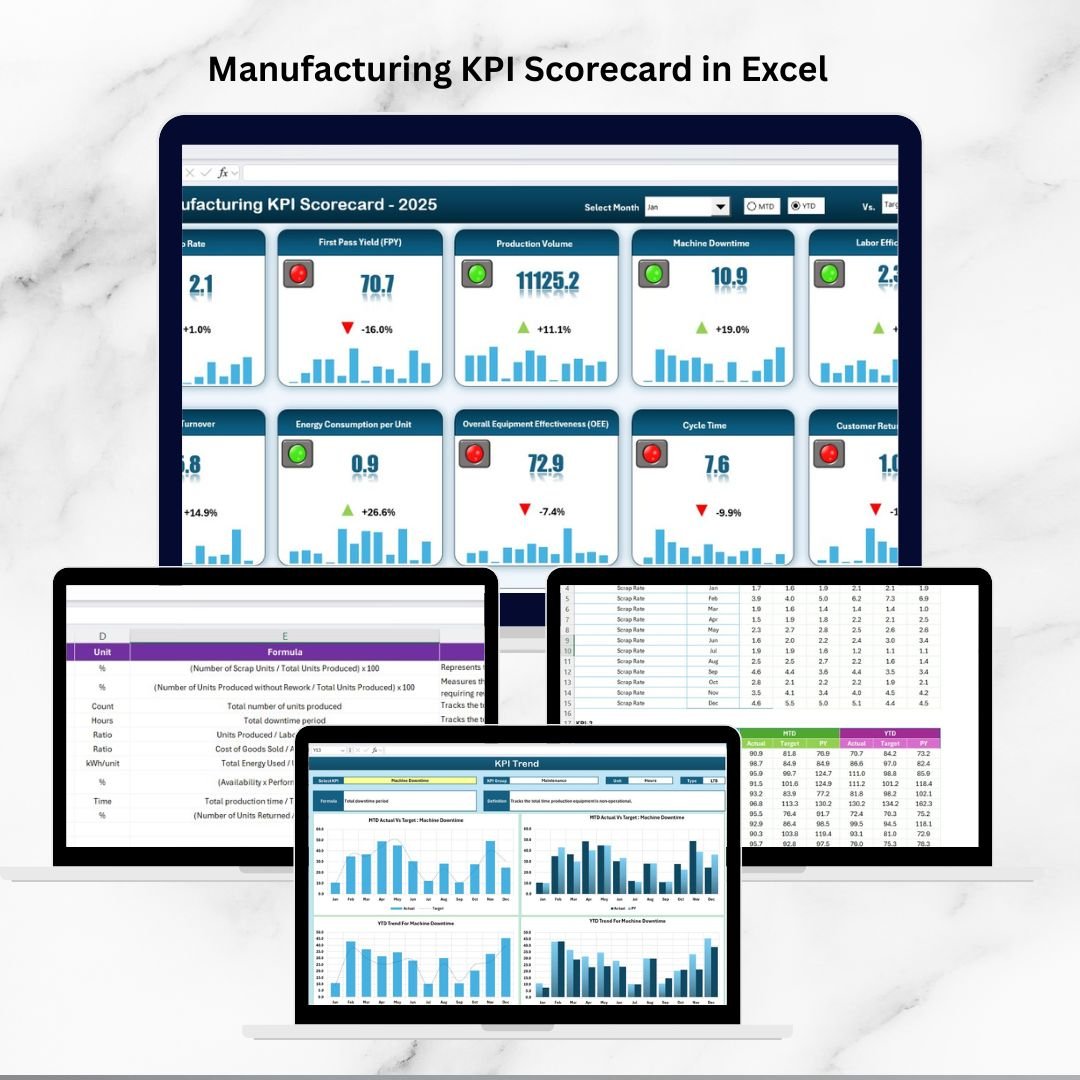
In today’s competitive manufacturing environment, staying ahead requires real-time insights and data-driven decision-making. Without the right tools, managers often struggle to track productivity, efficiency, and quality across multiple processes. The Manufacturing KPI Scorecard in Excel solves this problem by offering a structured, visual, and easy-to-use solution that consolidates all critical metrics into one place. ⚙️📊
This Excel-based scorecard is perfect for small to medium manufacturers looking to streamline performance tracking without investing in complex or costly BI tools. With interactive dashboards, trend analysis, and standardized KPI definitions, it empowers teams to make smarter, faster decisions.
🔑 Key Features of Manufacturing KPI Scorecard in Excel
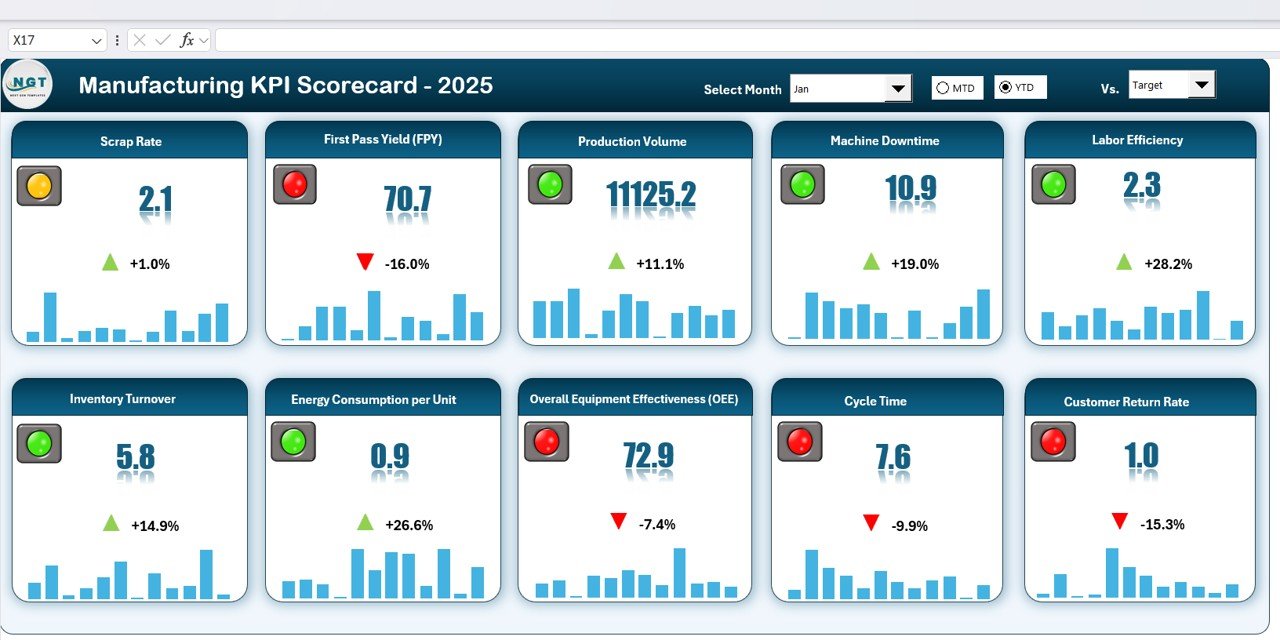
📋 Scorecard Sheet (Main Dashboard)
-
Month filter for dynamic updates.
-
Switch between MTD (Month-to-Date) and YTD (Year-to-Date) views.
-
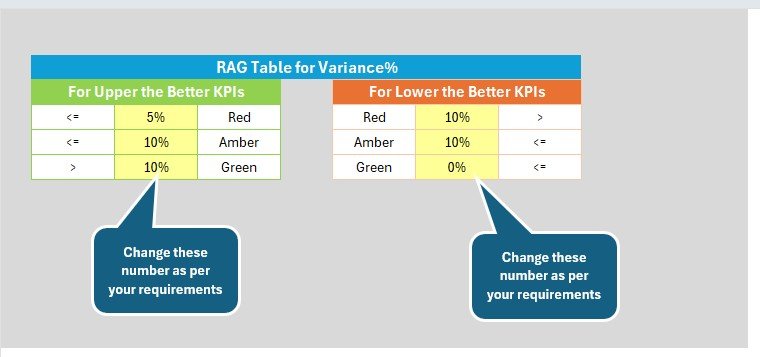
Visual cards, charts, and traffic-light indicators (green/yellow/red).
-
Compare Actual vs. Target vs. Previous Year (PY) performance.
-
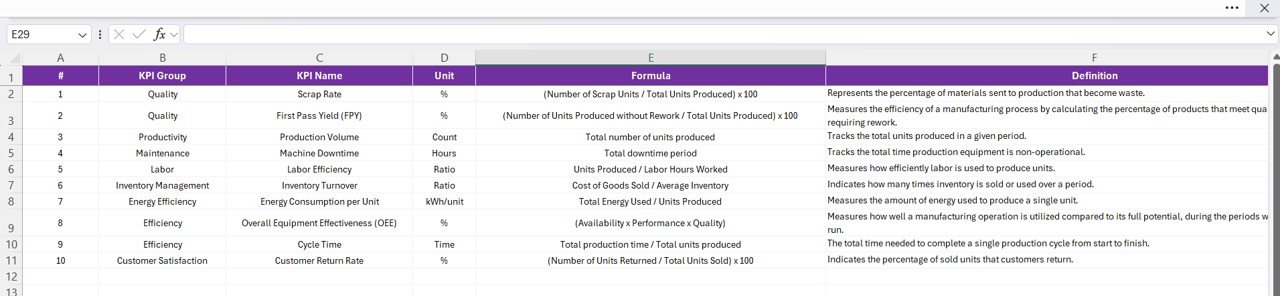
Example KPIs: Scrap Rate, First Pass Yield (FPY), Production Volume, Machine Downtime, Labor Efficiency, Inventory Turnover, Energy Consumption, OEE, Cycle Time, Customer Return Rate.
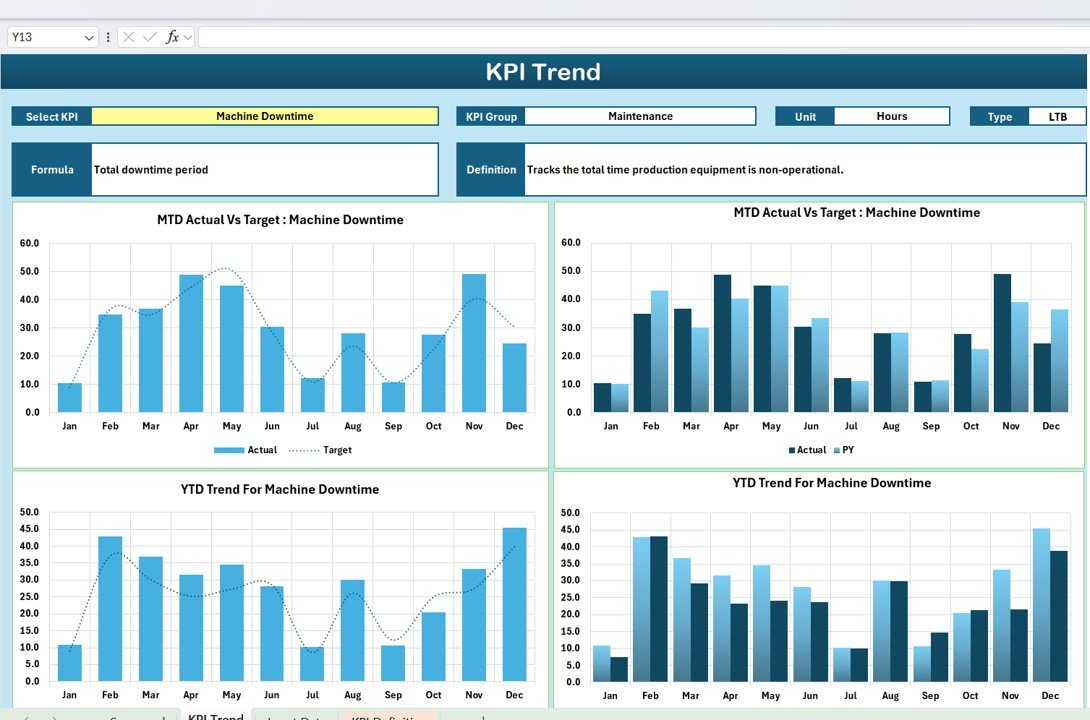
📈 KPI Trend Sheet
-
Select a KPI from dropdown (cell C3).
-
Displays KPI Group, Unit, Type (UTB or LTB).
-
Shows formula & definition for clarity.
-
Charts trends over months for performance evaluation.
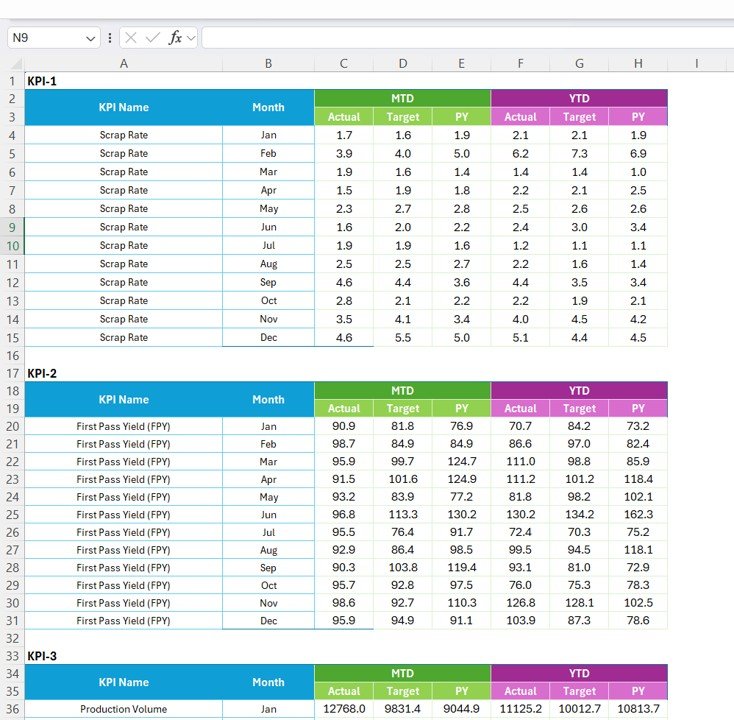
🧾 Input Data Sheet
-
Enter monthly Actual, Target, and Previous Year values.
-
Feeds automatically into dashboard & trend analysis.
-
Keeps reporting accurate and error-free.
📘 KPI Definition Sheet
-
Standardized documentation for every KPI.
-
Includes: Group, Name, Unit, Formula, Definition, Type.
-
Ensures transparency and consistency across teams.
📦 What’s Inside the Scorecard?
✅ 4 Tabs – Scorecard, KPI Trends, Input Data, KPI Definitions
✅ Pre-Built KPIs – Covering quality, productivity, efficiency, and customer focus
✅ Traffic-Light Indicators – Quick visual performance insights
✅ Dynamic Filters – Select month, MTD vs. YTD
✅ Preloaded Sample Data – Easy to understand and start using instantly
✅ Customizable Layout – Add/remove KPIs as per requirements
🎯 Who Can Benefit from This Scorecard?
⚙️ Manufacturing Managers – Track shop floor efficiency.
📊 Quality Teams – Monitor yield, scrap, and return rates.
👨💼 Operations Leaders – Gain visibility across production units.
🏭 SMEs in Manufacturing – Leverage Excel without costly BI tools.
📈 Continuous Improvement Teams – Identify bottlenecks and track progress.
🧠 How to Use the Manufacturing KPI Scorecard
-
Update Actual, Target, and Previous Year data in the Input Data Tab.
-
Review Scorecard Tab for KPI performance and visual traffic-light signals.
-
Use Trend Tab to analyze KPI performance over time.
-
Refer to KPI Definition Tab for clarity on formulas and calculations.
-
Share the dashboard with management teams for decision-making.
No technical expertise required — if you know Excel, you’re ready to go. ✅
🚀 Advantages of Using This Scorecard
-
Cost-Effective – No need for expensive software or licenses.
-
User-Friendly – Simple Excel-based interface, accessible for everyone.
-
Customizable – Add KPIs that match your operations.
-
Real-Time Analysis – Quick updates when new data is entered.
-
Trend Tracking – Spot long-term improvements or issues.
-
Holistic View – Combines quality, efficiency, productivity, and customer focus.
🔧 Opportunities for Improvement
-
Automation – Link with ERP/MES for live updates.
-
Scalability – For large datasets, integrate with Power BI or Tableau.
-
Collaboration – Use cloud storage (OneDrive/Google Drive) for multi-user access.
-
Advanced Security – Add password protection for sensitive data.
🔗 Click here to read the Detailed blog post
🔗 Visit our YouTube channel to learn step-by-step video tutorials


Reviews
There are no reviews yet.