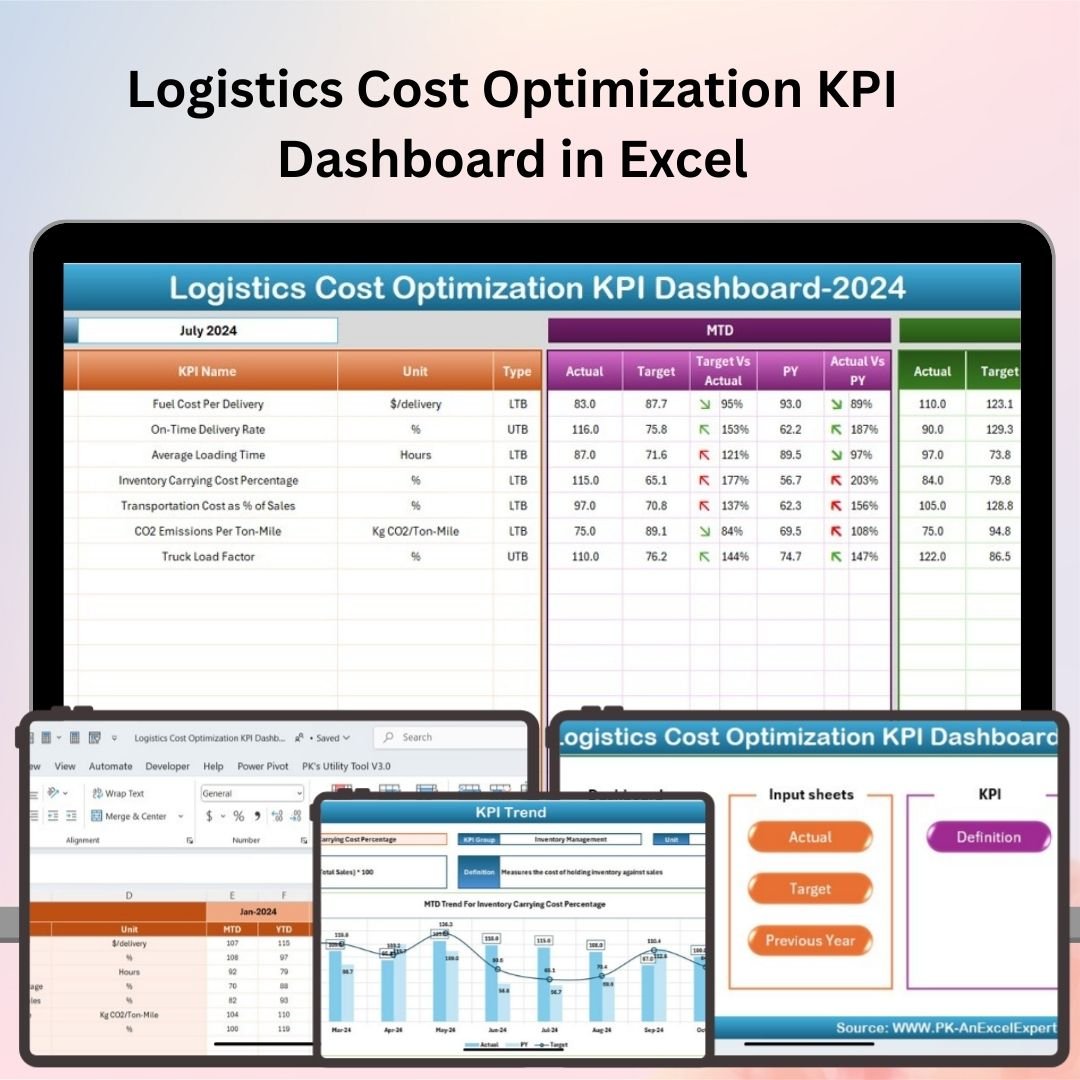


The Logistics Cost Optimization KPI Dashboard in Excel is an essential tool for logistics managers, supply chain professionals, and transportation teams who aim to optimize their logistics operations and reduce costs. This Excel-based dashboard provides real-time insights into key performance indicators (KPIs) such as transportation costs, delivery efficiency, and supply chain performance, helping you make data-driven decisions that improve operational efficiency and reduce costs.
With its user-friendly design, customizable visuals, and real-time tracking, this dashboard helps you identify inefficiencies, monitor logistics expenses, and implement strategies for cost reduction, making it a must-have for organizations looking to streamline their logistics operations.

Key Features of the Logistics Cost Optimization KPI Dashboard in Excel:
🚚 Transportation Cost Tracking
Track transportation expenses, including fuel costs, freight charges, and delivery fees, to identify cost-saving opportunities and optimize route planning.
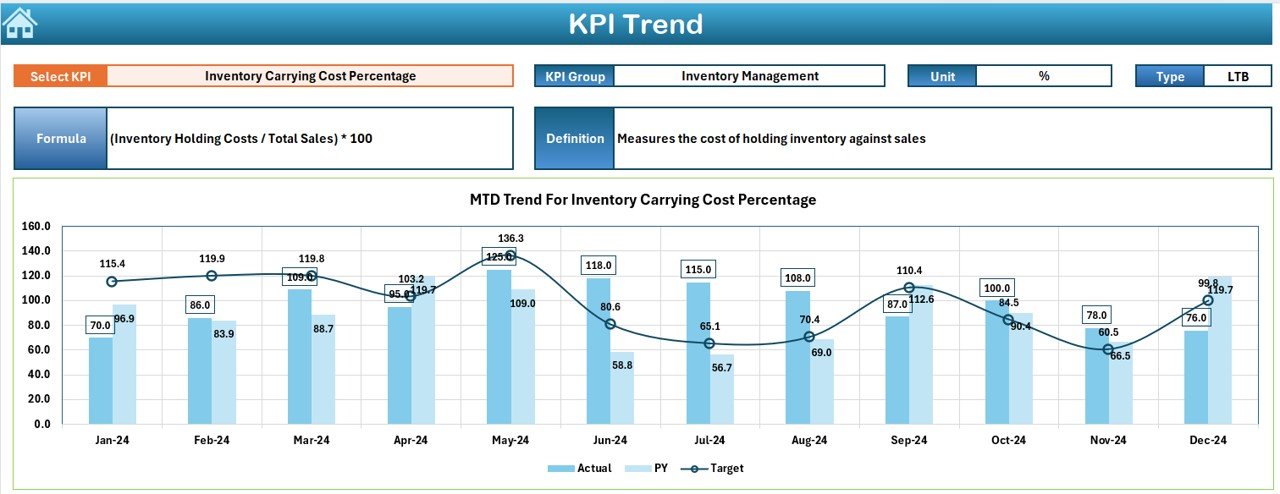
📈 Delivery Performance Metrics
Monitor key delivery performance indicators such as on-time delivery, transit time, and delivery accuracy to ensure that your logistics operations are efficient.
📊 Cost per Unit Analysis
Track the cost per unit for transportation and other logistics activities to measure efficiency and identify areas for improvement.
⚙️ Warehouse and Inventory Management
Monitor warehouse costs, inventory turnover, and storage fees to ensure that your inventory management is cost-effective and streamlined.
💡 Route and Efficiency Optimization
Track routes, vehicle capacity, and driver performance to optimize transportation routes and reduce operational costs.
🚀 Why You’ll Love the Logistics Cost Optimization KPI Dashboard in Excel:
✅ Track Transportation Costs – Keep an eye on transportation expenses, including fuel, freight, and other logistics costs, helping you identify areas for cost reduction.
✅ Enhance Delivery Efficiency – Monitor delivery performance metrics such as on-time delivery and transit time, ensuring that your logistics operations are meeting efficiency goals.
✅ Optimize Warehouse Costs – Track warehouse and inventory costs to improve storage efficiency and reduce unnecessary expenses.
✅ Cost per Unit Analysis – Measure cost per unit for transportation and logistics to evaluate efficiency and identify opportunities to optimize operations.
✅ Improve Operational Efficiency – Use real-time data to identify inefficiencies in your logistics processes and implement cost-saving strategies.
✅ Customizable and Easy-to-Use – Fully customizable to suit your specific logistics needs, with a simple and intuitive interface for seamless tracking and reporting.
What’s Inside the Logistics Cost Optimization KPI Dashboard in Excel:
-
Transportation Cost Tracking: Track all transportation-related expenses such as fuel, freight, and delivery costs to optimize route planning and reduce costs.
-
Delivery Performance Metrics: Monitor key metrics like on-time delivery, delivery accuracy, and transit time to ensure high levels of delivery performance.
-
Cost per Unit Analysis: Analyze the cost per unit for logistics activities, helping you measure efficiency and identify potential savings.
-
Warehouse and Inventory Costs: Track inventory turnover, storage fees, and warehouse costs to ensure that your inventory management is cost-effective.
-
Route Optimization: Monitor routes, vehicle capacity, and driver performance to optimize logistics operations and reduce transportation costs.
-
Custom Reports: Generate detailed reports summarizing transportation costs, delivery performance, and warehouse expenses to help you make data-driven decisions.
How to Use the Logistics Cost Optimization KPI Dashboard in Excel:
1️⃣ Download the Template – Instantly access your Excel file upon purchase.
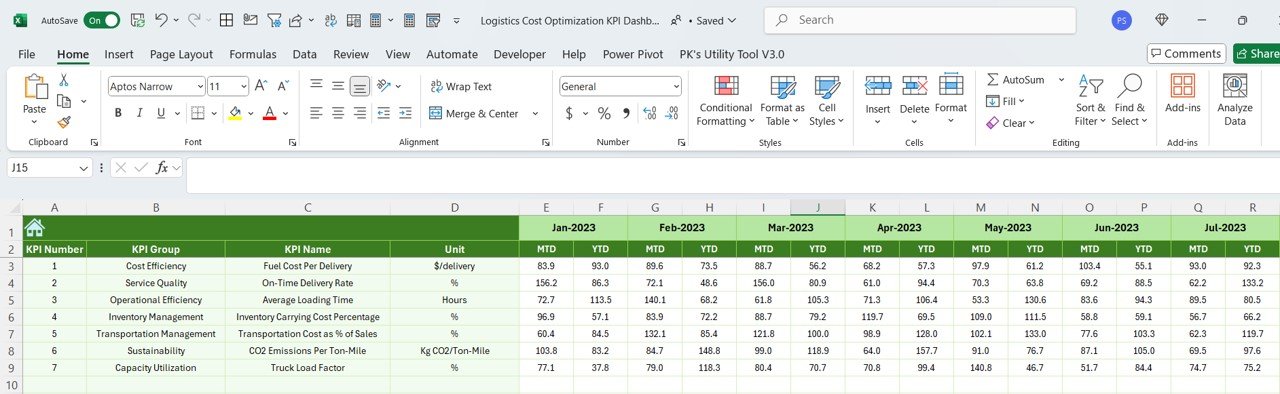
2️⃣ Input Logistics Data – Enter data for transportation expenses, delivery performance, warehouse costs, and inventory management to start tracking KPIs.
3️⃣ Monitor Key Metrics – Use the dashboard to track and visualize transportation costs, delivery efficiency, and warehouse expenses in real-time.
4️⃣ Optimize Operations – Analyze the data to identify inefficiencies in transportation and logistics processes and implement optimization strategies.
5️⃣ Generate Reports – Create customized reports summarizing key logistics performance metrics for decision-makers and stakeholders.
Who Can Benefit from the Logistics Cost Optimization KPI Dashboard in Excel:
-
Logistics Managers
-
Supply Chain Professionals
-
Warehouse Managers
-
Operations and Finance Teams
-
Freight and Transportation Teams
-
Distribution Centers
-
Small to Large Enterprises with Logistics Operations
-
E-commerce and Retail Companies
The Logistics Cost Optimization KPI Dashboard in Excel is a must-have tool for companies looking to optimize their logistics operations, reduce costs, and improve delivery efficiency. Whether you’re managing a single warehouse or an entire global supply chain, this dashboard will help you track key metrics, optimize routes, and streamline your logistics processes for maximum efficiency.
Click here to read the Detailed blog post
https://www.pk-anexcelexpert.com/logistics-cost-optimization-kpi-dashboard-in-excel/
Visit our YouTube channel to learn step-by-step video tutorials
Youtube.com/@PKAnExcelExpert


Reviews
There are no reviews yet.