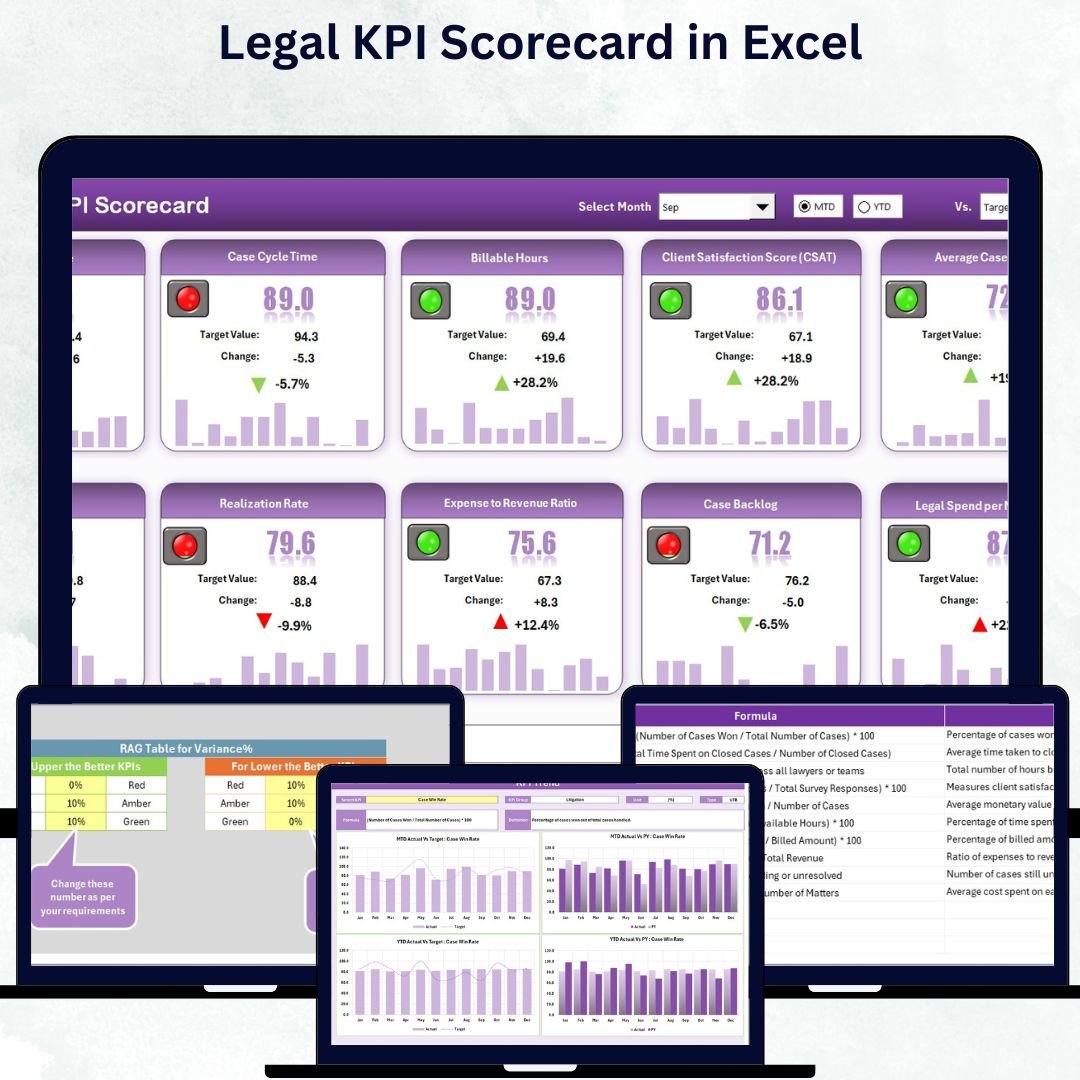
In today’s fast-paced business world, every department must prove its value — and the Legal Department is no exception. If your team manages contracts, compliance, or risk but lacks measurable insights, this tool is your perfect companion. Introducing the Legal KPI Scorecard in Excel — a ready-to-use, data-driven, and visually engaging performance tracking template designed to transform how legal teams measure success.
With this all-in-one Excel tool, you can track the most critical Key Performance Indicators (KPIs) such as contract turnaround time, dispute resolution rate, and compliance efficiency — all in one place. Whether you lead an in-house legal team or work at a law firm, this scorecard helps you monitor performance, enhance productivity, and demonstrate measurable results effortlessly.
Key Features of Legal KPI Scorecard in Excel
✨ Comprehensive Performance Dashboard:
Get a complete picture of your legal department’s performance with easy-to-read visuals and KPI summaries.
📊 MTD and YTD Analysis:
Switch seamlessly between Month-to-Date and Year-to-Date views to evaluate ongoing performance trends.
🎯 Target vs Actual Comparison:
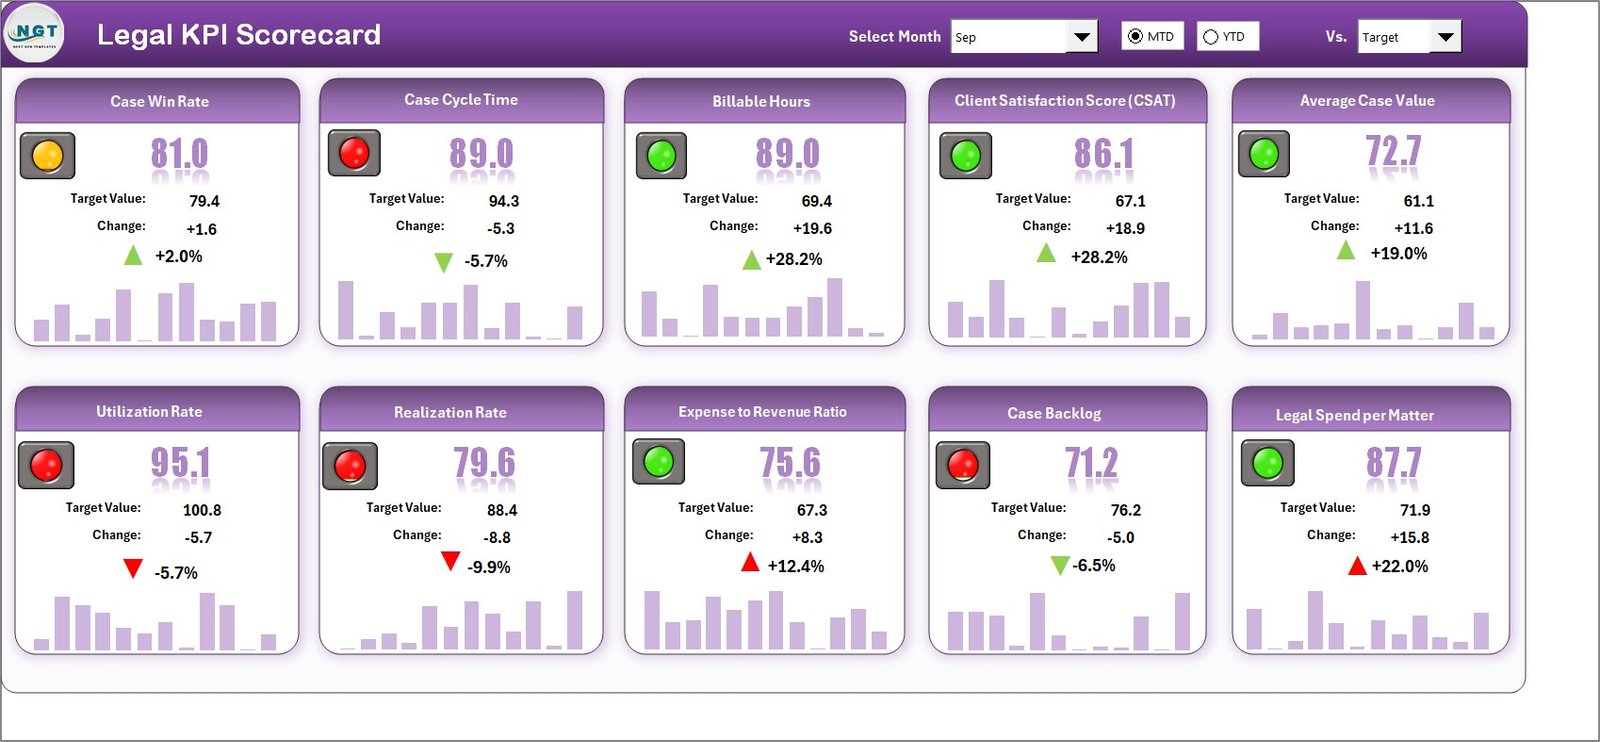
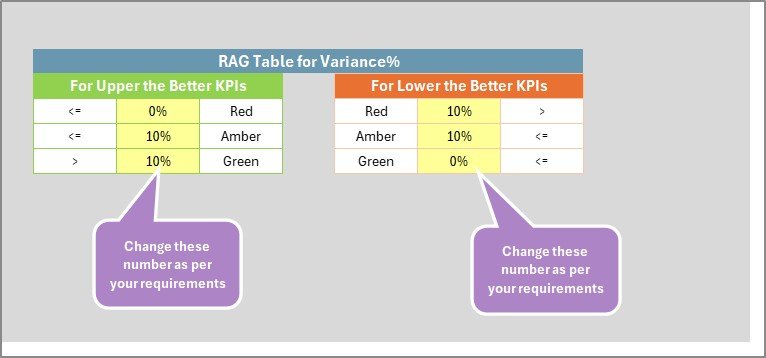
Measure how close your results are to targets using conditional formatting and traffic-light indicators.
📈 Dynamic Trend Charts:
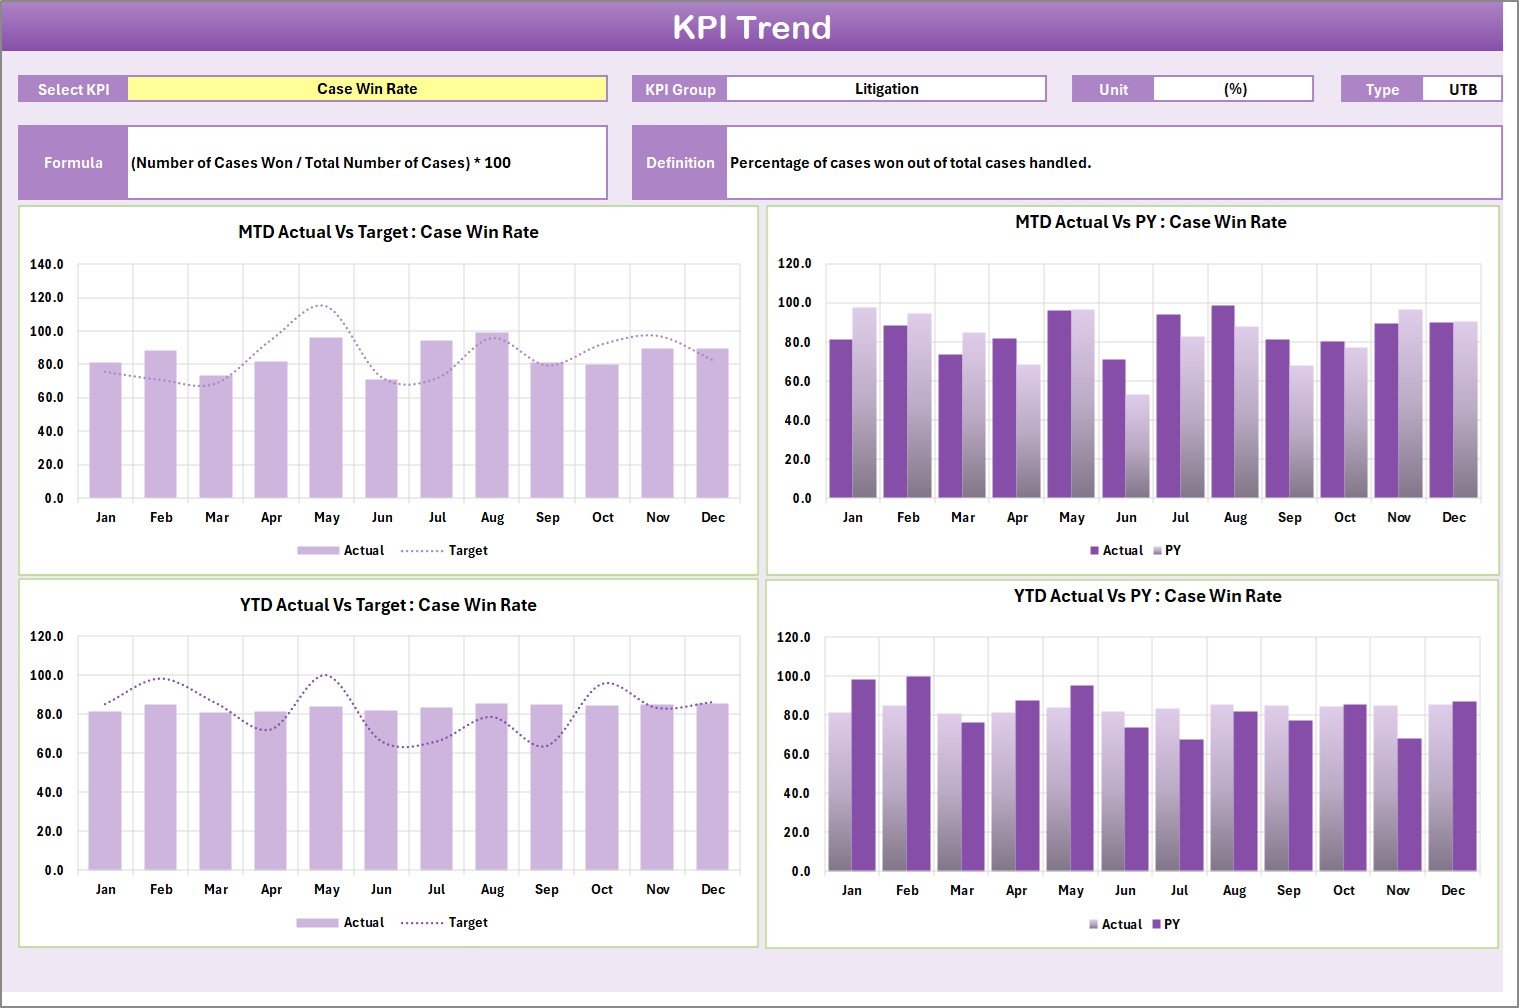
View historical data with interactive trend lines for every KPI — making it simple to identify performance improvements or dips.
💡 Error-Free Data Entry:
The built-in validation system ensures your data stays clean, accurate, and reliable.
🧩 Fully Editable and Customizable:
Add, remove, or rename KPIs anytime — tailor it perfectly to your team’s requirements.
📂 What’s Inside the Legal KPI Scorecard in Excel
This Excel template includes four expertly designed sheets, each built for specific functions:
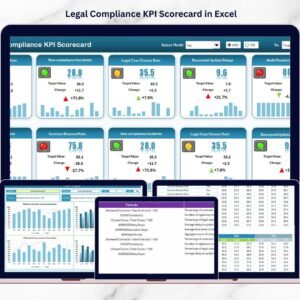
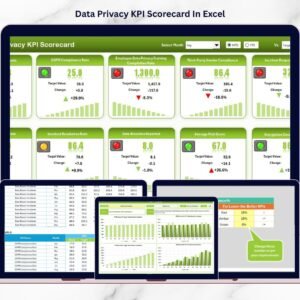
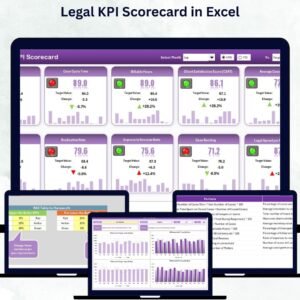
1️⃣ Scorecard Sheet – The main dashboard where performance results are displayed. Use dropdown menus to switch between months or KPI groups, and instantly see your team’s overall performance.
2️⃣ KPI Trend Sheet – Select any KPI from the dropdown (cell C3) to view MTD and YTD trends for Actual, Target, and Previous Year data. Ideal for identifying patterns and areas needing attention.
3️⃣ Input Data Sheet – A simple, structured data entry area where you record monthly Actuals, Targets, and Previous Year numbers. Once entered, the data automatically updates your dashboard.
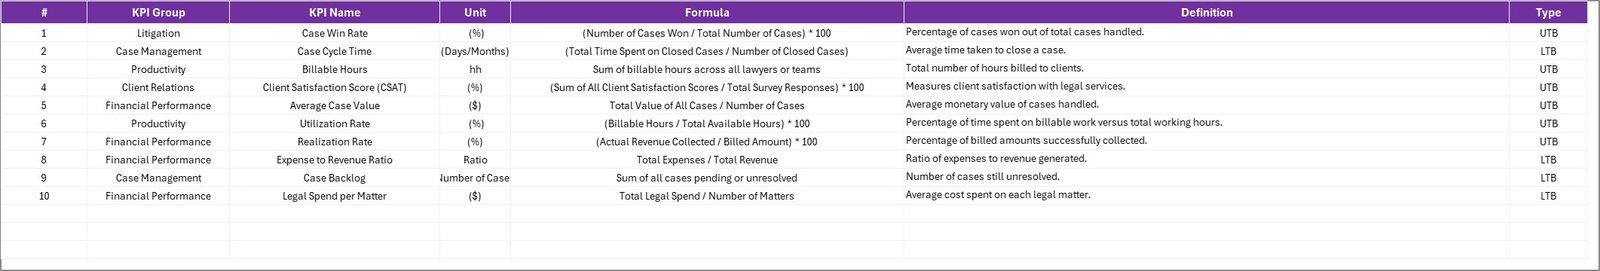
4️⃣ KPI Definition Sheet – Your reference guide for all KPIs, containing the KPI Group, Unit, Formula, and Definition. It ensures clarity and consistency across reports.
This structure ensures every legal metric is measurable, traceable, and actionable.
🧠 How to Use the Legal KPI Scorecard in Excel
📝 Step 1: Define all your KPIs in the KPI Definition Sheet.
📅 Step 2: Enter the latest data in the Input Data Sheet — including Actuals, Targets, and PY data.
📊 Step 3: Go to the Scorecard Sheet and use dropdowns to switch between MTD and YTD performance views.
📈 Step 4: Explore the KPI Trend Sheet to visualize monthly or yearly performance.
📤 Step 5: Share or print the scorecard for your board meetings or compliance presentations.
In just minutes, you can turn complex legal data into visual insights that support strategic decisions.
👥 Who Can Benefit from This Legal KPI Scorecard in Excel
🏢 Corporate Legal Departments: Track contracts, disputes, and compliance performance efficiently.
⚖️ Law Firms: Evaluate billing efficiency, client satisfaction, and case outcomes.
🕵️ Compliance Teams: Monitor audit completion rates and policy adherence.
📊 Legal Analysts: Simplify data presentation with easy-to-read visuals.
💼 Executives and Managers: Review legal performance KPIs in clear dashboards.
No matter the industry — finance, healthcare, or technology — this Excel tool provides unmatched visibility and control over legal performance.


Reviews
There are no reviews yet.