


In today’s fast-paced regulatory landscape, staying compliant is no longer just a checkbox task—it’s a strategic necessity. Introducing the Legal Compliance KPI Dashboard in Power BI, your all-in-one solution for tracking, monitoring, and improving your organization’s legal compliance efforts in real time.
This interactive and visually rich Power BI dashboard is designed specifically for legal and compliance teams who need instant clarity and control. From tracking policy adherence and audit readiness to risk mitigation metrics, this dashboard puts your compliance performance front and center.
Let’s explore how it empowers your team to act quickly, report accurately, and stay ahead of compliance risks.
✨ Key Features of Legal Compliance KPI Dashboard
🟢 Three Dynamic Dashboard Pages

-
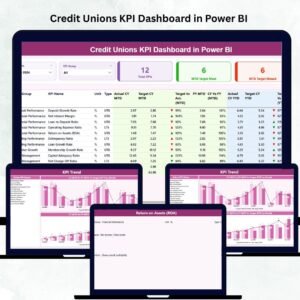
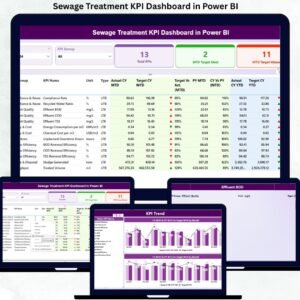
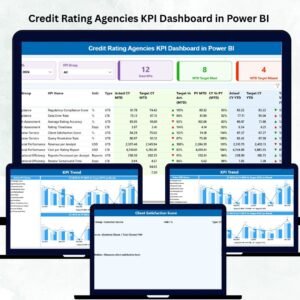
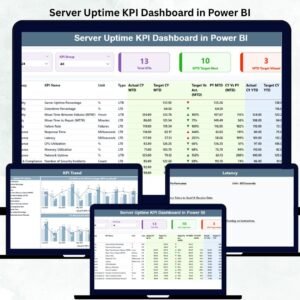
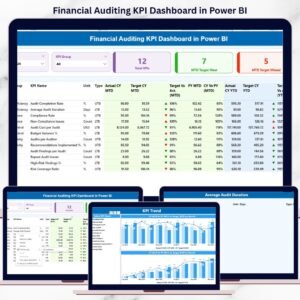
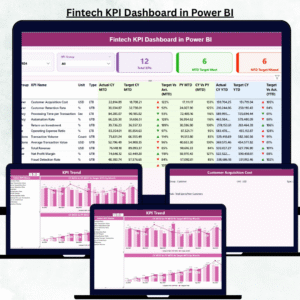
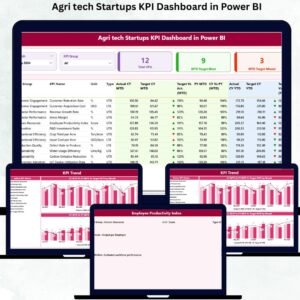
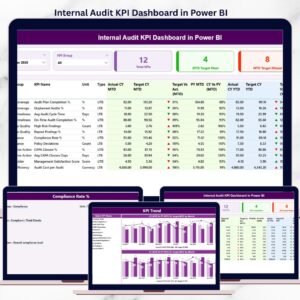
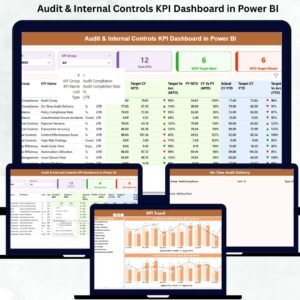
Summary Page
Get an instant overview of all legal KPIs with slicers for Month and KPI Group. Visuals include:-
Total KPIs Count
-
MTD Target Met / Missed
-
Detailed KPI table with trend indicators (📈/📉)
-
-
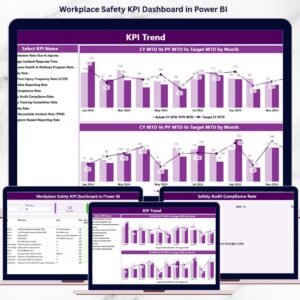
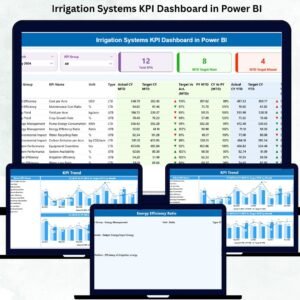
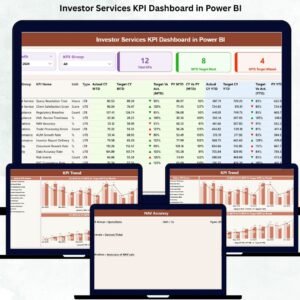
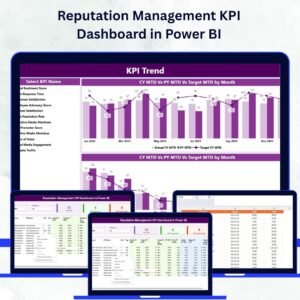
KPI Trend Page
Combo charts highlight performance over time with filters by KPI Name. Separate visuals for MTD and YTD trends let you:-
Spot fluctuations quickly
-
Compare Target vs Actual vs Previous Year
-
-
KPI Definition Page (Drill-through)
Easily navigate from Summary to detailed definitions, formulas, units, and KPI types using a single click.
📦 What’s Inside the Product?
This dashboard connects seamlessly with an Excel backend and includes:
-
✅ Input_Actual Sheet – Records actual MTD and YTD values
-
🎯 Input_Target Sheet – Stores target metrics for the same periods
-
📘 KPI Definition Sheet – Lists KPI numbers, groups, units, formulas, and types (UTB/LTB)
Power BI consumes this structured data and visualizes it effortlessly with auto-refresh capabilities and filters.
🧠 How to Use the Legal Compliance Dashboard
Step 1: Enter your KPI data in Excel
Step 2: Open the Power BI file and refresh
Step 3: Use slicers to filter by KPI Group or Month
Step 4: Click a KPI to drill into definition and root cause
Step 5: Review trends, spot red flags, and take action!
Whether you’re in a boardroom or an audit meeting, this dashboard ensures you always have the right insights at your fingertips.
👥 Who Can Benefit from This Dashboard?
-
⚖️ Legal Teams & Compliance Officers
-
🏢 Corporate Risk Managers
-
🏥 Healthcare Compliance Teams
-
🏫 Educational Institutions
-
🧾 Audit and Regulatory Consultants
-
🏛️ Government and Public Sector Agencies
If your role involves ensuring policy compliance or preparing for audits, this dashboard is for you!
🚀 Why Power BI for Legal Compliance?
-
Interactive Filters & Slicers – Instantly drill down to specifics
-
Auto-Refresh Option – Update Excel, click refresh—done!
-
Secure & Scalable – Role-based access and performance at scale
-
No Coding Needed – User-friendly for non-tech professionals
-
Mobile & Desktop Access – Compliance insights wherever you go
📌 Pro Tips for Maximum Impact
-
✅ Use conditional formatting in Excel for alerts
-
📅 Schedule monthly updates for audit readiness
-
🎨 Customize charts to match your brand
-
🔐 Use role-based access to protect sensitive data
-
🔍 Bookmark views in Power BI for faster reporting


Reviews
There are no reviews yet.