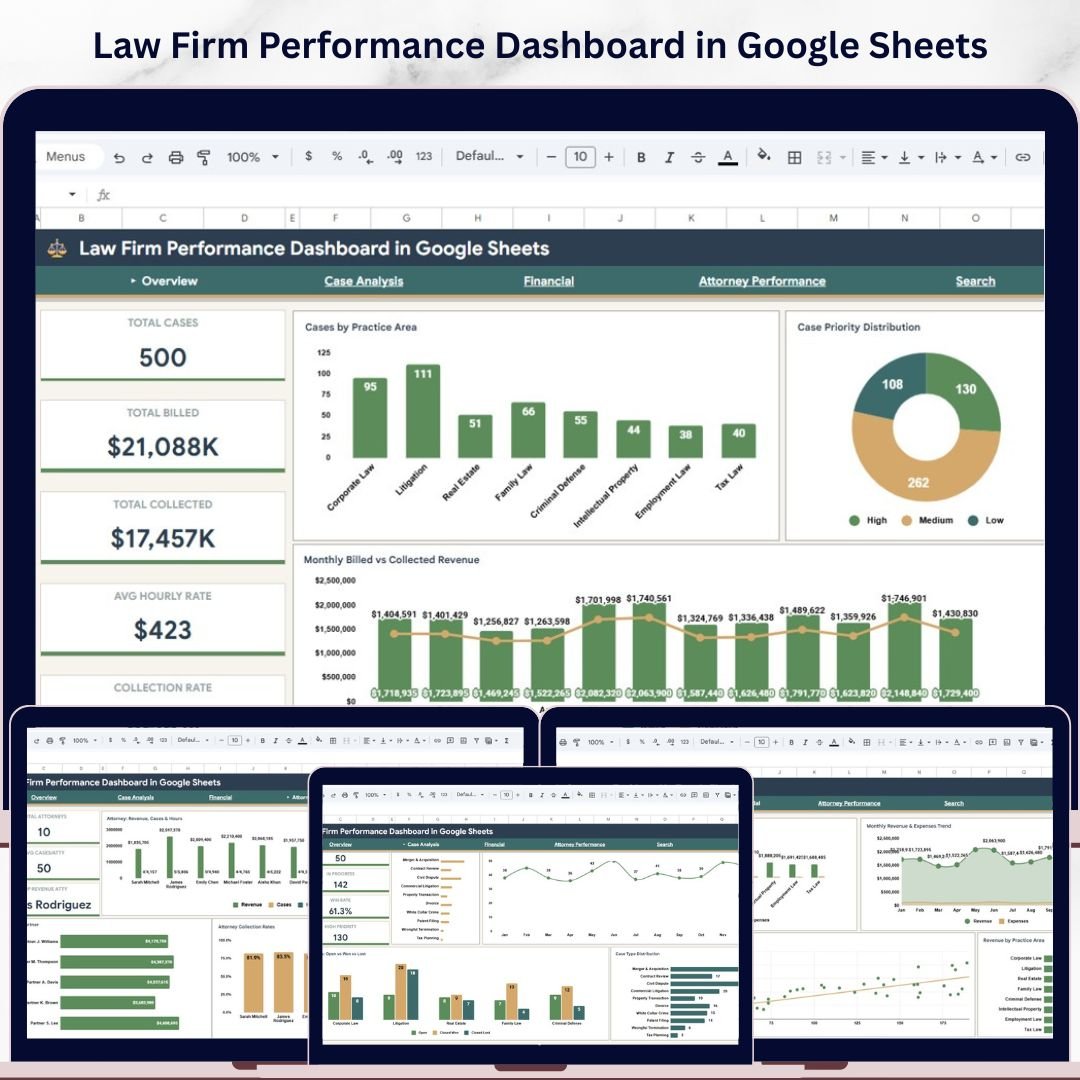


Law Firm Performance Dashboard in Google Sheets is the ultimate cloud-based analytics template built for law firms, legal departments, solo practitioners, and corporate counsel teams who need instant visibility into case management, billing, collections, attorney performance, and financial analysis — all from one interactive Google Sheets dashboard. This template features 6 interactive pages including an Overview, Case Analysis, Financial, Attorney Performance, Search, and Data Sheet — covering every critical dimension of law firm operations with dynamic charts, KPI cards, and slicers that update automatically when you filter your data. 📊💡
Whether you manage a boutique litigation firm or a full-service corporate law practice, this Google Sheets dashboard delivers instant clarity on collection rates, billed vs collected revenue, case priority distribution, and attorney revenue rankings. Simply make a copy to your Google Drive, replace the sample data with your own case records, and watch every chart and KPI update automatically. If you prefer Excel or Power BI, check out the Law Firm Performance Dashboard in Excel or the Law Firm Performance Dashboard in Power BI for alternative platforms.
🔑 Key Features of Law Firm Performance Dashboard in Google Sheets
✅ 6 interactive dashboard pages including Overview, Case Analysis, Financial, Attorney Performance, Search, and Data Sheet provide a 360-degree view of your law firm operations directly in Google Sheets.
✅ High-level KPI cards on the Overview page display Total Cases, Total Billed, Total Collected, Avg Hourly Rate, and Collection Rate — giving you an instant snapshot of firm health.
✅ Dynamic charts across all pages analyze Cases by Practice Area, Case Priority Distribution, Case Status Distribution, Monthly Billed vs Collected Revenue, Revenue vs Expenses by Practice Area, Attorney Revenue Ranking, and more — all updating automatically with slicer filters.
✅ Multiple slicers on the Overview page let you filter the entire dashboard instantly by practice area, case status, priority level, or time period for targeted drill-down analysis.
✅ Case Analysis page provides deeper insights into Cases by Month, Open vs Closed Won vs Closed Lost by Practice Area, and Case Type Distribution — helping you identify workload patterns and case outcomes.
✅ Financial page tracks Revenue vs Expenses by Practice Area, Monthly Revenue and Expenses Trend, Hours Billed vs Revenue Correlation, and Revenue by Practice Area — essential for profitability monitoring.
✅ Attorney Performance page evaluates Attorney Revenue, Cases, and Hours by Attorney, Attorney Revenue Ranking, Revenue by Partner, and Attorney Collection Rates — perfect for performance reviews and compensation planning.
✅ Search page allows quick Case Lookup by Case ID with a Search Results Table filtered by Practice Area for instant record retrieval.
✅ Cloud-based collaboration — since the dashboard runs in Google Sheets, multiple team members can access, update, and analyze data simultaneously from anywhere.
✅ No software installation required — works in any modern browser with a Google account. No macros, no plugins, no Excel license needed.
📦 What’s Inside the Law Firm Performance Dashboard in Google Sheets
This Google Sheets template includes 6 fully designed sheet tabs covering every aspect of law firm analytics. The dashboard tracks 5 core KPIs and features over 15 analytical charts across all pages.
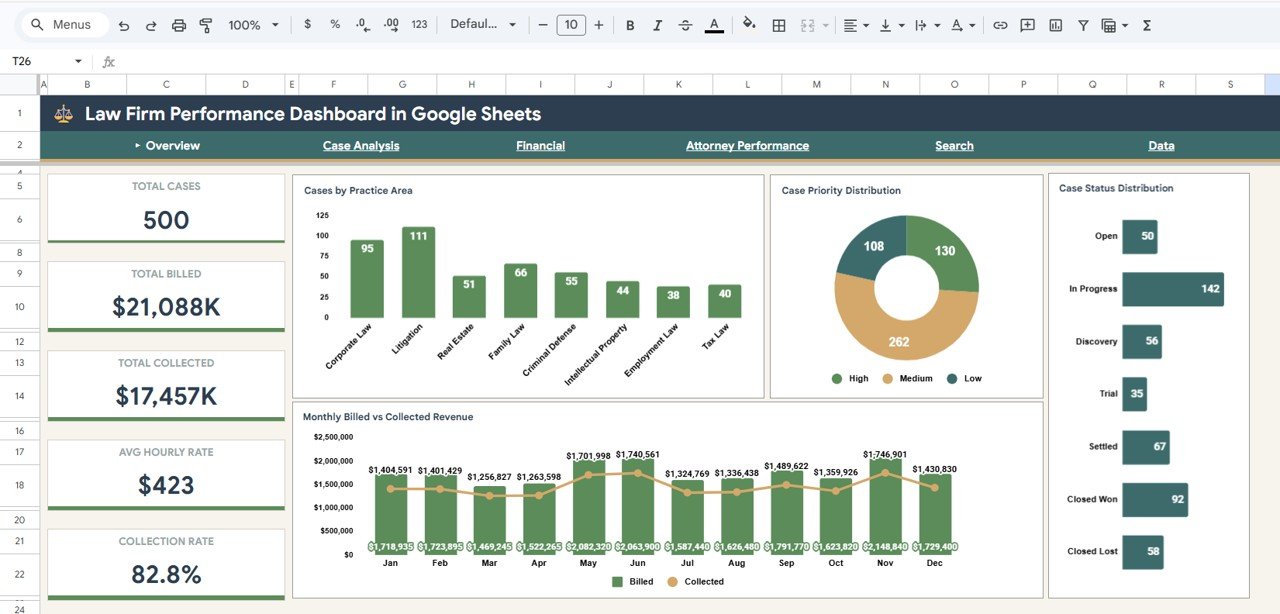
1️⃣ Overview Page — Your Law Firm Command Center
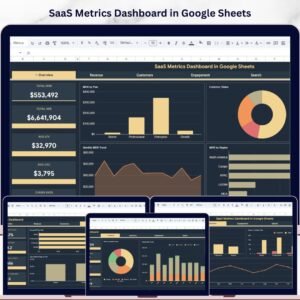
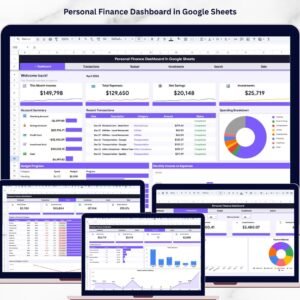
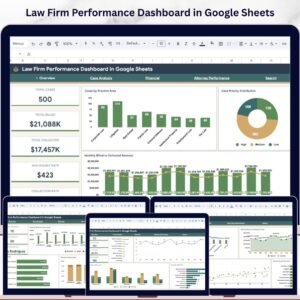
The Overview Page provides a high-level snapshot of your entire law firm performance. At the top, you see KPI cards displaying Total Cases, Total Billed, Total Collected, Avg Hourly Rate, and Collection Rate. Below, dynamic charts visualize Cases by Practice Area to pinpoint workload distribution, Case Priority Distribution by Priority Level to understand case urgency, Case Status Distribution by Status to track open and closed cases, and Monthly Billed vs Collected Revenue by Month to identify billing trends and collection gaps. Multiple slicers let you filter the entire dashboard instantly.

Law Firm Performance Dashboard in Google Sheets
2️⃣ Case Analysis Page
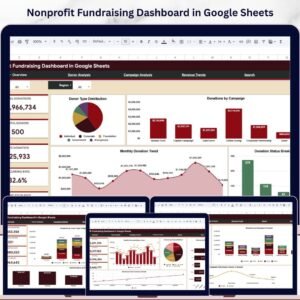
This sheet tab provides deeper case-level insights. It features charts showing Cases by Month to track case volume trends over time, Open vs Closed Won vs Closed Lost by Practice Area to evaluate case outcomes across different legal specialties, and Case Type Distribution by Case Type to understand the mix of litigation, advisory, compliance, and other case categories your firm handles.
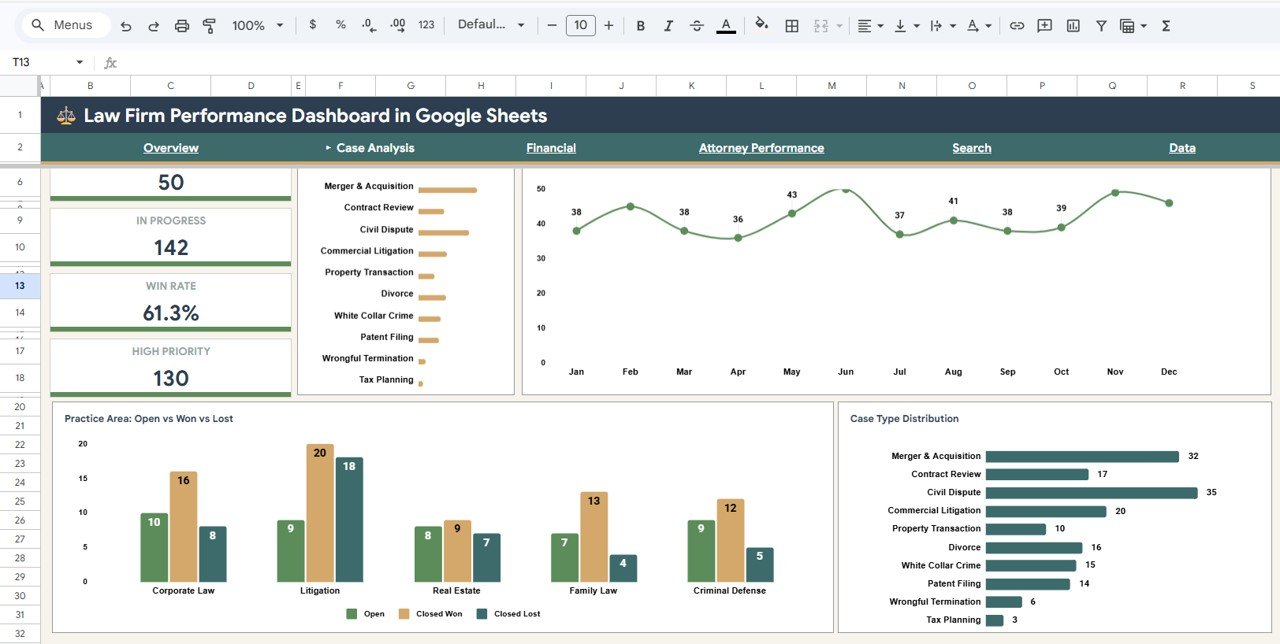
Case Analysis Page
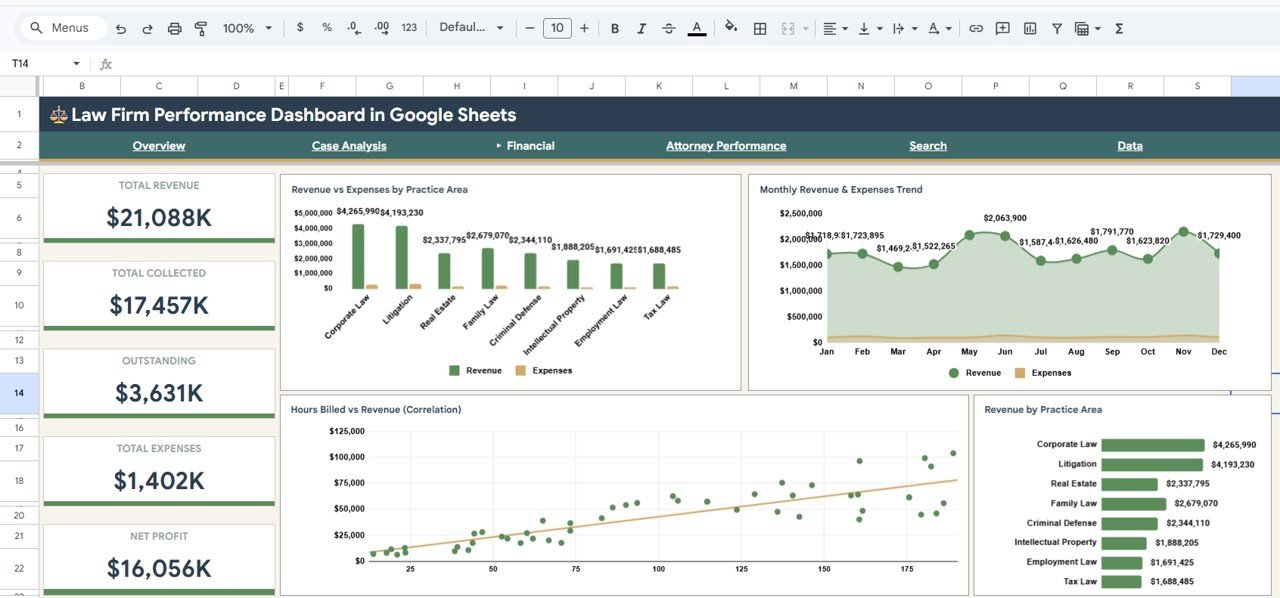
3️⃣ Financial Page
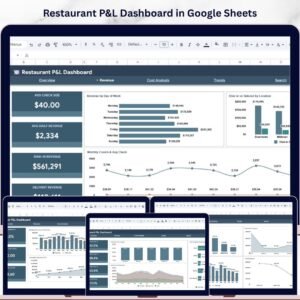
This sheet tab focuses on the financial health of your law firm. It includes Revenue vs Expenses by Practice Area to compare profitability across legal specialties, Monthly Revenue and Expenses Trend by Month to spot seasonal patterns and cost spikes, Hours Billed vs Revenue Correlation to evaluate billing efficiency, and Revenue by Practice Area to identify your top revenue-generating practice areas.

Financial Page
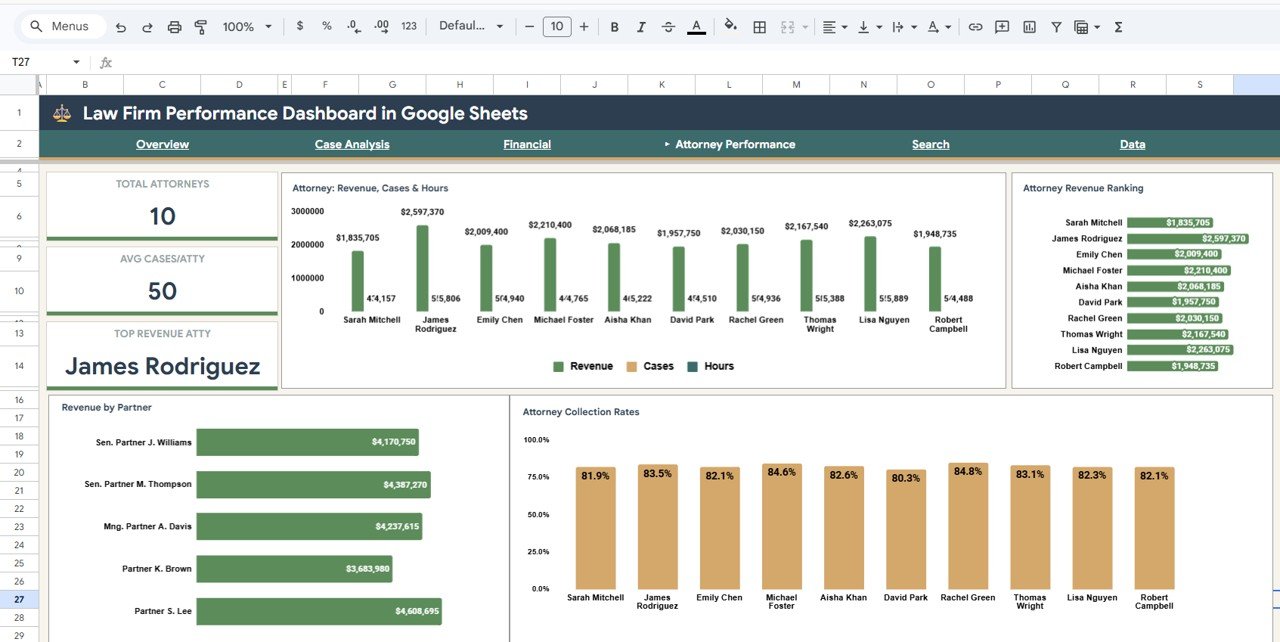
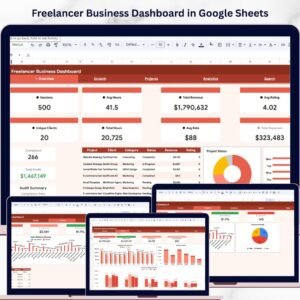
4️⃣ Attorney Performance Page
This sheet tab evaluates individual attorney contributions. It features Attorney Revenue, Cases and Hours by Attorney for a comprehensive performance overview, Attorney Revenue Ranking by Attorney to identify top earners, Revenue by Partner to track partner-level billing, and Attorney Collection Rates by Attorney to measure who converts billed amounts into actual collections most effectively.

Attorney Performance Page
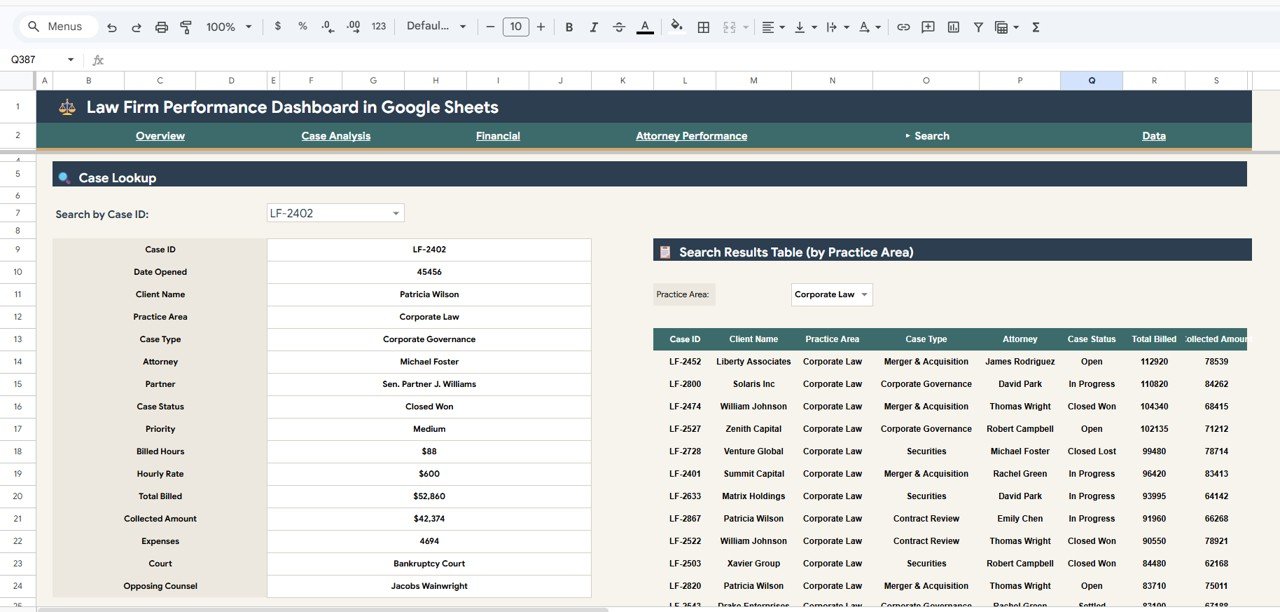
5️⃣ Search Page
This sheet tab provides a quick lookup feature. It includes Case Lookup by Case ID for instant access to specific case records and a Search Results Table by Practice Area that displays filtered results based on your search criteria. This is ideal for client meetings or quick case reviews.

Search Page
6️⃣ Data Sheet Tab
This is the central data repository where you enter all your law firm case records. Simply add your data in the same column format — including Case ID, Practice Area, Case Type, Priority, Status, Attorney, Billed Amount, Collected Amount, Hourly Rate, Hours, Expenses, and more. All dashboard pages read from this single data source and update automatically.
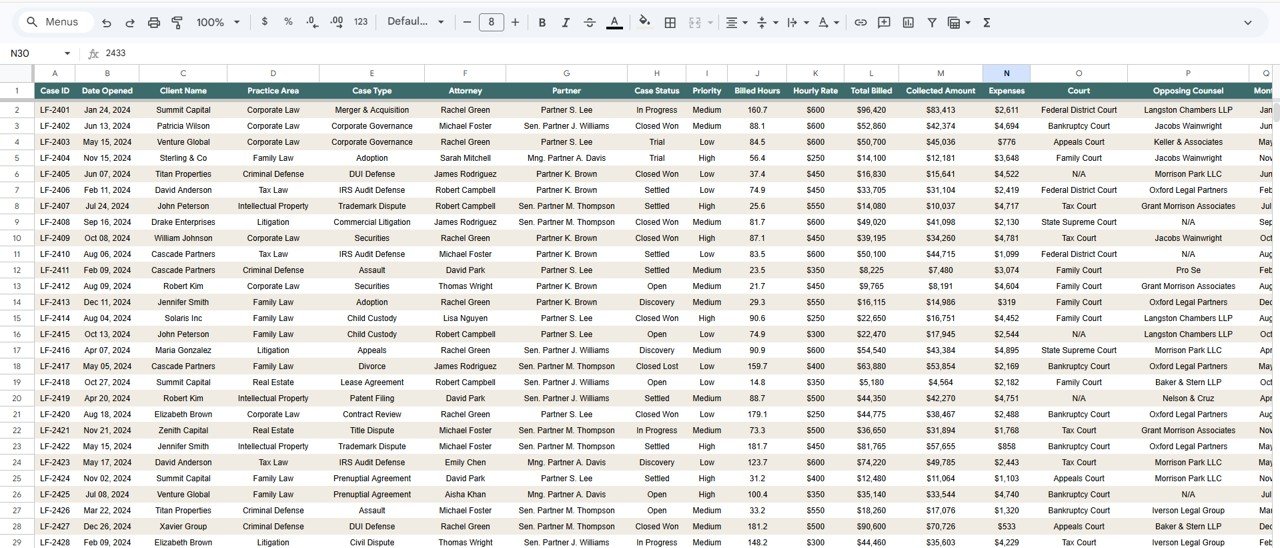
Data Sheet Tab
⚙️ How to Use the Law Firm Performance Dashboard in Google Sheets
1️⃣ Download the PDF guide from your purchase and click the Google Sheets copy link inside to create your own editable copy in Google Drive.
2️⃣ Navigate to the Data Sheet tab and review the sample data to understand the expected column structure.
3️⃣ Replace the sample data with your own law firm case records in the same format.
4️⃣ Return to the Overview page and use the slicers to filter by practice area, case status, priority, or time period.
5️⃣ Explore each of the 6 dashboard pages for targeted insights on cases, finances, attorney performance, and case search.
6️⃣ Share the Google Sheet with your team for real-time collaborative access and reporting.
👥 Who Can Benefit from This Law Firm Performance Dashboard
📌 Managing partners tracking firm-wide billing, collections, and collection rates across practice areas and offices
📌 Law firm administrators monitoring attorney productivity, billable hours, and revenue rankings
📌 Solo practitioners analyzing case profitability, case type distribution, and monthly billing patterns
📌 Legal operations managers evaluating practice area revenue, expenses, and financial trends
📌 Finance teams in corporate legal departments tracking billed vs collected revenue and cost variance
📌 Legal consultants providing performance dashboards and benchmarking reports to law firm clients
Explore more analytics solutions in our Google Sheets Dashboard Templates collection.
❓ Frequently Asked Questions
What KPIs does the Law Firm Performance Dashboard in Google Sheets track?
The Law Firm Performance Dashboard in Google Sheets tracks 5 key performance indicators on the Overview page: Total Cases, Total Billed, Total Collected, Avg Hourly Rate, and Collection Rate. Additional analysis across 5 more pages covers case volume trends, practice area profitability, attorney performance rankings, and financial correlations.
Do I need advanced Google Sheets skills to use this dashboard?
No. Simply make a copy of the template to your Google Drive using the link in the PDF guide, replace the sample data with your own records, and all charts and KPIs update automatically. No formulas to edit, no scripts to run.
Can I share this dashboard with my team?
Yes. Since this is a Google Sheets template, you can share it with any number of team members. Multiple people can view and update the dashboard simultaneously in real time from any device with a browser.Law Firm Performance Dashboard in Google Sheets
How many dashboard pages are included in this template?
This template includes 6 interactive pages — Overview, Case Analysis, Financial, Attorney Performance, Search, and Data Sheet — each designed to provide focused insights into different aspects of law firm operations and performance.Law Firm Performance Dashboard in Google Sheets
Is this template available in Excel or Power BI?
Yes. NextGenTemplates offers the Law Firm Performance Dashboard in Excel (ID 67474) and Law Firm Performance Dashboard in Power BI (ID 67517) as well. Visit our website to explore all available formats.Law Firm Performance Dashboard in Google Sheets
What is the best Google Sheets dashboard for tracking law firm performance?
The Law Firm Performance Dashboard in Google Sheets from NextGen Templates is one of the most comprehensive cloud-based options available. It covers billing, collections, case analysis, attorney performance, financial trends, and case search across 6 interactive pages with dynamic filtering and real-time collaboration.
🔗 Explore Related Templates
📌 Law Firm Performance Dashboard in Excel — Same powerful law firm analytics built entirely in Excel with pivot tables and slicers.
📌 Law Firm Performance Dashboard in Power BI — Advanced law firm analytics with interactive Power BI visuals and DAX-driven measures.
📌 Legal Dashboard in Google Sheets — Track general legal cases, costs, and lawyer performance in Google Sheets.


Reviews
There are no reviews yet.