
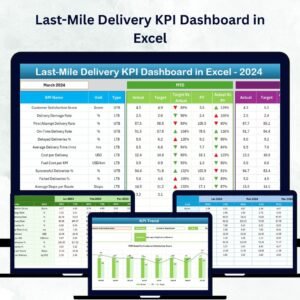
In the competitive world of e-commerce and logistics, the last-mile delivery stage is where customer satisfaction is truly decided. This is the point where your product leaves the hub and reaches the customer’s doorstep — fast, reliable, and error-free delivery defines success.Last-Mile Delivery KPI Dashboard in Excel
The Last-Mile Delivery KPI Dashboard in Excel is your all-in-one solution to monitor, measure, and optimize delivery performance. This ready-to-use Excel dashboard transforms raw logistics data into actionable insights that help you cut costs, improve efficiency, and deliver exceptional customer experiences — without the need for complex software or coding.Last-Mile Delivery KPI Dashboard in Excel
Key Features of Last-Mile Delivery KPI Dashboard in Excel
🚀 Real-Time Performance Tracking – Monitor all key metrics such as delivery accuracy, average delivery time, cost per shipment, and customer satisfaction in real time.
📊 Interactive Dashboard – Instantly switch between Month-to-Date (MTD) and Year-to-Date (YTD) views with easy dropdowns and dynamic visuals.
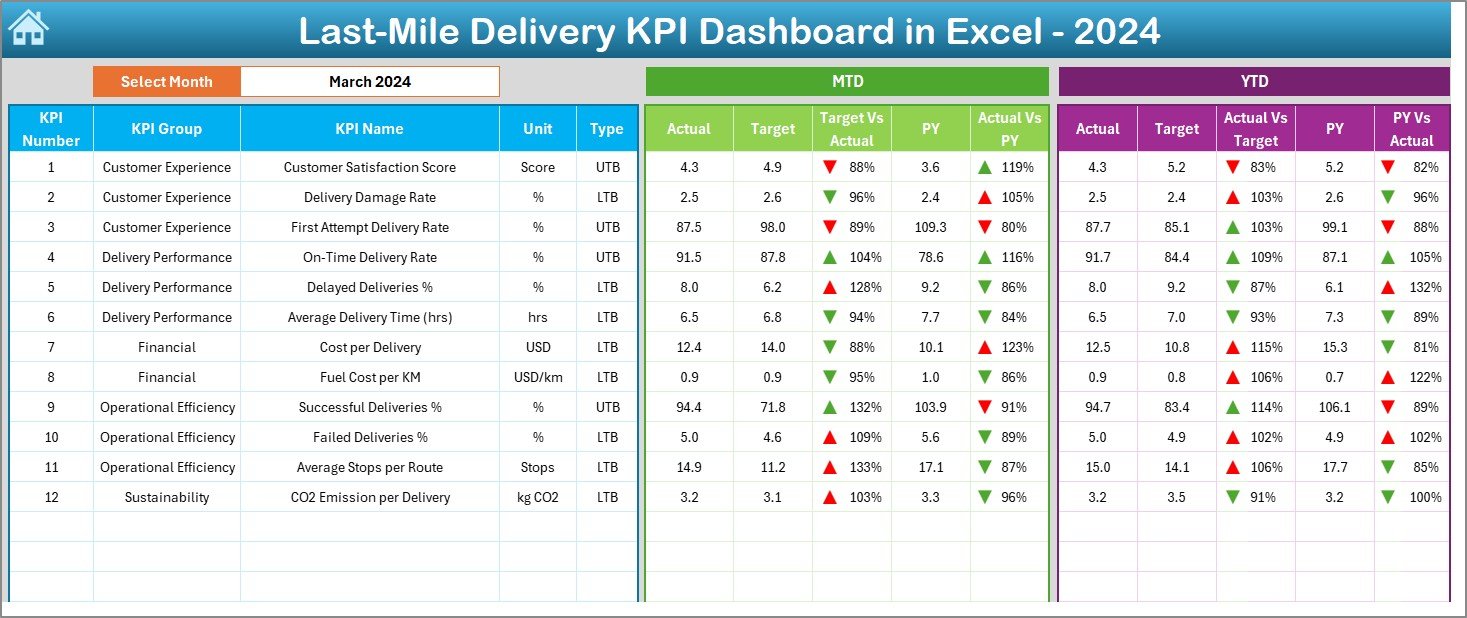
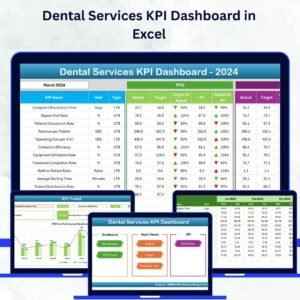
🎯 Target vs Actual Comparison – Visualize where performance meets or misses expectations using intuitive color-coded arrows and indicators.
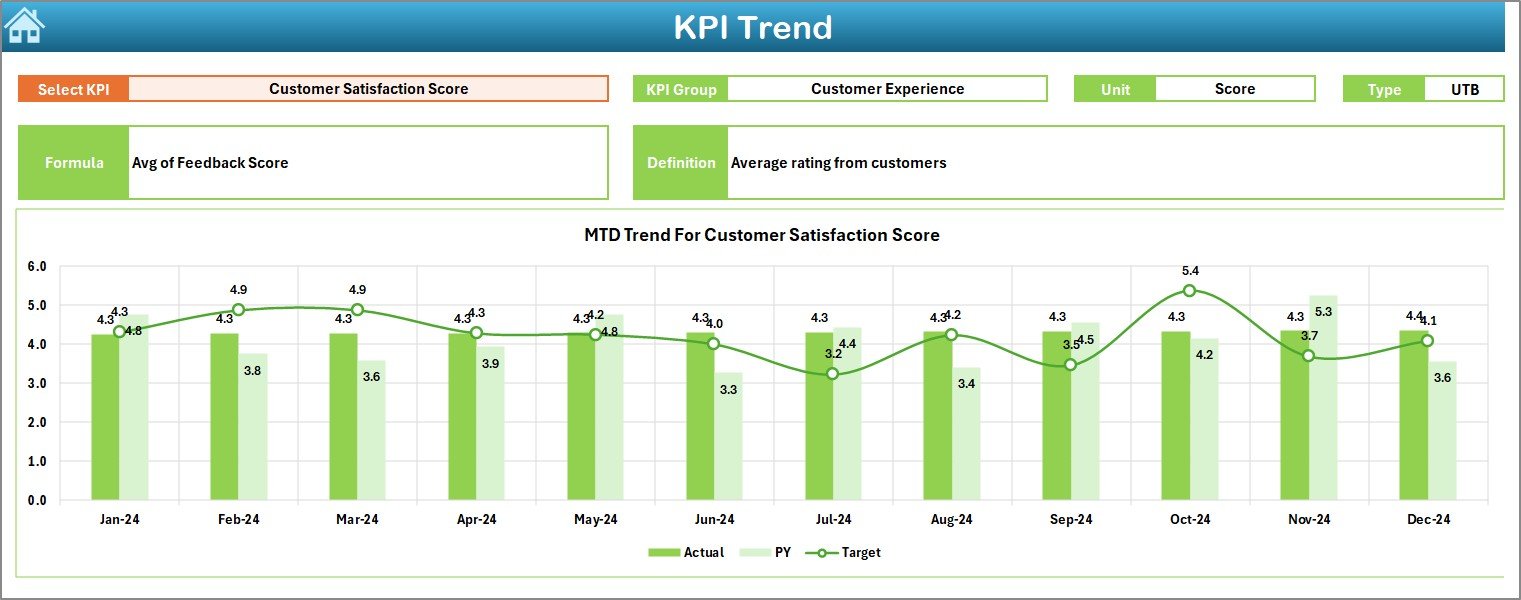
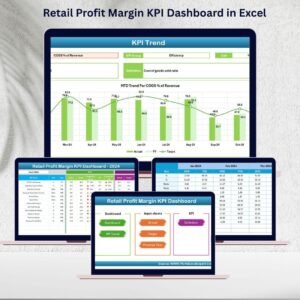
📈 Trend Analysis – Use the KPI Trend Sheet to analyze month-wise improvements, spot patterns, and identify seasonal performance changes.
⚙️ Fully Customizable Design – Modify KPIs, formulas, and visuals to align perfectly with your logistics or e-commerce operations.
💡 Automated Visual Indicators – Built-in conditional formatting highlights performance improvement or decline at a glance.
📂 Professional and Easy Navigation – The Home Sheet includes navigation buttons to jump directly to the Dashboard, KPI Trend, Target, or Definition pages — making it user-friendly even for non-technical users.
💰 Cost Efficiency Insights – Identify high-cost routes, delayed deliveries, or underperforming delivery partners through data-backed visuals.
🧮 No Subscription Needed – Built entirely in Excel, this dashboard offers enterprise-grade insights without recurring software costs.
What’s Inside the Last-Mile Delivery KPI Dashboard
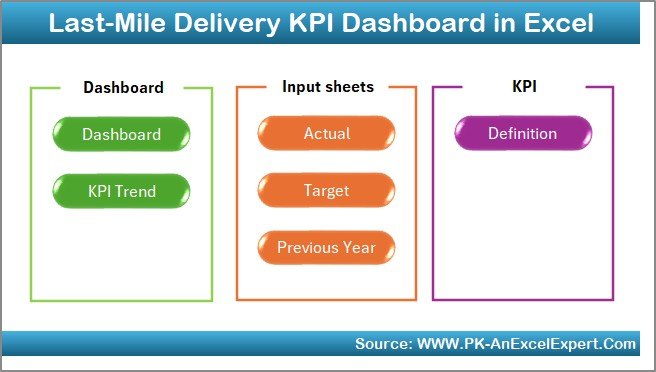
This Excel dashboard comes with seven powerful worksheets, each carefully designed for clarity and functionality:
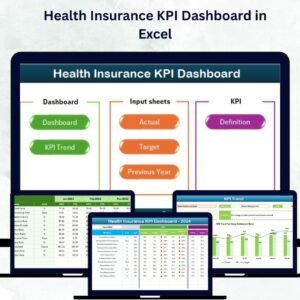
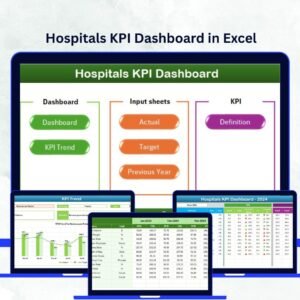
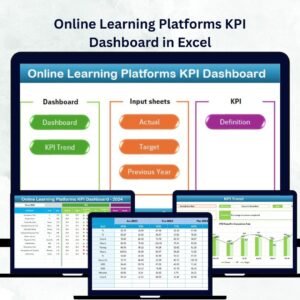
1️⃣ Home Sheet: Acts as the central hub with navigation buttons for quick access to other sections.
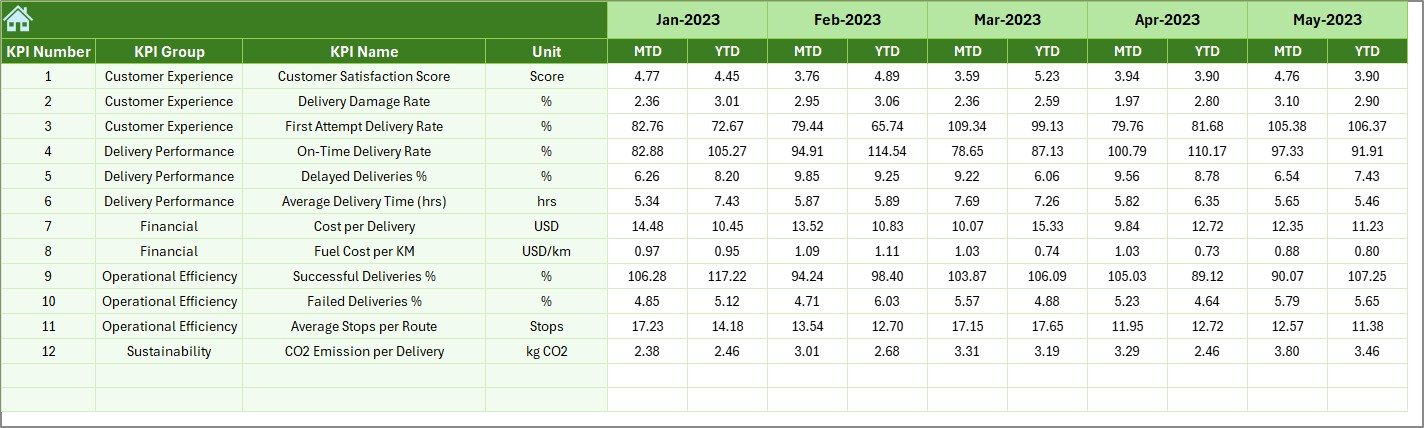
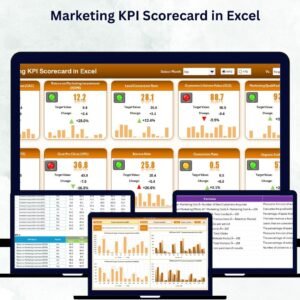
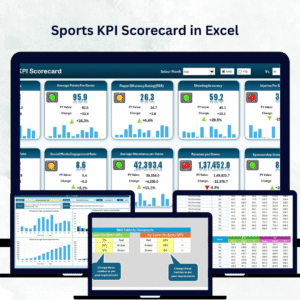
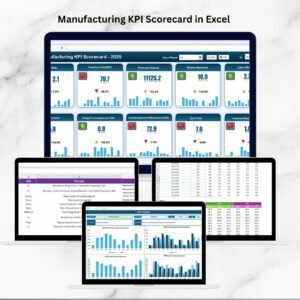
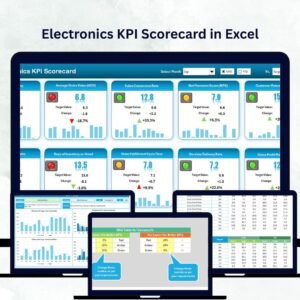
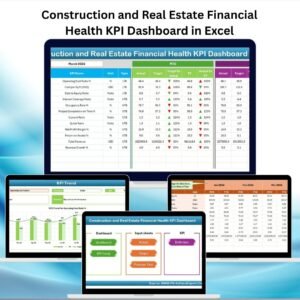
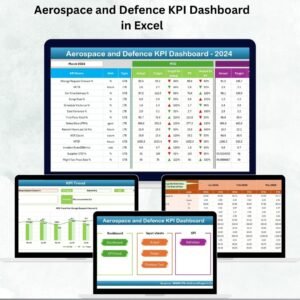
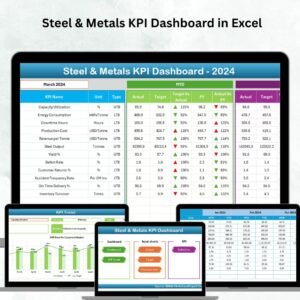
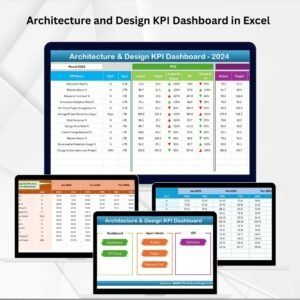
2️⃣ Dashboard Sheet: Displays MTD and YTD comparisons for all major KPIs, with arrows and visuals for trend interpretation.
3️⃣ KPI Trend Sheet: Enables deep analysis of individual KPIs by showing monthly charts and performance variations.
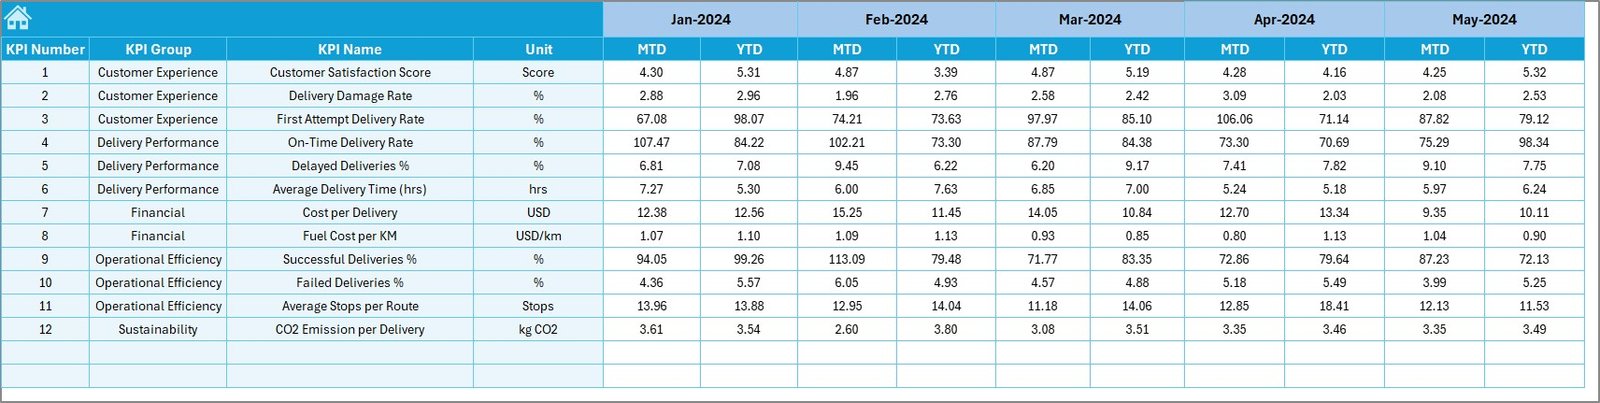
4️⃣ Actual Numbers Input Sheet: Where you enter monthly actuals for both MTD and YTD values.
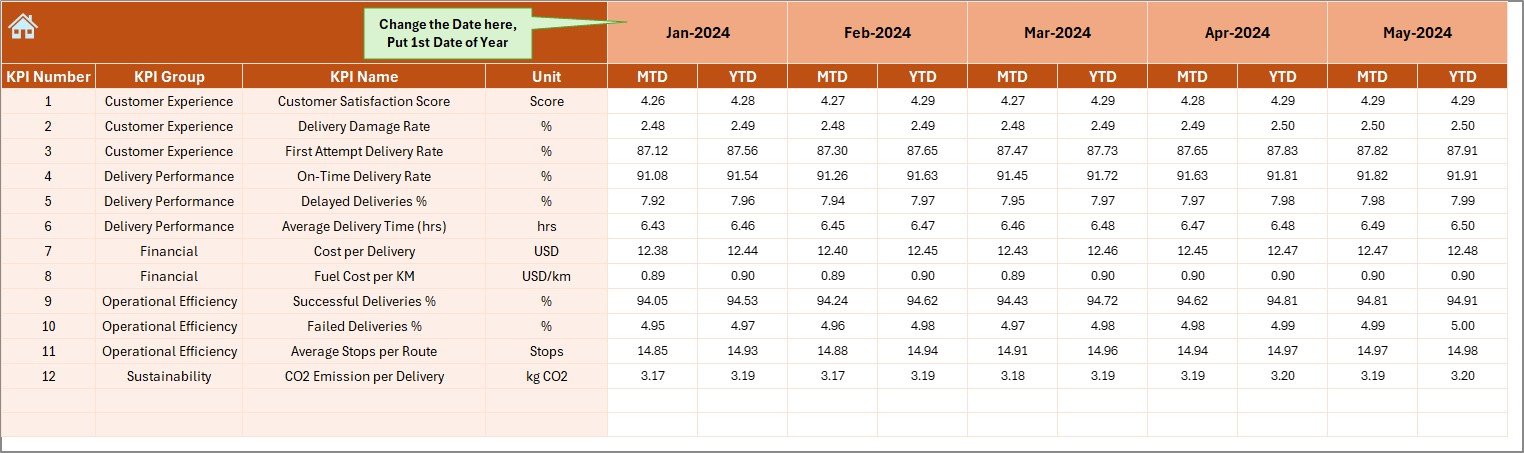
5️⃣ Target Sheet: Helps define monthly and yearly targets for each KPI.
6️⃣ Previous Year Sheet: Stores past performance data to measure year-over-year improvement.
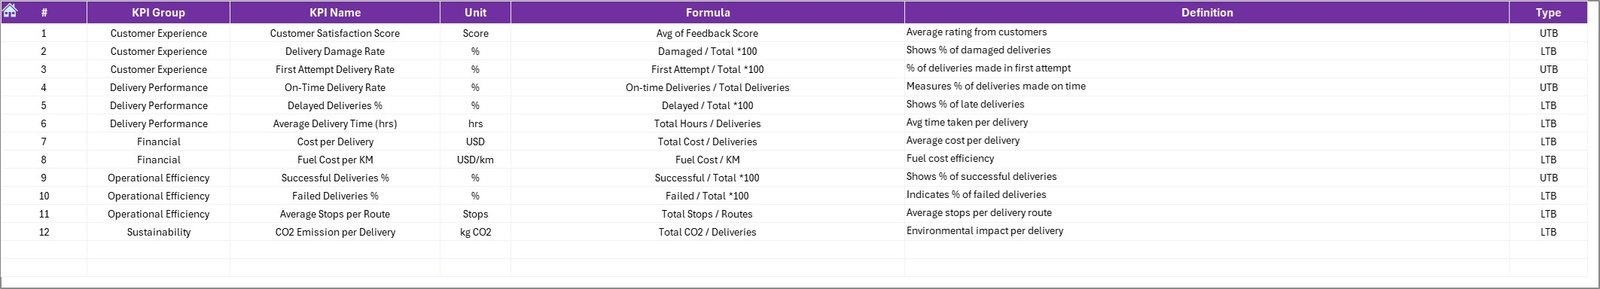
7️⃣ KPI Definition Sheet: Lists all KPIs with units, formulas, and definitions for reference and consistency.
Each tab is interlinked, ensuring automatic updates throughout the file when data is entered.
How to Use the Last-Mile Delivery KPI Dashboard
🪜 Step 1: Enter actual monthly data for all KPIs in the “Actual Numbers Input” sheet.
🎯 Step 2: Set your monthly and yearly goals in the “Target” sheet.
📆 Step 3: Add previous year’s data for comparison.
🏠 Step 4: Use the “Home” sheet buttons to navigate easily.
📊 Step 5: View instant insights on the “Dashboard” tab by selecting a specific month.
📉 Step 6: Explore trends in the “KPI Trend” sheet to identify long-term opportunities for improvement.
Who Can Benefit from This Dashboard
💼 Logistics Managers – Monitor delivery routes, performance, and efficiency with real-time insights.
🏬 E-Commerce Operations Teams – Track courier performance, delays, and customer delivery satisfaction.
🚚 Delivery Partners & Couriers – Evaluate delivery times, missed orders, and optimize resource utilization.
📦 Supply Chain Planners – Improve route optimization, vehicle utilization, and cost management.
📊 Business Analysts – Visualize trends and derive actionable insights for strategic decision-making.
🌍 Small to Medium Enterprises – Access a cost-effective yet powerful tool to professionalize logistics performance management.


Reviews
There are no reviews yet.