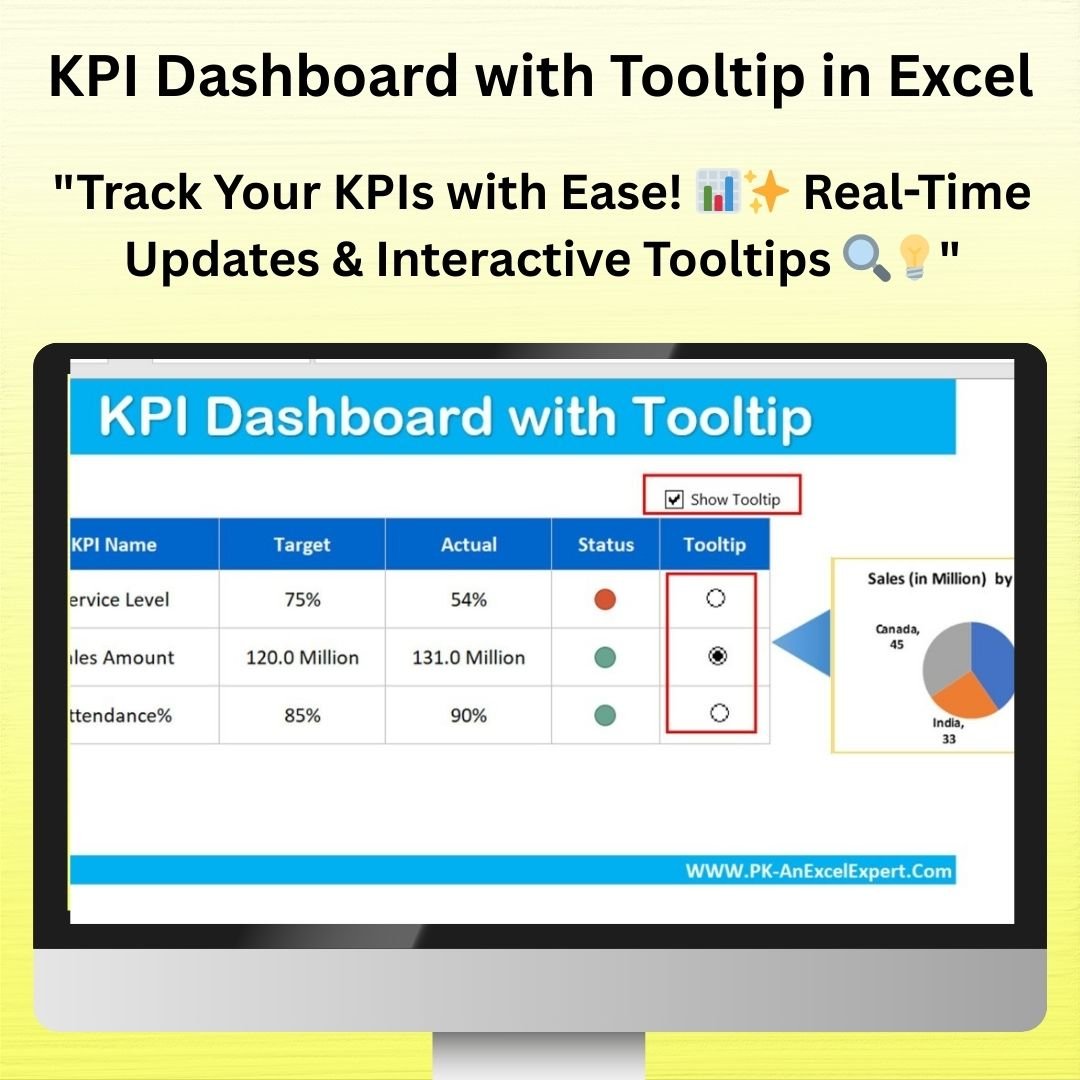

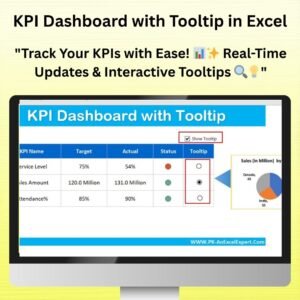
The KPI Dashboard with Tooltip in Excel is a highly effective and user-friendly tool designed to help businesses track and visualize key performance indicators (KPIs) in an intuitive and interactive manner. This template integrates tooltips to provide additional details for each KPI, allowing users to hover over data points and instantly view more information, without overcrowding the dashboard. Whether you’re tracking sales performance, project milestones, or any other metrics, this tool helps you create a clear, visually engaging dashboard.
With interactive features like tooltips, real-time data updates, and customizable KPIs, this Excel dashboard offers a sophisticated solution for performance monitoring and reporting. Its intuitive design ensures that users can easily interpret the data, make informed decisions, and present it effectively to stakeholders.

Key Features of the KPI Dashboard with Tooltip in Excel
📌 Interactive KPI Dashboard
This dashboard provides a clear, at-a-glance view of key performance metrics, complete with tooltips that offer additional details when you hover over a KPI. This keeps your dashboard uncluttered while still providing all the information you need.
🛠 Customizable KPIs
Easily adjust the KPIs to track the metrics that matter most to your business. Whether you’re monitoring sales, financial performance, project milestones, or customer satisfaction, you can tailor the dashboard to meet your specific needs.
💡 Tooltip Functionality
Hover over any KPI to view a detailed tooltip that provides more context about the data. Tooltips help you keep the dashboard clean and concise while still offering important information when needed.
🔢 Real-Time Data Updates
The dashboard automatically updates as new data is entered, ensuring that your KPIs are always up-to-date. This feature helps you monitor performance in real time, making it easy to stay on top of changes and trends.
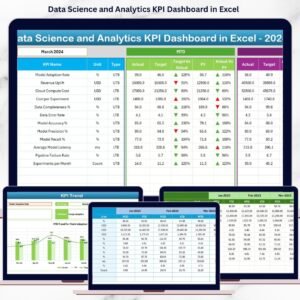
🚀 Dynamic Visualizations
The dashboard includes dynamic charts, graphs, and tables that visually represent your KPIs. Use these visual elements to quickly identify trends, outliers, or performance gaps, allowing you to make better decisions.
📊 Comprehensive Performance Monitoring
Track multiple KPIs simultaneously, and gain insights into how they interact with each other. The dashboard provides an overview of performance across various areas, helping you monitor overall business health.
⚙ Easy Setup and Customization
The template is designed for ease of use, with clear instructions to help you set up and customize the dashboard. No advanced Excel skills are required, so you can get started quickly and effectively.
🚀 Why You’ll Love the KPI Dashboard with Tooltip in Excel
✅ Interactive and Informative – View detailed KPI data with tooltips for additional context. ✅ Customizable KPIs – Track the metrics that matter most to your business. ✅ Real-Time Data – The dashboard updates automatically as data changes. ✅ Dynamic Visualizations – Use charts and graphs to make your KPIs easy to understand. ✅ Simple Setup – Quick and easy customization with clear instructions.
📂 What’s Inside the KPI Dashboard with Tooltip in Excel?
- Interactive KPIs: Easily track and analyze your business performance with detailed tooltips.
- Customizable Data: Adjust the dashboard to fit your specific KPIs and metrics.
- Real-Time Data Updates: Automatically update KPIs as new data is entered.
- Dynamic Visualizations: Visualize your performance with interactive charts and graphs.
- Clear Setup Instructions: Easy steps to customize and implement the dashboard.
🔍 How to Use the KPI Dashboard with Tooltip in Excel
1️⃣ Download the Template – Get instant access to the Excel file upon purchase. 2️⃣ Enter Your Data – Input your business data, and the dashboard will automatically populate with the relevant KPIs. 3️⃣ Customize the KPIs – Adjust the KPIs to match your business goals and metrics. 4️⃣ View Detailed Tooltips – Hover over each KPI to see additional information and insights. 5️⃣ Present and Share – Use the dashboard in meetings, reports, or presentations to showcase your performance metrics.
🎯 Who Can Benefit from the KPI Dashboard with Tooltip in Excel? 🔹 Business Owners 🔹 Project Managers 🔹 Sales Teams 🔹 Marketing Professionals 🔹 Financial Analysts 🔹 Anyone needing to monitor and report on performance metrics
Stay on top of your performance metrics with the KPI Dashboard with Tooltip in Excel. This powerful tool gives you the flexibility to track, visualize, and analyze your KPIs in a clean, interactive, and efficient manner.
Click here to read the Detailed blog post
https://www.pk-anexcelexpert.com/kpi-dashboard-with-tooltip-in-excel/


Reviews
There are no reviews yet.