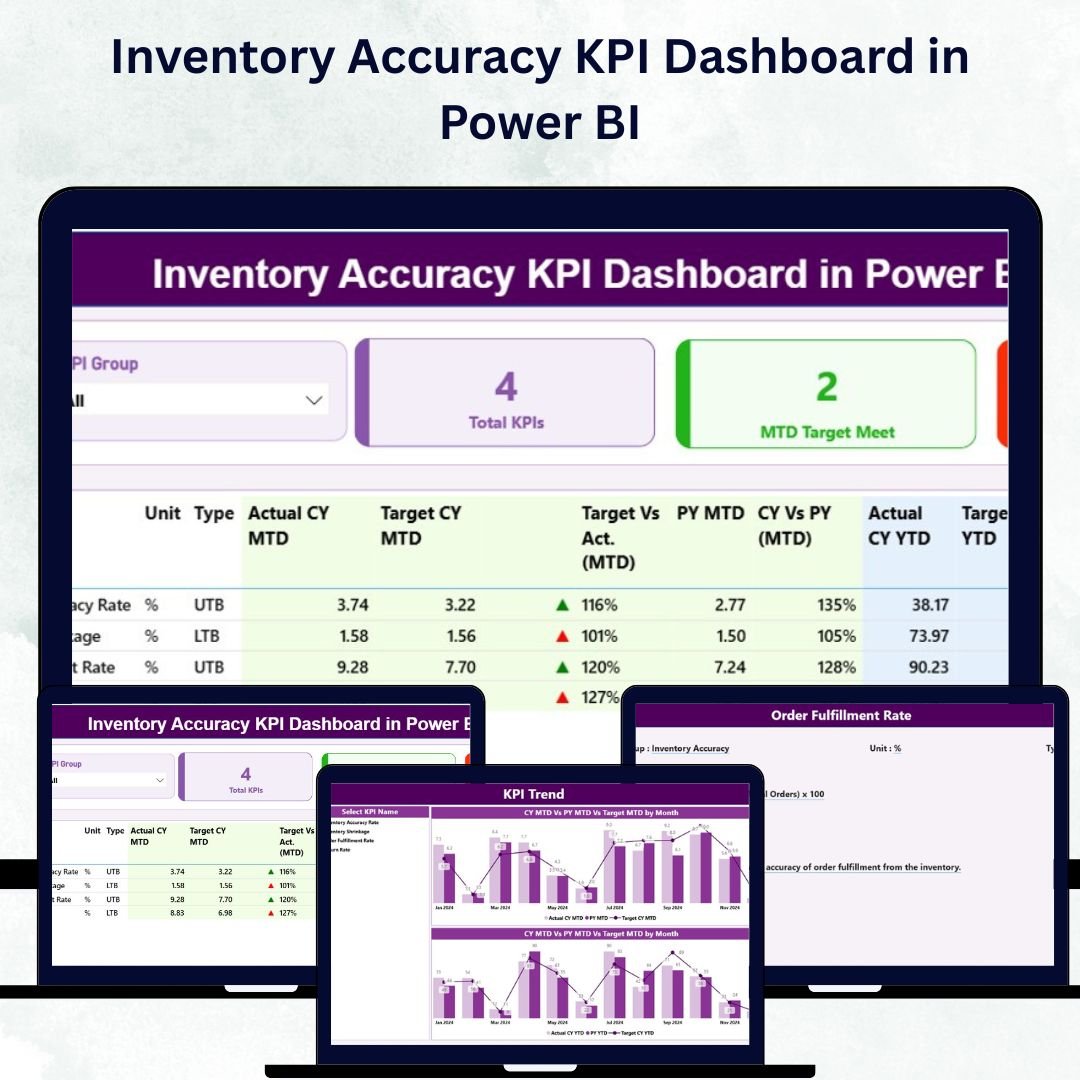
Efficient inventory management is the backbone of every successful retail, logistics, or manufacturing business. The Inventory Accuracy KPI Dashboard in Power BI is a ready-to-use, data-driven tool designed to help organizations monitor inventory accuracy, reduce errors, and optimize warehouse performance — all through clear, interactive visuals.
Built on Microsoft Power BI and powered by an Excel data source, this dashboard brings together real-time insights on key metrics like inventory accuracy, order fulfillment rate, shrinkage, and stockout frequency. It’s designed for warehouse managers, supply chain heads, and operations leaders who want to make faster, smarter, and data-backed decisions.
With its user-friendly interface and dynamic visuals, the dashboard replaces manual Excel reports with automation, transparency, and precision — ensuring that every inventory decision is driven by accurate, up-to-date data.
⚙️ Key Features of the Inventory Accuracy KPI Dashboard in Power BI
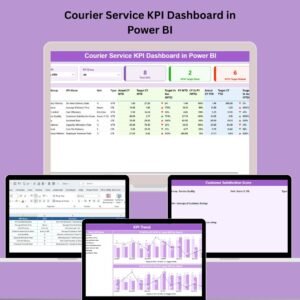
📊 Summary Page – Instant Performance Overview
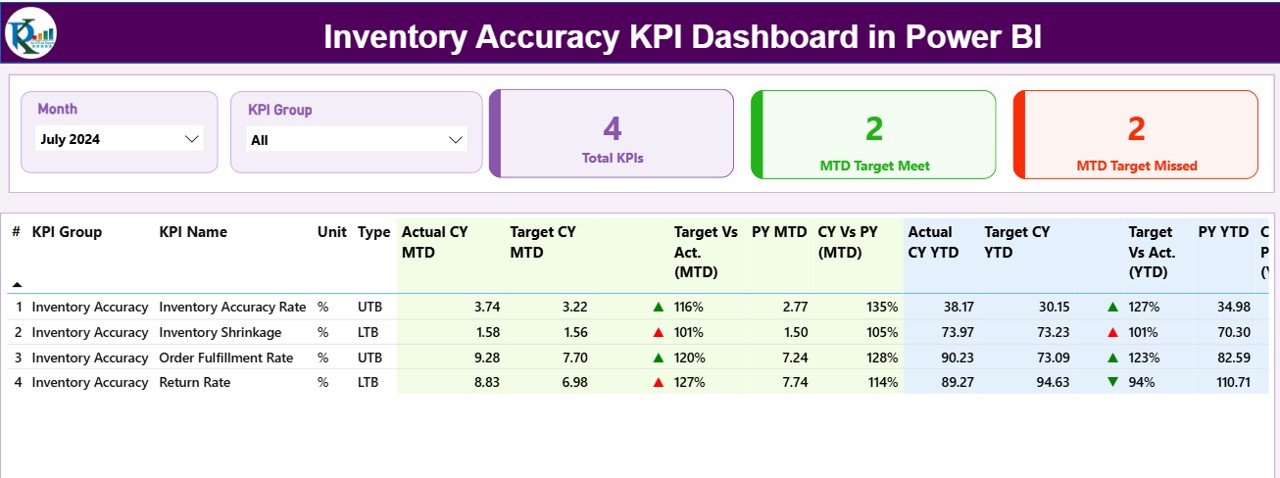
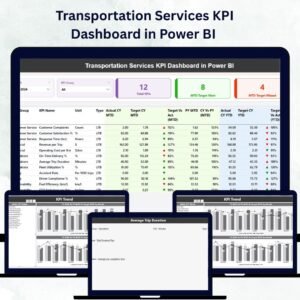
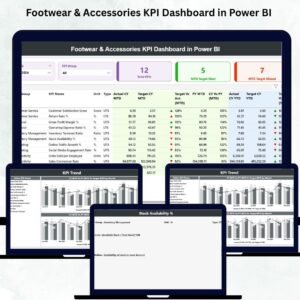
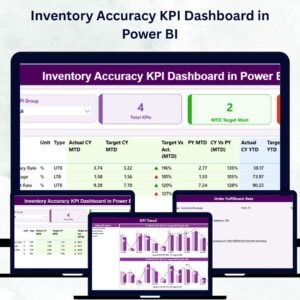
The Summary Page provides a high-level view of all KPIs, allowing you to assess inventory performance at a glance.
🔹 Top KPI Cards:
-
Total KPIs Count
-
MTD Target Met Count
-
MTD Target Missed Count
🔹 Interactive Slicers:
-
Filter by Month or KPI Group to focus on specific time periods or categories.
🔹 Detailed KPI Table:
This comprehensive table displays:
-
KPI Number, Group, and Name
-
Unit and Type (LTB or UTB)
-
Actual vs Target (MTD/YTD)
-
Previous Year Comparisons
-
Visual Performance Icons (Green ▲ / Red ▼)
Together, these visuals provide a real-time snapshot of how your warehouse is performing and where improvements are needed.
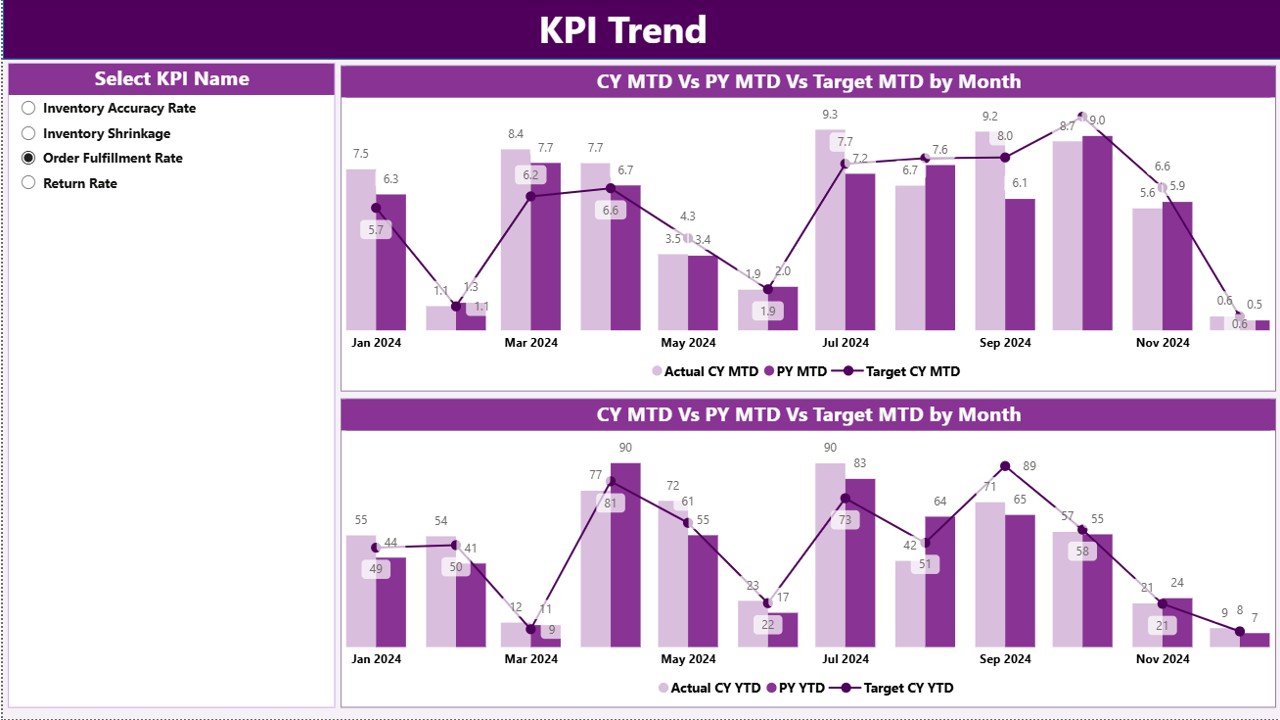
📈 KPI Trend Page – Deep Data Insights
The KPI Trend Page focuses on tracking performance trends over time.
It features two combo charts comparing:
-
Actual vs Target vs Previous Year (MTD)
-
Actual vs Target vs Previous Year (YTD)
A slicer on the left lets you select any KPI for a detailed, interactive trend analysis.
Use it to identify recurring issues, seasonal changes, and performance growth across months or years.
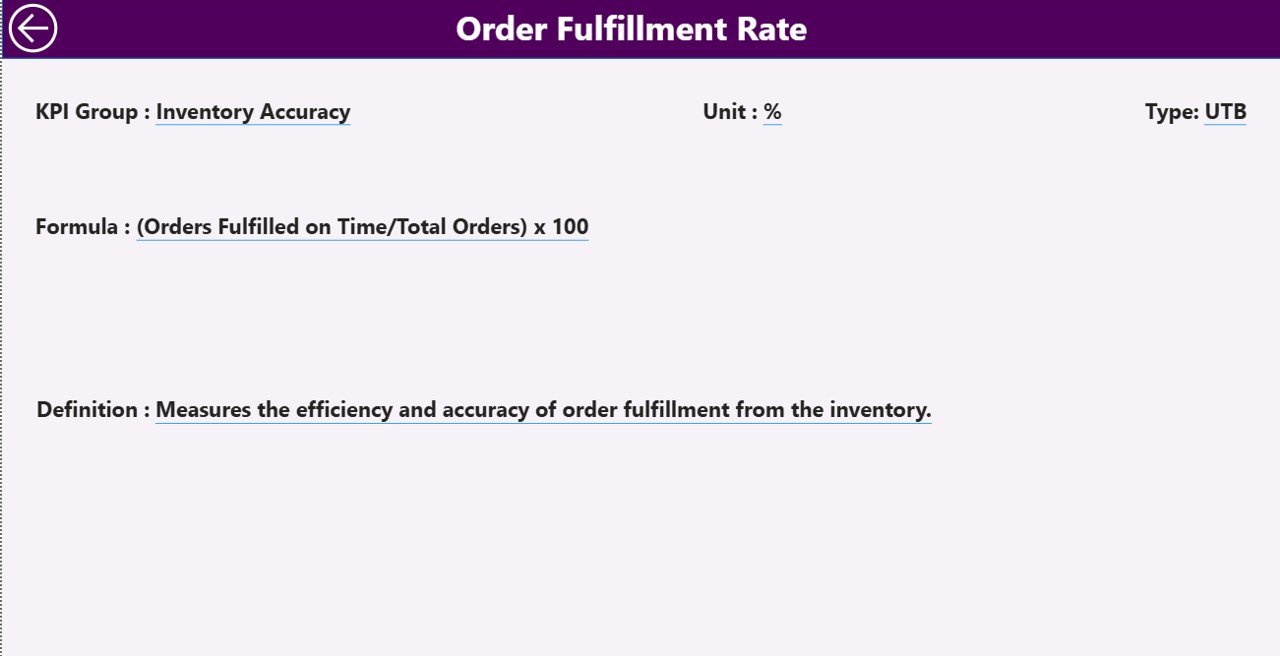
🧩 KPI Definition Page – Clear Metric Understanding
Transparency is key to effective KPI management. The KPI Definition Page provides detailed explanations for each KPI.
Simply right-click any KPI on the Summary Page and choose Drill Through to view:
-
KPI Formula
-
KPI Definition
-
Unit of Measurement
-
KPI Type (UTB/LTB)
A convenient Back Button allows quick navigation back to the main dashboard.
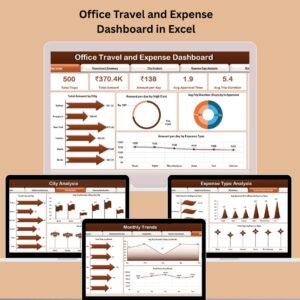
📊 Excel Data Structure Behind the Dashboard
This Power BI dashboard connects directly to an Excel workbook containing three main sheets:
1️⃣ Input_Actual Sheet:
Captures actual monthly KPI data.
Columns: KPI Name, Month, MTD Value, YTD Value.
2️⃣ Input_Target Sheet:
Stores monthly and yearly target values.
Columns: KPI Name, Month, MTD Target, YTD Target.
3️⃣ KPI Definition Sheet:
Defines each KPI and its metadata.
Columns: KPI Number, Group, Name, Unit, Formula, Definition, Type.
Once linked, Power BI automatically pulls and refreshes this data to display live visuals — no manual updates required.
🧭 How the Dashboard Works
✅ Step 1: Enter KPI data into the Excel source sheets (Actual, Target, Definition).
✅ Step 2: Connect the Excel file to Power BI.
✅ Step 3: Use Power Query to clean and transform data.
✅ Step 4: Explore the dashboard pages using slicers and filters.
✅ Step 5: Analyze trends and make data-backed decisions.
Within minutes, you’ll have an automated reporting system that updates in real time — turning static data into powerful analytics.
💡 Advantages of the Inventory Accuracy KPI Dashboard in Power BI
1️⃣ Real-Time Insights
Instantly see where your KPIs stand. As soon as Excel data updates, Power BI refreshes visuals automatically.
2️⃣ Data Accuracy and Consistency
Standardized KPI definitions eliminate confusion and ensure consistent reporting across teams.
3️⃣ Faster Decision-Making
Color-coded icons and comparisons make it easy to identify bottlenecks and underperforming areas.
4️⃣ Historical Trend Analysis
Track MTD and YTD trends against previous year benchmarks for continuous improvement.
5️⃣ Easy Integration
Connects seamlessly with Excel — no coding or external database setup needed.
6️⃣ Scalable Design
Add new KPIs or modify targets easily as your business evolves.
7️⃣ Visual Clarity
Clear visuals, slicers, and cards make the dashboard easy to interpret even for non-technical users.
📦 Why Inventory Accuracy Matters
Accurate inventory data leads to:
✅ Fewer stock discrepancies
✅ Lower carrying costs
✅ Reduced write-offs and shrinkage
✅ Improved customer satisfaction
✅ Reliable financial reporting
By improving accuracy, businesses can boost efficiency, profitability, and trust across the supply chain.
🧠 Best Practices for Using the Dashboard
🔹 Keep Excel data updated regularly.
🔹 Define KPIs clearly with unique formulas and units.
🔹 Compare both MTD and YTD metrics for comprehensive insights.
🔹 Use drill-throughs to understand performance changes.
🔹 Schedule Power BI data refreshes for automation.
🔹 Share insights via Power BI Service for organization-wide visibility.
🔗 Click here to read the Detailed Blog Post
🎥 Visit our YouTube channel for step-by-step tutorials
🔗 YouTube.com/@PKAnExcelExpert


Reviews
There are no reviews yet.