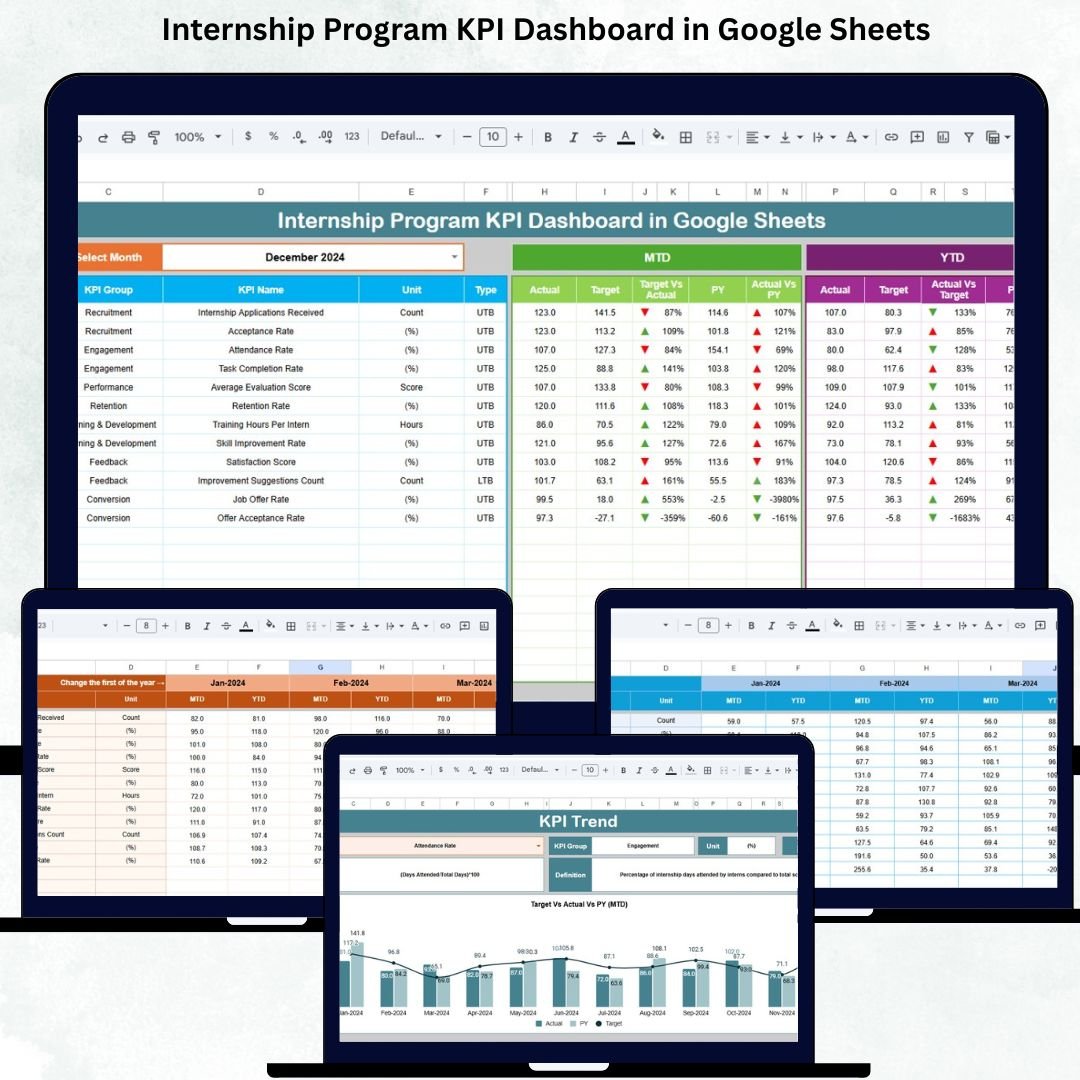
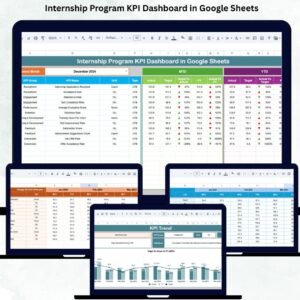
Internship Program KPI Dashboard in Google Sheets have become one of the strongest ways for organizations to build future-ready talent, enhance employer branding, and support long-term hiring needs. But without proper tracking, HR and L&D teams struggle to monitor intern engagement, training performance, mentor effectiveness, and overall program ROI. Manual spreadsheets often lead to incomplete data, inconsistent reporting, and missed improvement opportunities. The Internship Program KPI Dashboard in Google Sheets solves all these challenges with a powerful, structured, and fully automated tracking system.
This ready-to-use dashboard consolidates all internship KPIs into one clean, interactive workspace. From project completion rates to offer conversion ratios, mentor involvement, attendance, and satisfaction feedback—every key metric is captured and visualized clearly. This allows HR teams, managers, and leadership to evaluate the internship program with accuracy, transparency, and real-time insights.
✨ Key Features of the Internship Program KPI Dashboard in Google Sheets
📊 1. Real-Time KPI Tracking
Track all metrics that matter—intern engagement, training completion, task performance, project milestones, mentor feedback, and program outcomes. Every KPI updates automatically based on the month selected.
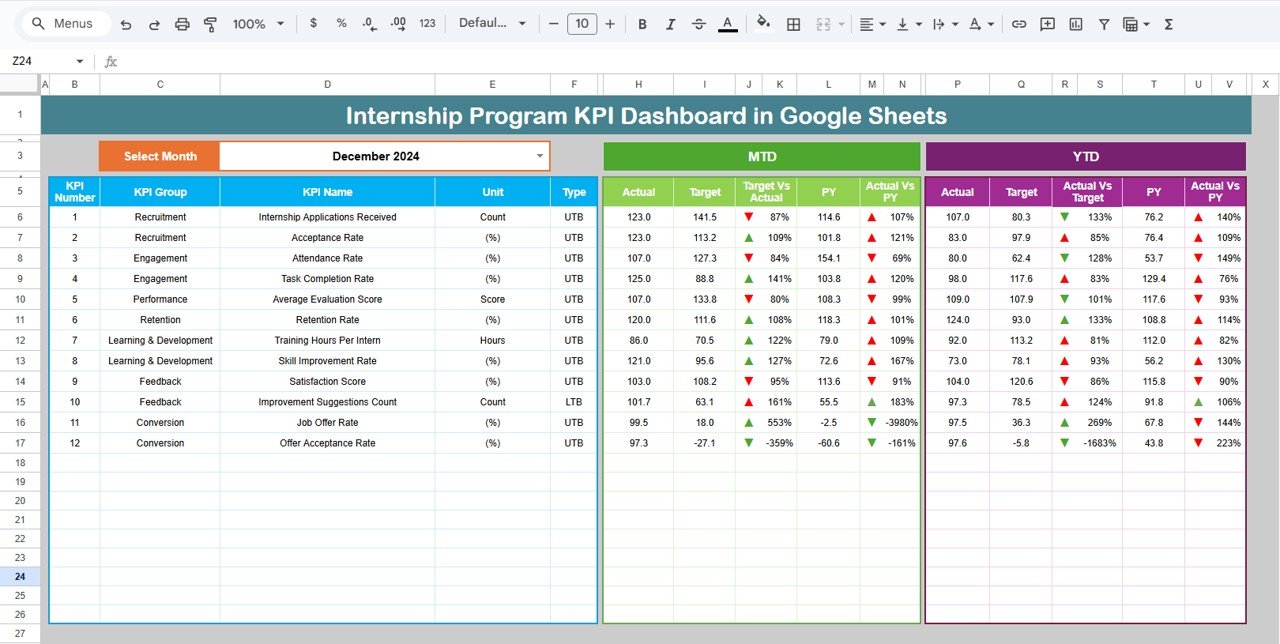
⏳ 2. MTD, YTD & PY Comparison
The dashboard displays:
-
MTD Actual / Target / Previous Year
-
YTD Actual / Target / Previous Year
Conditional arrows instantly show whether performance improved (↑) or declined (↓). This enables HR teams to analyze program success at a glance.
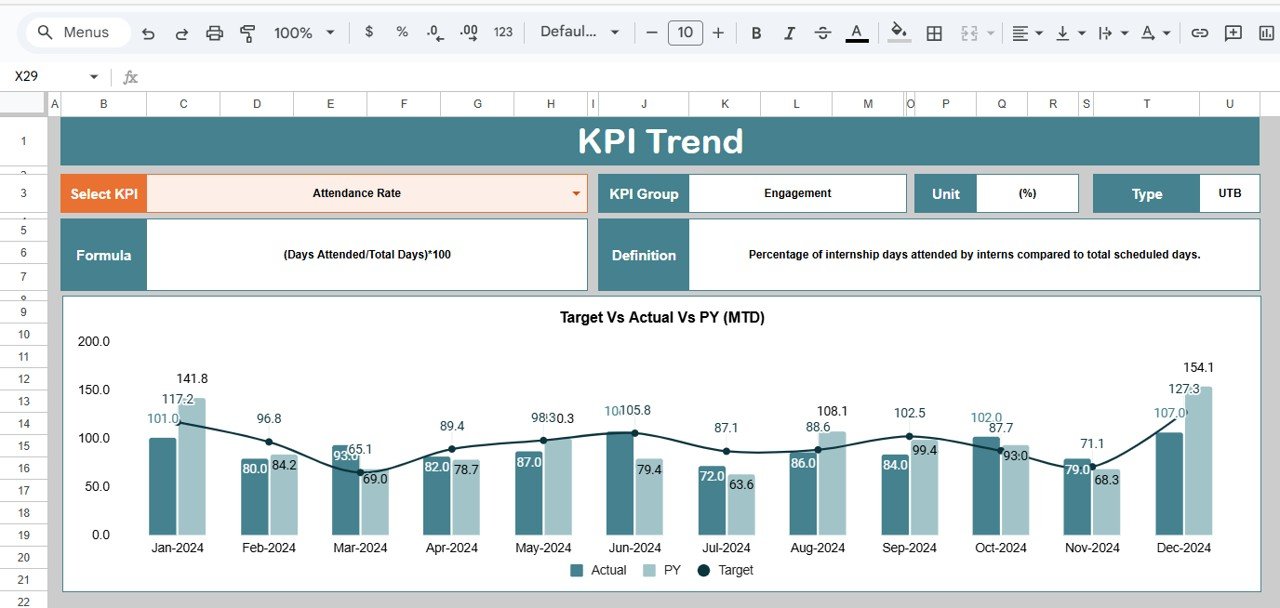
📈 3. KPI Trend Analysis
The KPI Trend Sheet offers month-wise visualization for all internship metrics. HR teams can identify patterns, seasonality, and improvement areas easily.
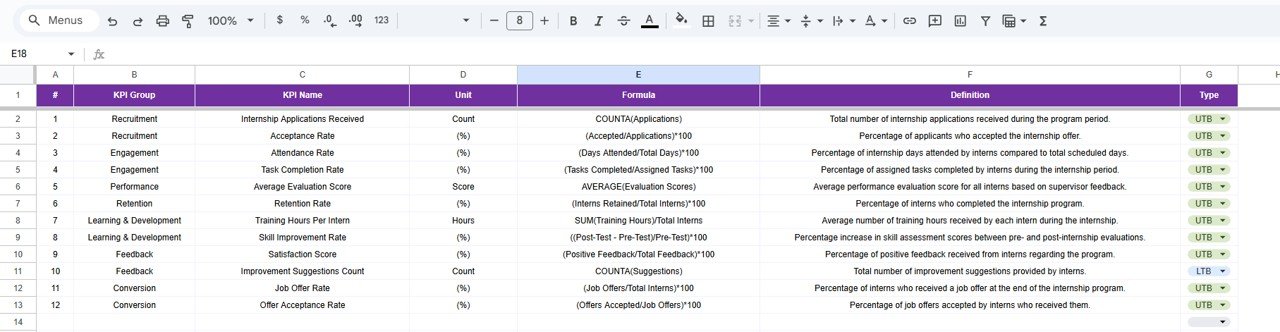
📘 4. Full KPI Dictionary
Each KPI includes group name, unit, formula, definition, and performance type (UTB/LTB). This helps maintain reporting accuracy and makes the dashboard beginner-friendly.
📦 What’s Inside the Internship Program KPI Dashboard in Google Sheets
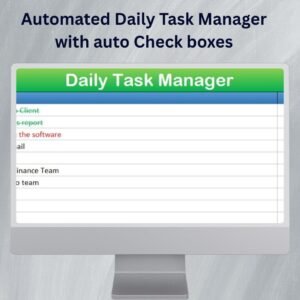
📍 1. Dashboard Sheet – Main Internship KPI Panel
This central sheet provides an instantly understandable overview of:
-
Internship attendance and engagement
-
Completion of training modules
-
Project performance
-
Mentor effectiveness
-
Satisfaction levels
-
Offer conversion rate
-
Internship ROI
Everything is controlled through a simple month selection in D3, giving a dynamic and interactive view.
📈 2. KPI Trend Sheet – Month-by-Month Performance
Selecting any KPI in C3 displays:
-
KPI group
-
Unit
-
Formula
-
Performance type
-
Definition
-
Monthly trend chart
This is ideal for long-term improvement tracking and program forecasting.
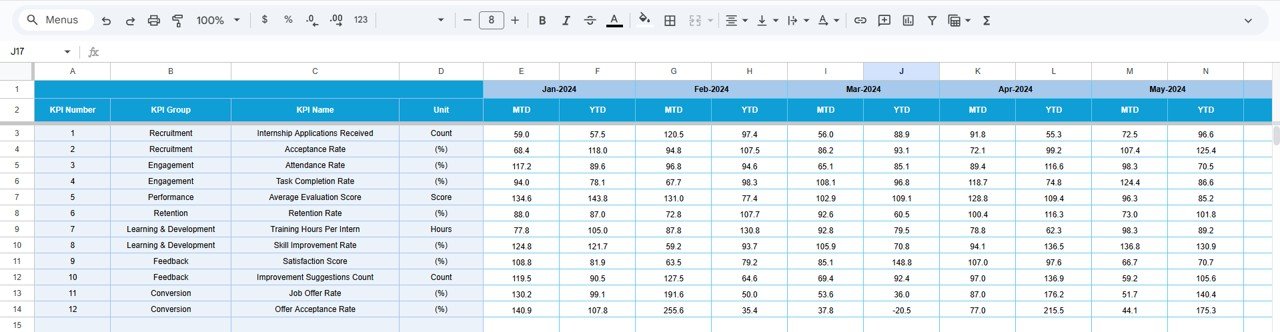
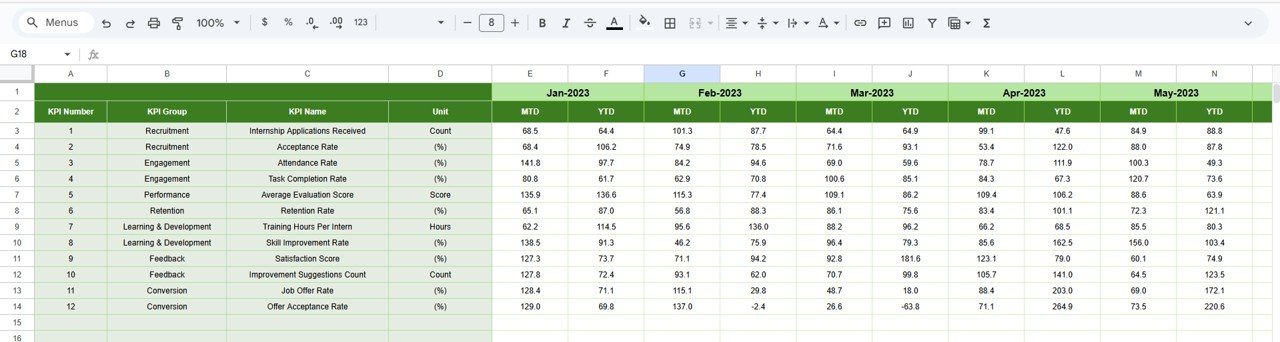
📝 3. Actual Numbers Sheet – Real Internship Data
Enter MTD and YTD actual values here. The starting month can be set in E1, giving organizations flexibility based on internship cycles.
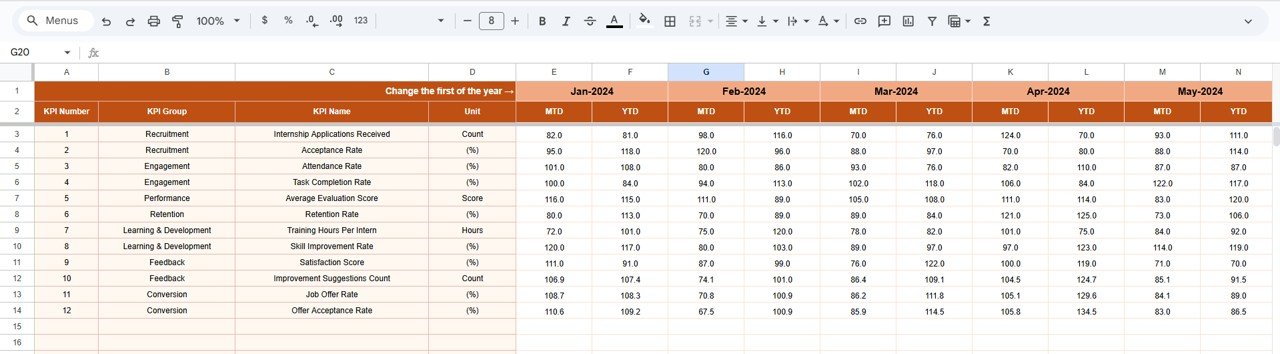
🎯 4. Target Sheet – Goal Setting
Organizations can set monthly and YTD targets for each metric. This aligns internship goals with business expectations.
📅 5. Previous Year Sheet – Historical Benchmarking
Adding previous year’s KPIs enables year-over-year improvement tracking, helping teams assess program maturity.
📚 6. KPI Definition Sheet – Internship KPI Framework
Includes KPI formulas, units, categories, and definitions for clear understanding and easy onboarding of new HR members.
🎯 Who Can Benefit from the Internship Program KPI Dashboard in Google Sheets
🏢 HR Teams
Monitor engagement, attendance, and overall program health.
📘 L&D Teams
Track training progress, modules completed, and learning outcomes.
👨🏫 Mentors & Managers
Evaluate intern performance and identify coaching needs.
📈 Leadership Teams
Understand ROI, conversion rates, and talent development impact.
🌍 Multi-location Organizations
Manage interns across branches easily with a cloud-based system.
Click here to read the Detailed blog post
Watch the step-by-step video Demo:


Reviews
There are no reviews yet.