
Are you still managing insurance policies through scattered Excel sheets? Struggling to track agent performance, premium collection, and commission payouts in one place?The Insurance Brokers Dashboard in Power BI is a ready-to-use, fully interactive reporting solution designed specifically for brokerage firms that want clarity, speed, and control. Instead of juggling multiple reports, this dashboard centralizes your entire insurance operation into one powerful control center.
From active policies to commission earnings, from payment modes to monthly performance trends — everything is available at your fingertips in seconds.
🚀 Key Features of Insurance Brokers Dashboard in Power BI
-
📊 5 Fully Interactive Dashboard Pages for complete business visibility
-
💰 Real-Time KPI Cards tracking Total Policies, Premium Collected, Commission Earned, Active & Cancelled Policies
-
👨💼 Agent Performance Monitoring with cancellation and expiry indicators
-
📈 Commission Structure Analysis for revenue optimization
-
💳 Payment Mode Revenue Insights for cash flow clarity
-
📅 Monthly Trend Analysis to identify seasonal patterns
-
🎛️ Advanced Slicers & Filters for instant drill-down analysis
This dashboard transforms complex insurance data into simple, visual insights that support faster and smarter decision-making.
📦 What’s Inside the Insurance Brokers Dashboard?
This product includes 5 powerful analytical pages built in Power BI:
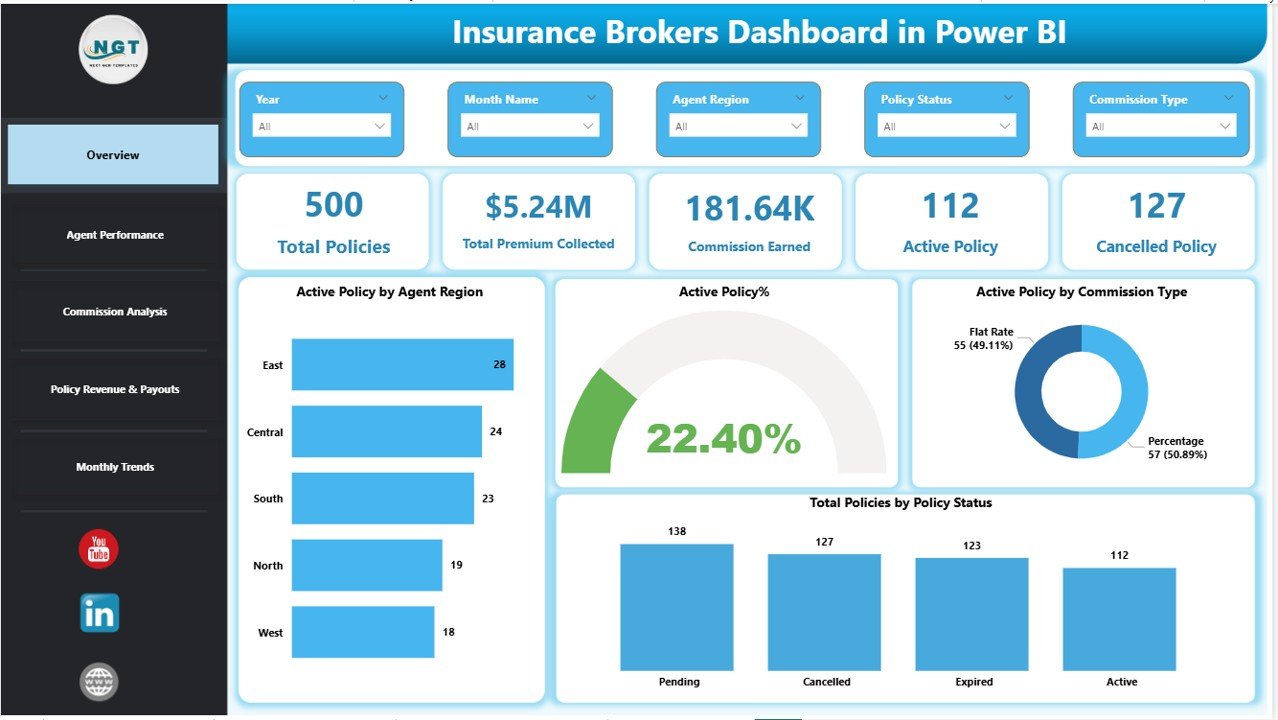
1️⃣ Overview Page – Your Command Center
-
KPI Cards: Total Policies, Premium Collected, Commission Earned, Active & Cancelled Policies
-
Active Policy by Region
-
Active Policy %
-
Active Policy by Commission Type
-
Interactive slicers for Agent, Region, Commission Type, Policy Status & Payment Mode
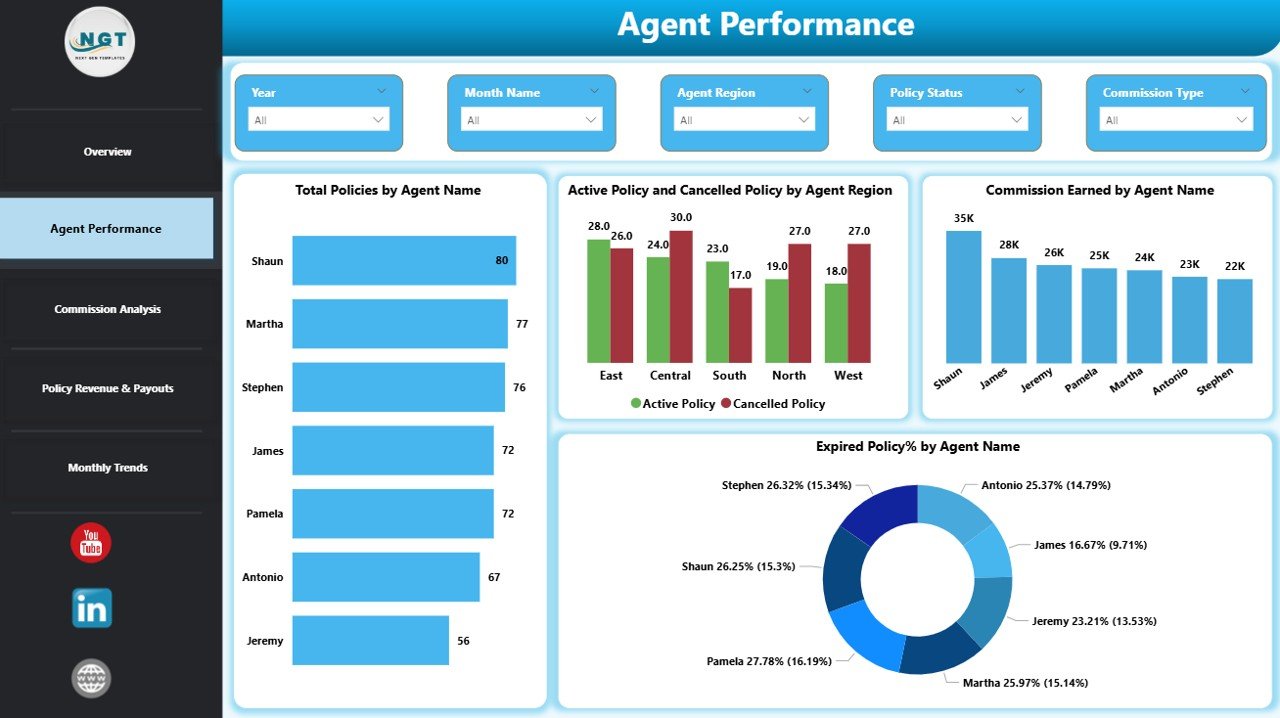
2️⃣ Agent Performance Page
-
Total Policies by Agent
-
Active vs Cancelled Policies by Agent
-
Commission Earned by Agent
-
Expired Policy % by Agent
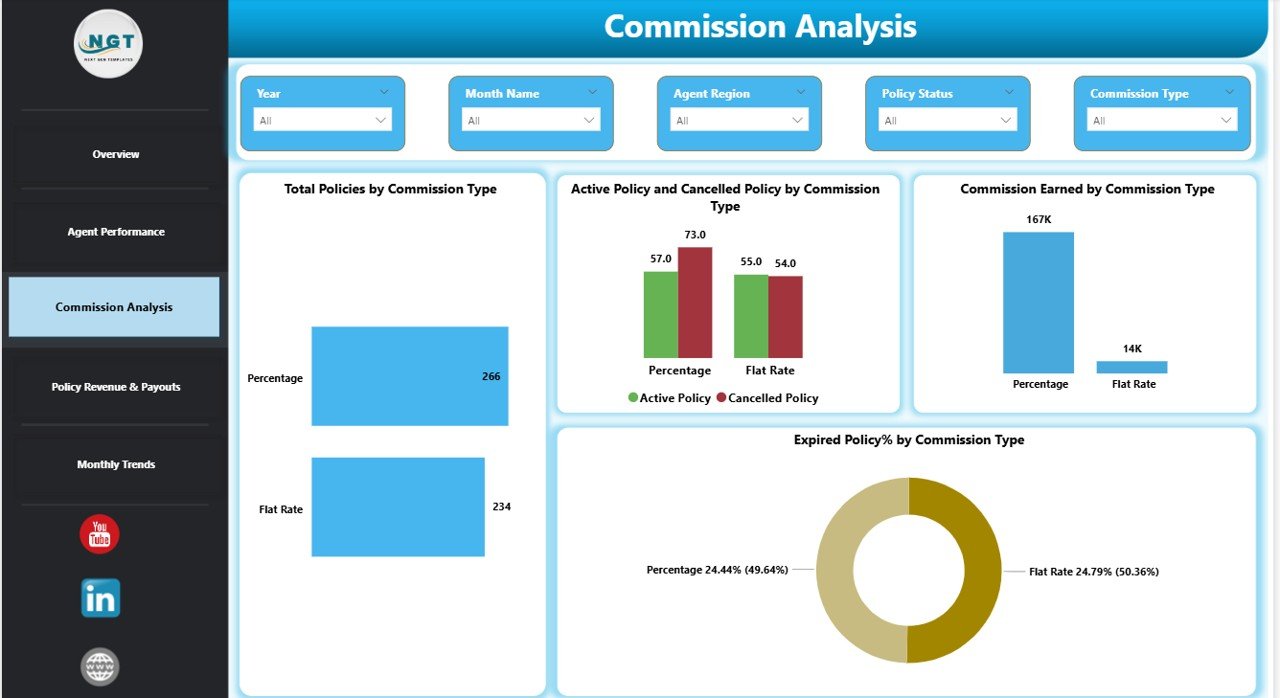
3️⃣ Commission Analysis Page
-
Policies by Commission Type
-
Active & Cancelled by Commission Type
-
Commission Earned by Commission Type
-
Expired Policy % by Commission Type
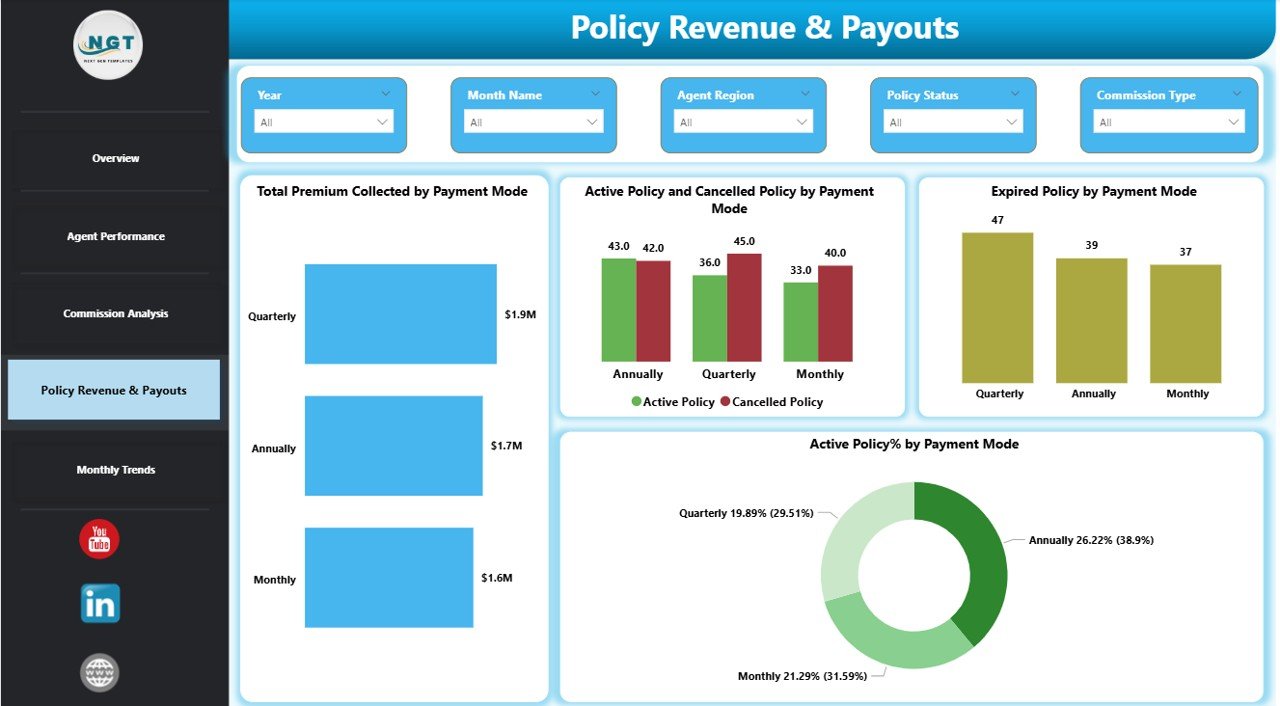
4️⃣ Policy Revenue & Payout Page
-
Premium Collected by Payment Mode
-
Policy Status by Payment Mode
-
Expiry Trends by Payment Channel
-
Active Policy % by Payment Mode
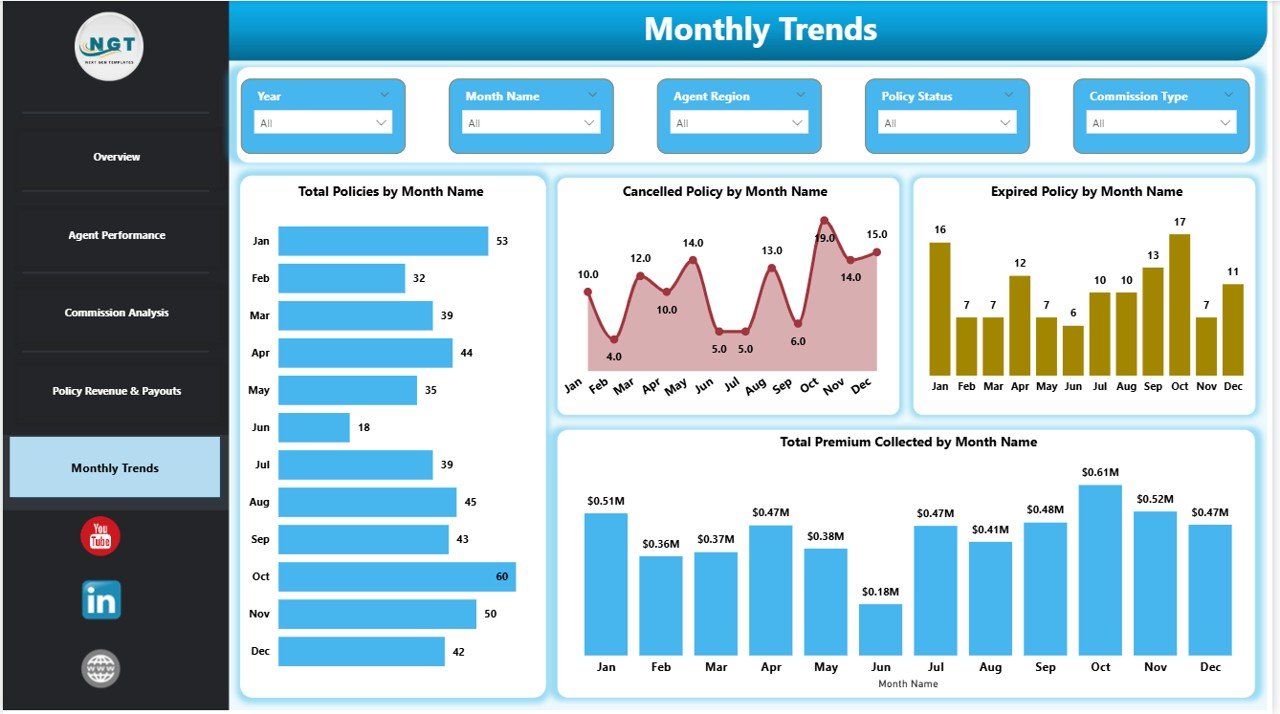
5️⃣ Monthly Trends Page
-
Policies by Month
-
Cancelled & Expired by Month
-
Premium Collected by Month
Every page is designed for practical business decision-making.
🛠️ How to Use the Insurance Brokers Dashboard
Using this dashboard is simple:
1️⃣ Prepare structured insurance data in Excel.
2️⃣ Import the data into Power BI.
3️⃣ Refresh the data model.
4️⃣ Use slicers to filter by agent, region, commission type, or payment mode.
5️⃣ Drill down into visuals for detailed insights.
6️⃣ Publish to Power BI Service for secure sharing.
Within minutes, you get full operational visibility without manual calculations.
🎯 Who Can Benefit from This Insurance Brokers Dashboard?
This solution is perfect for:
-
🏢 Insurance Brokerage Firms
-
👨💼 Agency Managers
-
💵 Commission Analysts
-
📊 Financial Controllers
-
📈 Sales Performance Teams
-
🚀 Insurance Business Owners
Whether you manage 10 agents or 500 policies daily, this dashboard scales with your growth.
Why This Dashboard Is a Game-Changer
✅ Eliminates spreadsheet confusion
✅ Improves commission planning
✅ Identifies cancellation risks early
✅ Enhances agent accountability
✅ Strengthens revenue forecasting
✅ Supports data-driven decisions
Instead of reacting to problems, you start predicting them.
This is not just a dashboard. It is your Insurance Business Control Tower.
If you want better profitability, improved transparency, and stronger operational control — this Insurance Brokers Dashboard in Power BI is the smart investment your brokerage needs.
Click here to read the Detailed blog post
Watch the step-by-step video tutorial:
Visit our YouTube channel to learn step-by-step video tutorials
YouTube Channel


