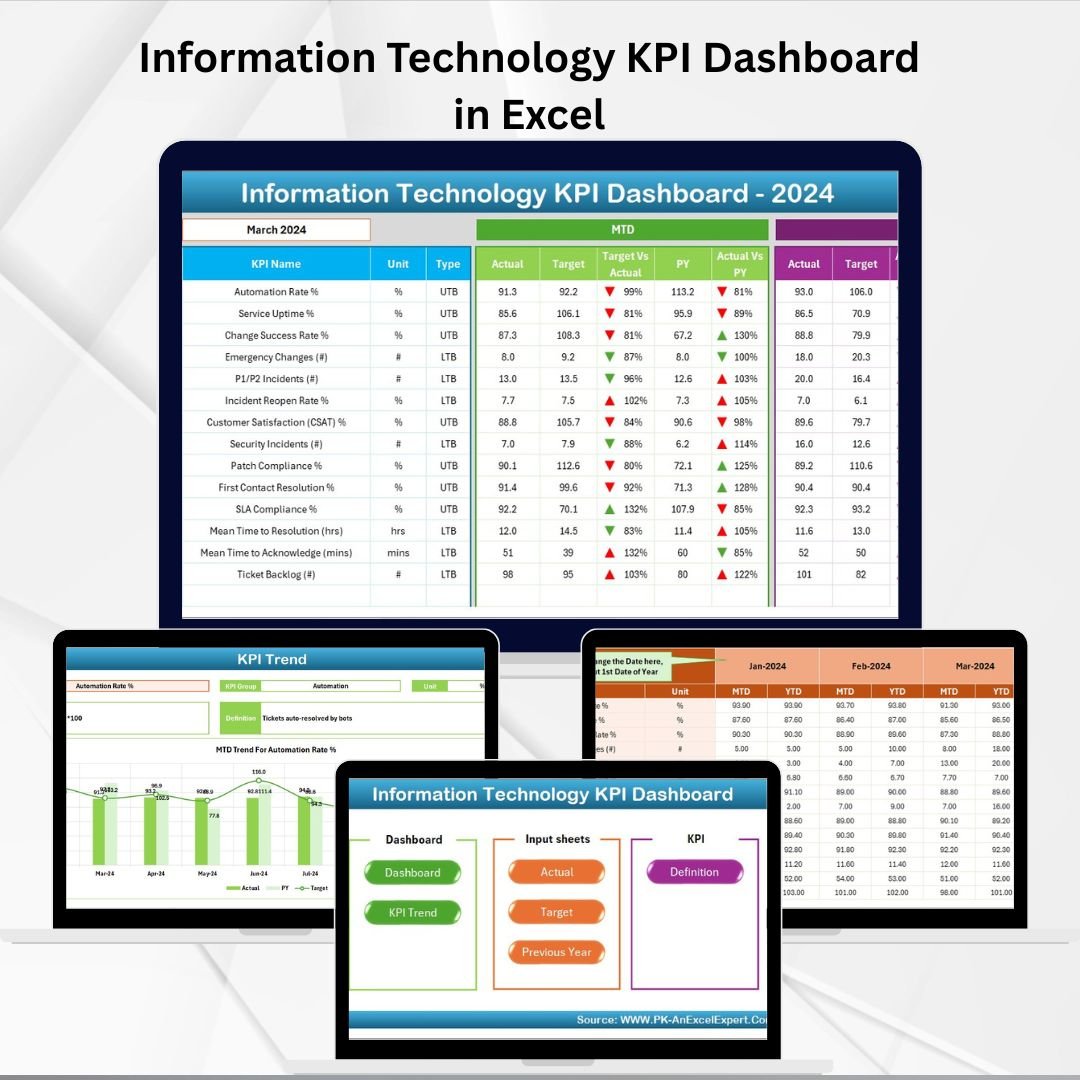
In today’s digital-first business world, Information Technology KPI Dashboard in Excel is the backbone of efficiency, innovation, and security. From minimizing downtime to protecting data and optimizing resources, IT teams are under constant pressure to deliver measurable results. Yet, without a clear way to track performance, many organizations struggle to align IT outcomes with business goals.
That’s where the Information Technology KPI Dashboard in Excel comes in 💻📊. This ready-to-use tool helps you track critical IT metrics, compare actuals with targets, and analyze performance trends with ease. Designed for IT managers, executives, and business leaders, this dashboard transforms raw data into actionable insights—all within Excel.
✨ Key Features of IT KPI Dashboard in Excel
✅ 7 Pre-Built Worksheets – Includes Home, Dashboard, KPI Trend, Actual Numbers, Target, Previous Year, and KPI Definition sheets.
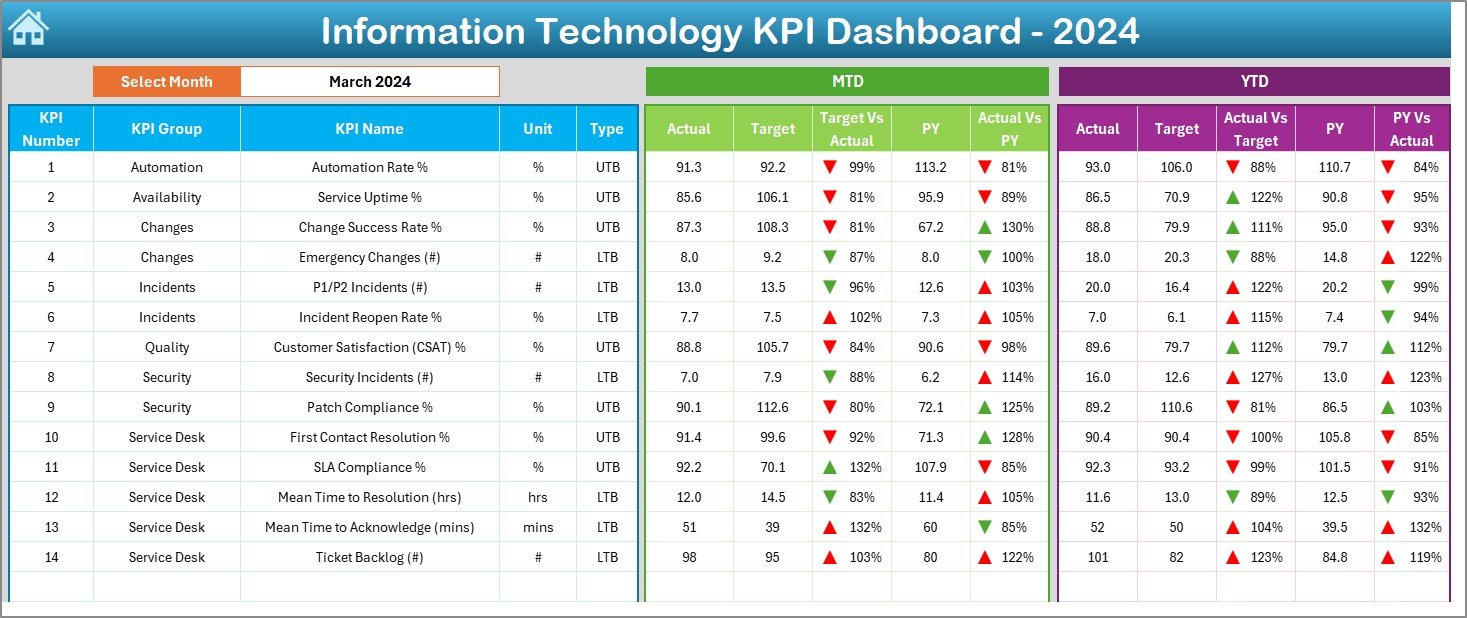
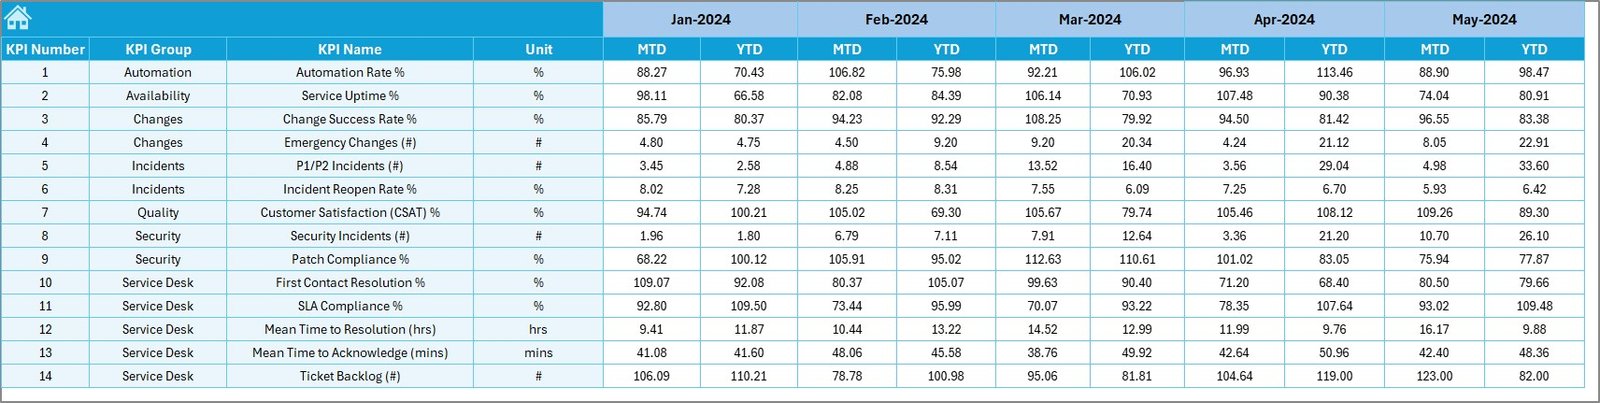
✅ Interactive Dashboard – Select a month (via dropdown) to instantly view MTD (Month-to-Date) and YTD (Year-to-Date) metrics.
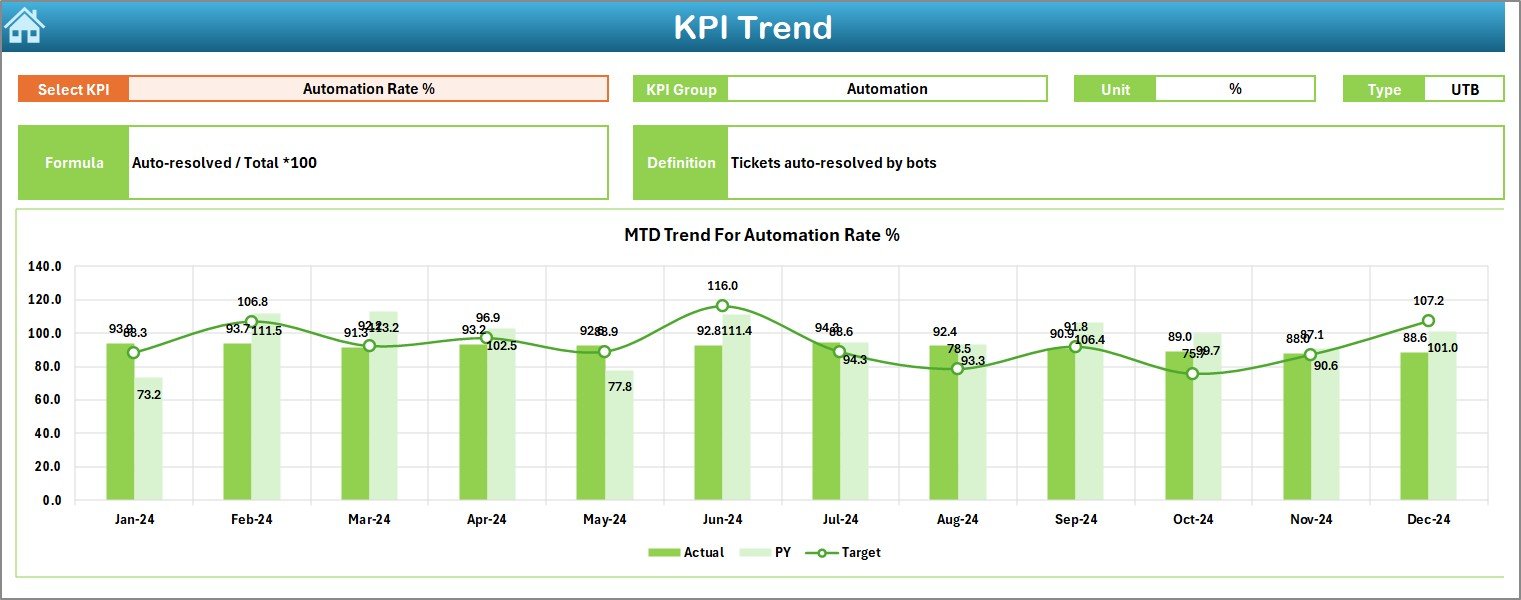
✅ KPI Trend Analysis – Drill into individual KPIs with charts and definitions for deeper insights.
✅ Conditional Formatting – Red/green arrows highlight gaps and achievements at a glance.
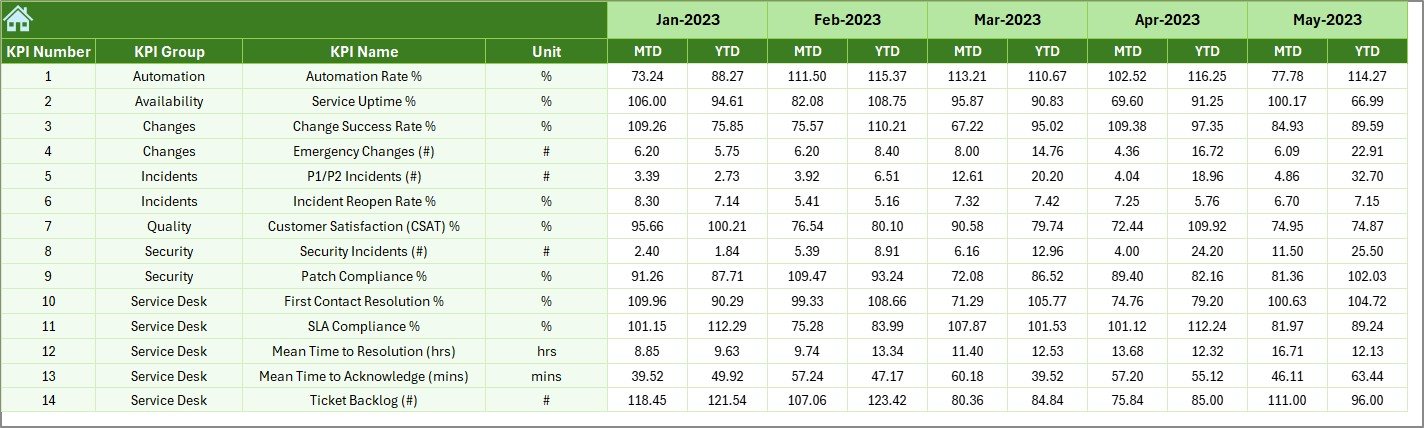
✅ Historical Benchmarking – Compare current performance with previous year’s data.
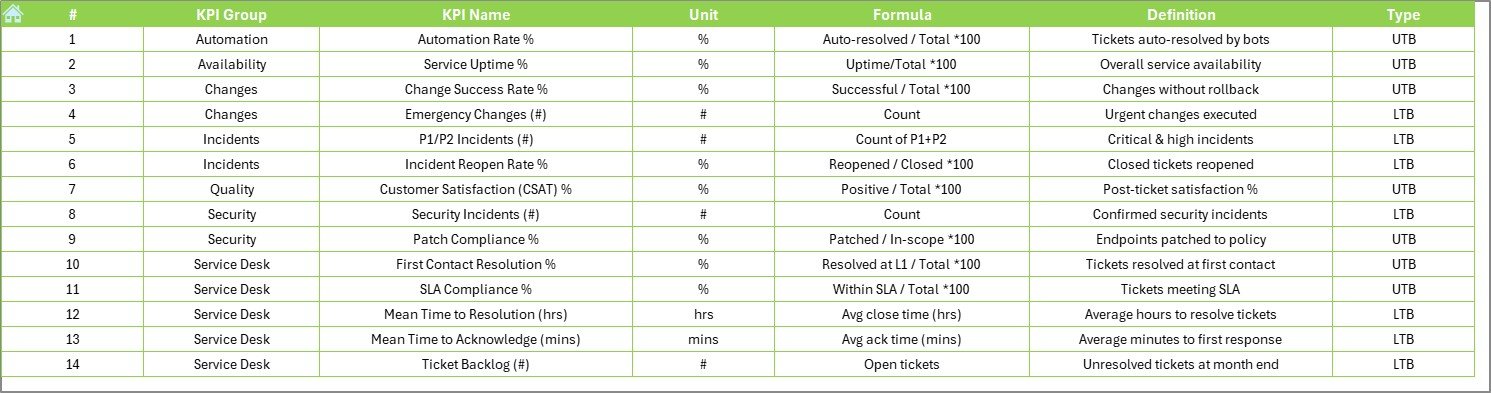
✅ KPI Metadata – Maintain consistency with clearly defined KPI formulas, groups, and units.
✅ Simple Data Entry – Input actuals, targets, and PY numbers in structured sheets.
✅ Customizable – Easily add, edit, or remove KPIs to fit your IT strategy.
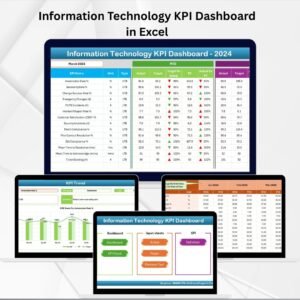
📊 What’s Inside the IT KPI Dashboard in Excel

When you download this template, you’ll find a structured Excel system ready to track IT performance:
-
Home Sheet – Index page with navigation buttons for easy access.
-
Dashboard Sheet – Central hub showing Actual vs Target, Actual vs Previous Year, MTD & YTD results with conditional formatting.
-
KPI Trend Sheet – Drill down into individual KPIs with trend charts, KPI definitions, and comparison views.
-
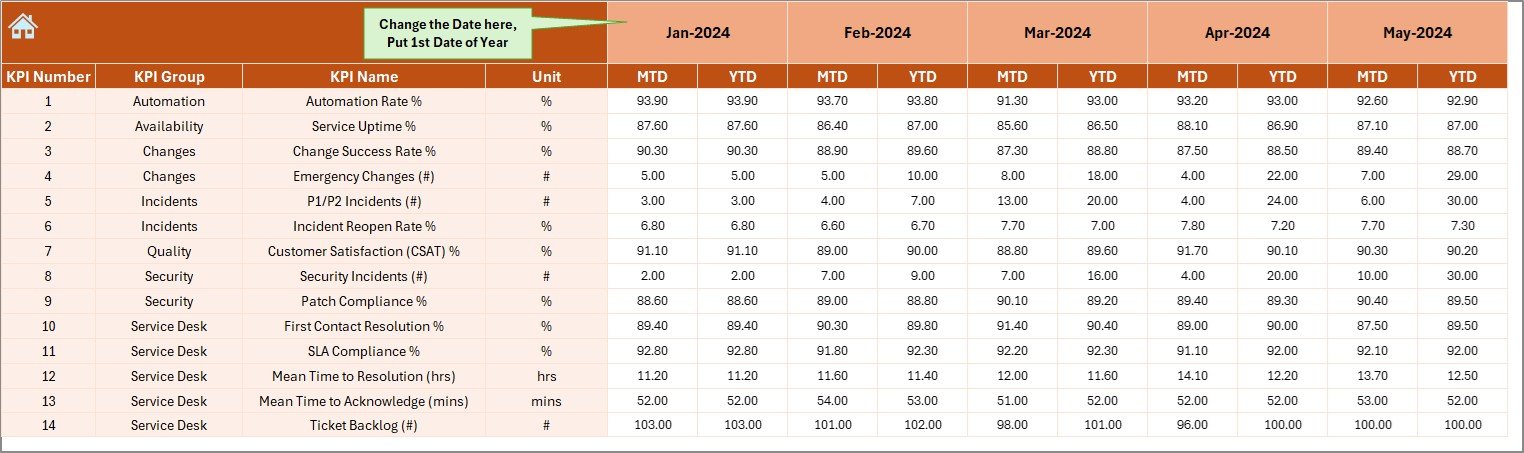
Actual Numbers Input Sheet – Enter monthly MTD and YTD actuals; set fiscal/calendar start month.
-
Target Sheet – Define monthly and yearly target benchmarks.
-
Previous Year Sheet – Store last year’s KPIs for year-over-year analysis.
-
KPI Definition Sheet – Document KPI name, group, unit, formula, and definition for clarity and alignment.
🛠️ How to Use the IT KPI Dashboard in Excel
1️⃣ Input Data – Fill in actuals, targets, and PY data in respective sheets.
2️⃣ Review Dashboard – Instantly see performance gaps and achievements with KPIs.
3️⃣ Drill Into Trends – Use the KPI Trend tab to analyze metrics over time.
4️⃣ Monitor Monthly & Yearly – Compare MTD and YTD performance to targets.
5️⃣ Share Insights – Export visuals and tables for management reporting.
With zero technical complexity, this dashboard is plug-and-play for IT teams ⚡.
👥 Who Can Benefit from This IT KPI Dashboard
💼 IT Managers – Track helpdesk performance, uptime, and incident resolution.
📊 Executives – Align IT investments with business strategy.
🛡️ Cybersecurity Teams – Monitor breaches, patch compliance, and risk indicators.
🏢 SMEs & Enterprises – Affordable alternative to expensive BI tools.
🔍 Auditors & Compliance Teams – Use structured KPI records for reviews.
This dashboard is designed for any organization that wants to measure IT performance objectively and efficiently.
Click here to read the Detailed blog post
Visit our YouTube channel to learn step-by-step video tutorials
👉 PKAnExcelExpert


Reviews
There are no reviews yet.