
In today’s competitive film industry, independent filmmakers must balance creativity with financial discipline. However, managing production costs, marketing budgets, and revenue across multiple sources can quickly become overwhelming—especially when data is scattered across spreadsheets.
So, how can you track film performance, control budgets, and maximize profitability in real time?
👉 The answer is the Independent Filmmaking Dashboard in Power BI.
This powerful, ready-to-use dashboard transforms complex filmmaking data into clear, interactive visuals. As a result, you can monitor KPIs, analyze ROI, and make smarter decisions—without the stress of manual reporting.
Whether you are a filmmaker, producer, or studio executive, this dashboard gives you the clarity and control you need to succeed in a fast-moving industry.
🔑 Key Features of Independent Filmmaking Dashboard in Power BI
🎯 Complete Financial Tracking – Monitor production, marketing, and total costs in real time
💰 Revenue & Profit Analysis – Track earnings, profit margins, and ROI effortlessly
📊 Interactive Visual Dashboards – Understand complex film data through simple visuals
📈 Multi-Dimensional Analysis – Analyze performance by genre, region, and distribution channel
🌍 Regional Performance Insights – Evaluate box office success across different regions
🎬 Film Performance Tracking – Compare multiple film projects in one place
⚡ Faster Decision-Making – Get instant insights for smarter strategies
🧩 5 Fully Structured Pages – Cover all aspects of filmmaking analytics
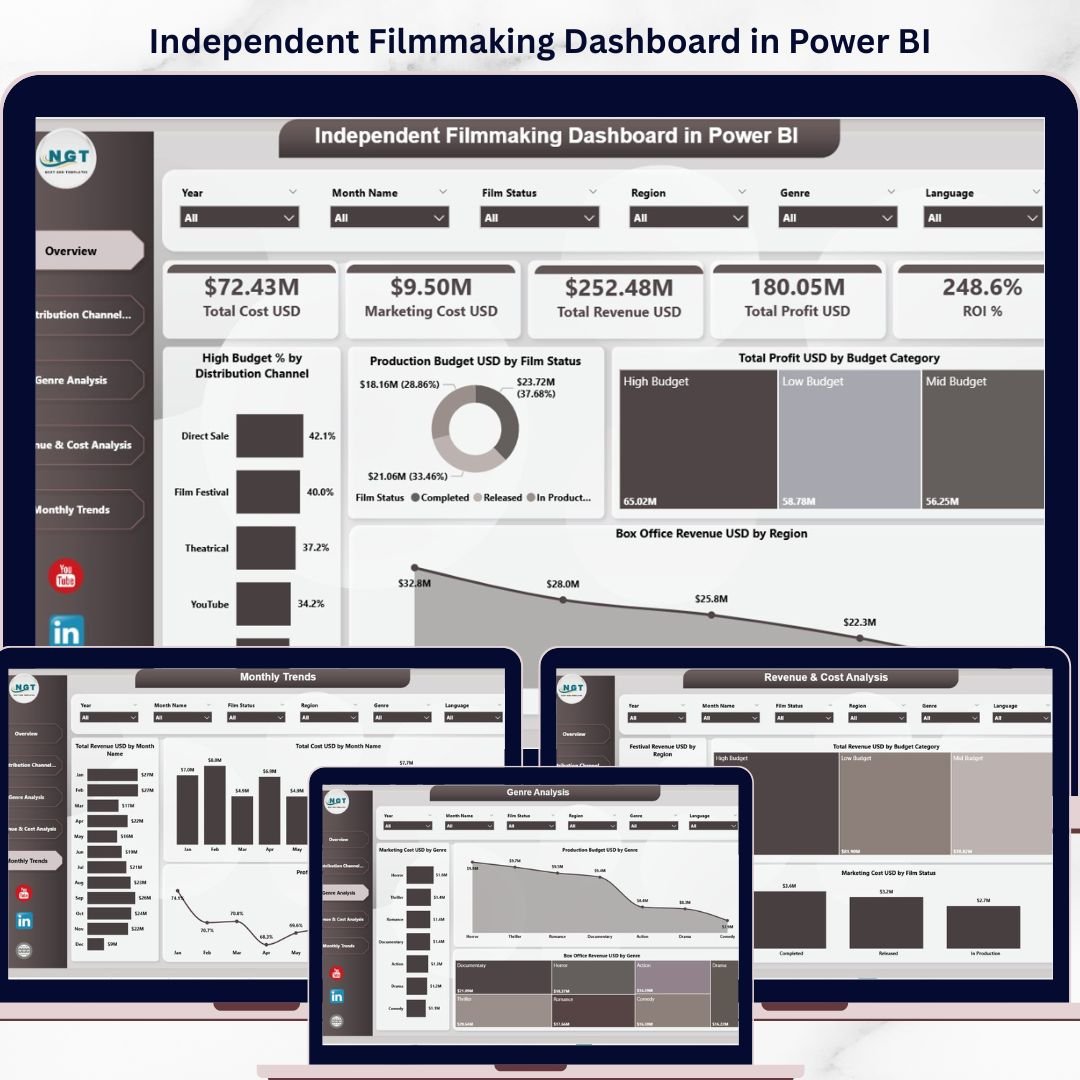
📦 What’s Inside the Independent Filmmaking Dashboard in Power BI
This ready-to-use dashboard includes 5 powerful analytical pages designed for complete filmmaking insights:
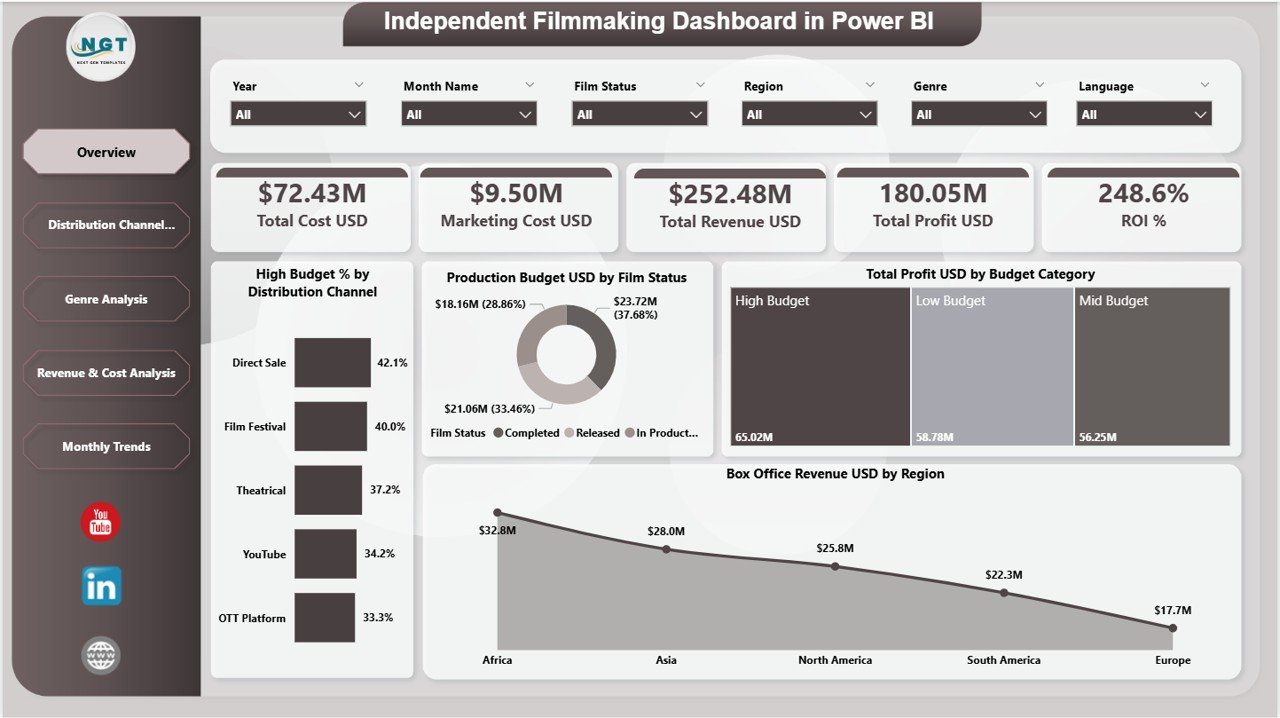
🏠 Overview Page – Get a quick snapshot of Total Cost, Revenue, Profit, and ROI
📺 Distribution Channel Analysis – Evaluate performance across OTT, theaters, and other channels
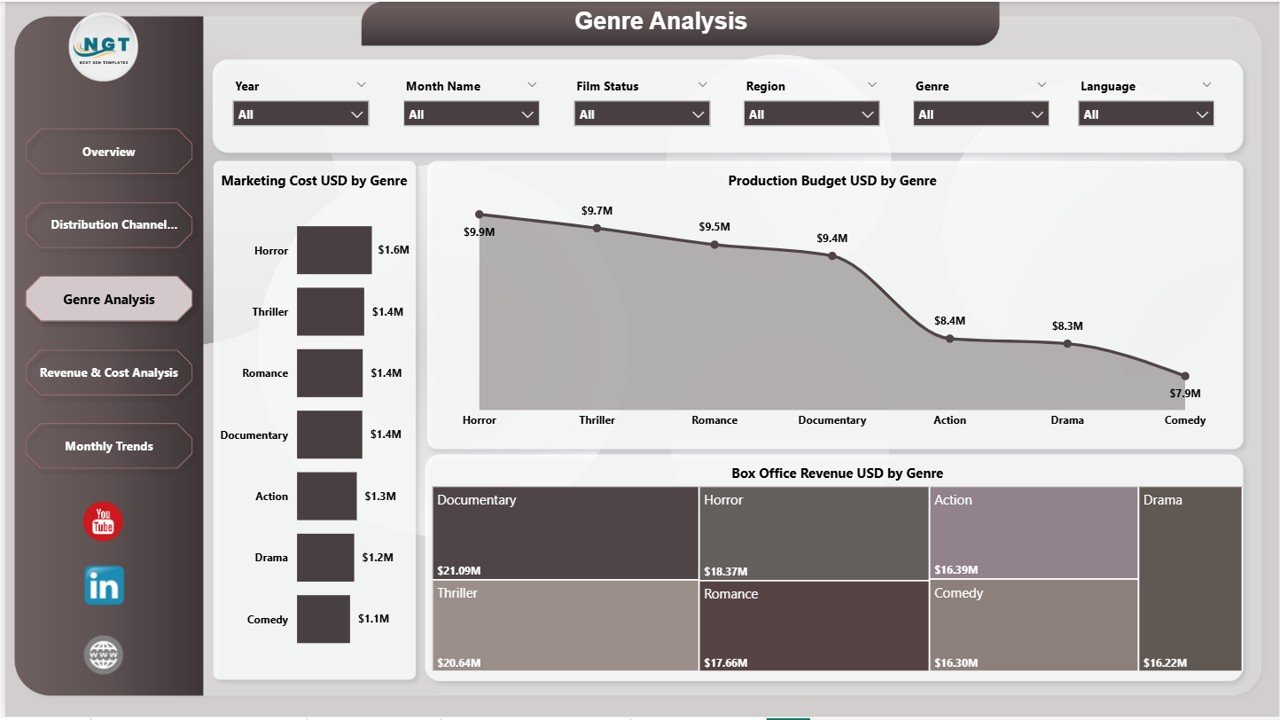
🎭 Genre Analysis – Discover which genres generate the highest returns
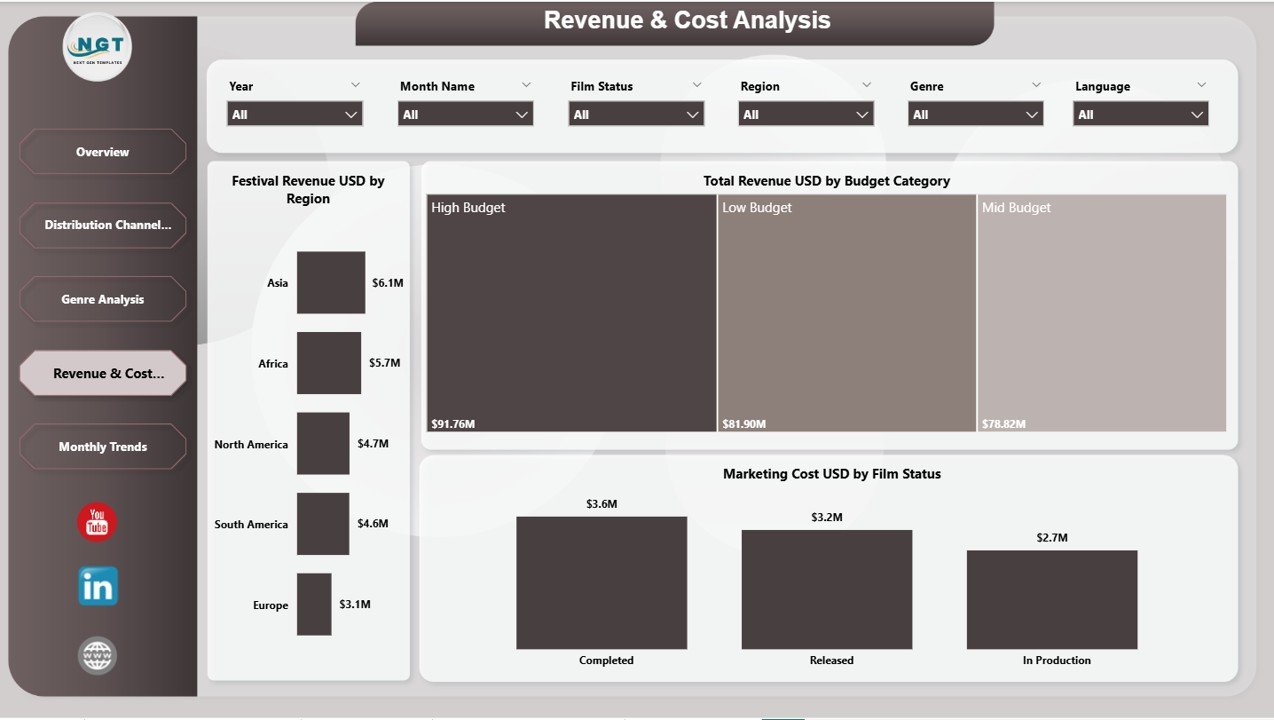
💰 Revenue & Cost Analysis – Analyze financial performance in detail
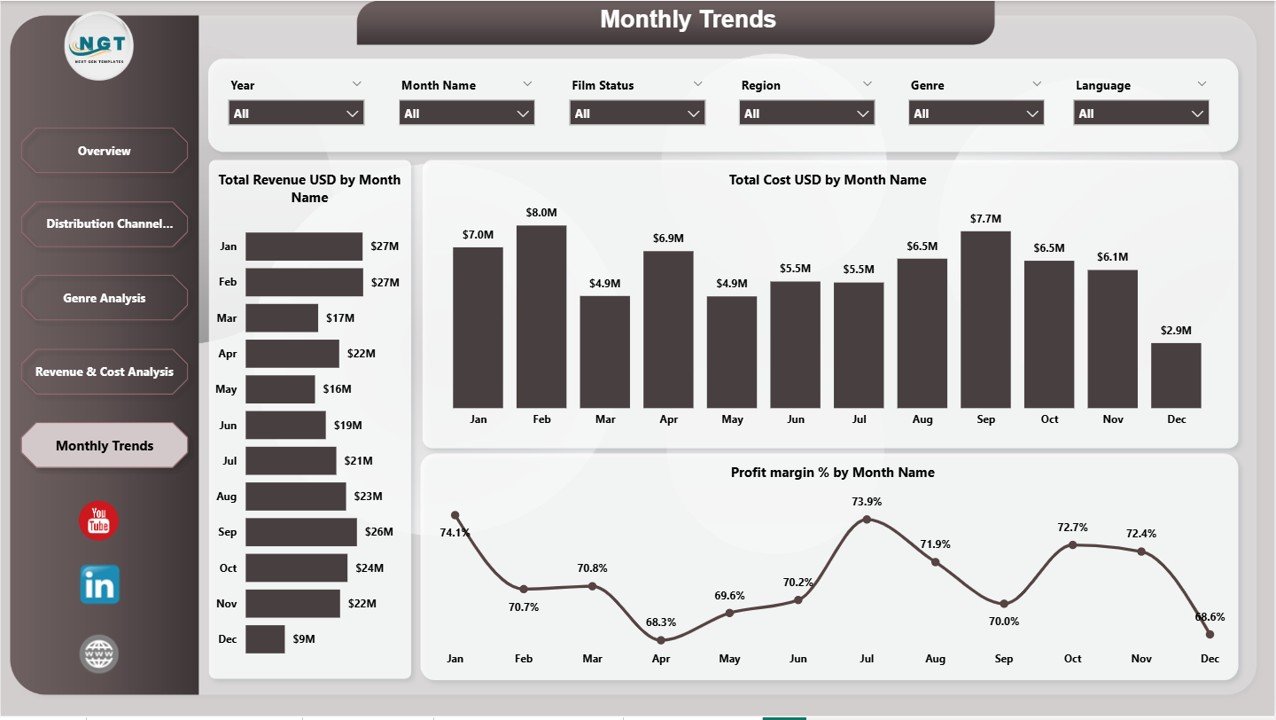
📅 Monthly Trends – Track revenue, cost, and profit trends over time
👉 Therefore, you get a complete 360° financial view of your film projects.
🛠️ How to Use the Independent Filmmaking Dashboard in Power BI
Using this dashboard is simple and beginner-friendly:
📥 Import Your Data – Upload production, marketing, and revenue data
🔗 Connect Data Sources – Ensure accurate and seamless data integration
🎛️ Apply Filters (Slicers) – Select genre, region, or film status
📊 Review KPI Cards – Instantly analyze financial performance
🔍 Explore Detailed Pages – Dive deeper into cost and revenue insights
📈 Track Trends – Use monthly insights to improve future projects
👉 As a result, you can turn raw filmmaking data into powerful business decisions.
👥 Who Can Benefit from This Independent Filmmaking Dashboard in Power BI
This dashboard is ideal for:
🎬 Independent Filmmakers – Track budgets and maximize film profitability
🎥 Producers & Studios – Manage multiple projects efficiently
📊 Business Analysts – Analyze financial and performance metrics
💼 Media & Entertainment Companies – Optimize production and distribution strategies
🚀 OTT Platforms & Distributors – Monitor content performance and ROI
👉 No matter your role, this dashboard helps you make smarter, data-driven decisions.
With this dashboard, you no longer need to rely on manual reports or disconnected data sources. Instead, you get a centralized system that simplifies complex financial data into clear insights.
Moreover, it helps you identify profitable projects, optimize marketing spend, and improve distribution strategies. Therefore, you can reduce risks and maximize returns on every film you produce.
If you want to take control of your filmmaking finances and boost profitability, this dashboard is your ultimate solution. 🚀
📖 Click hare to read the Detailed blog post
🎥 Visit our YouTube channel to learn step-by-step video tutorials
👉 https://www.youtube.com/@PKAnExcelExpert


