


Hotel Chains KPI Dashboard chain successfully is not just about offering comfortable rooms and great service. It is also about tracking performance, controlling costs, improving efficiency, and making data-driven decisions across multiple properties. However, many hotel groups still depend on scattered Excel files, manual reports, and delayed reviews. As a result, leadership teams struggle to get a clear, consolidated view of performance.
That is exactly where the Hotel Chains KPI Dashboard in Excel delivers powerful value. 🚀
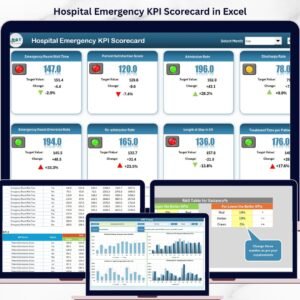
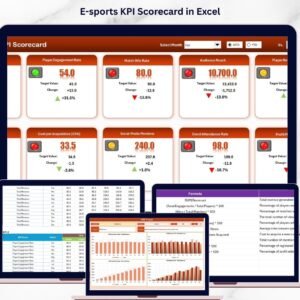
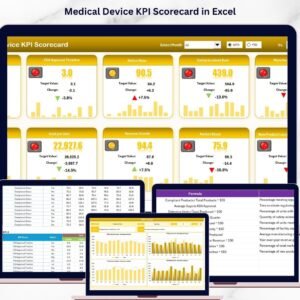
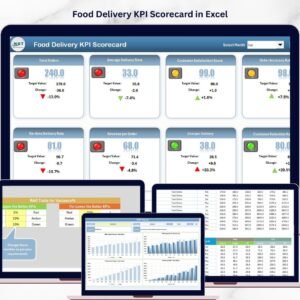
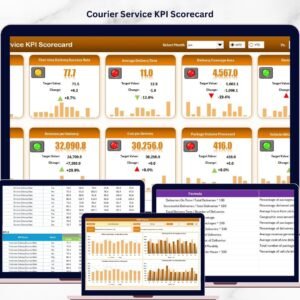
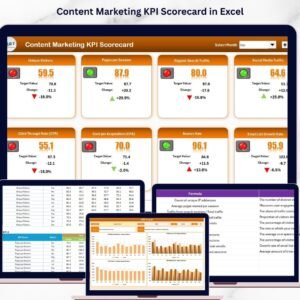
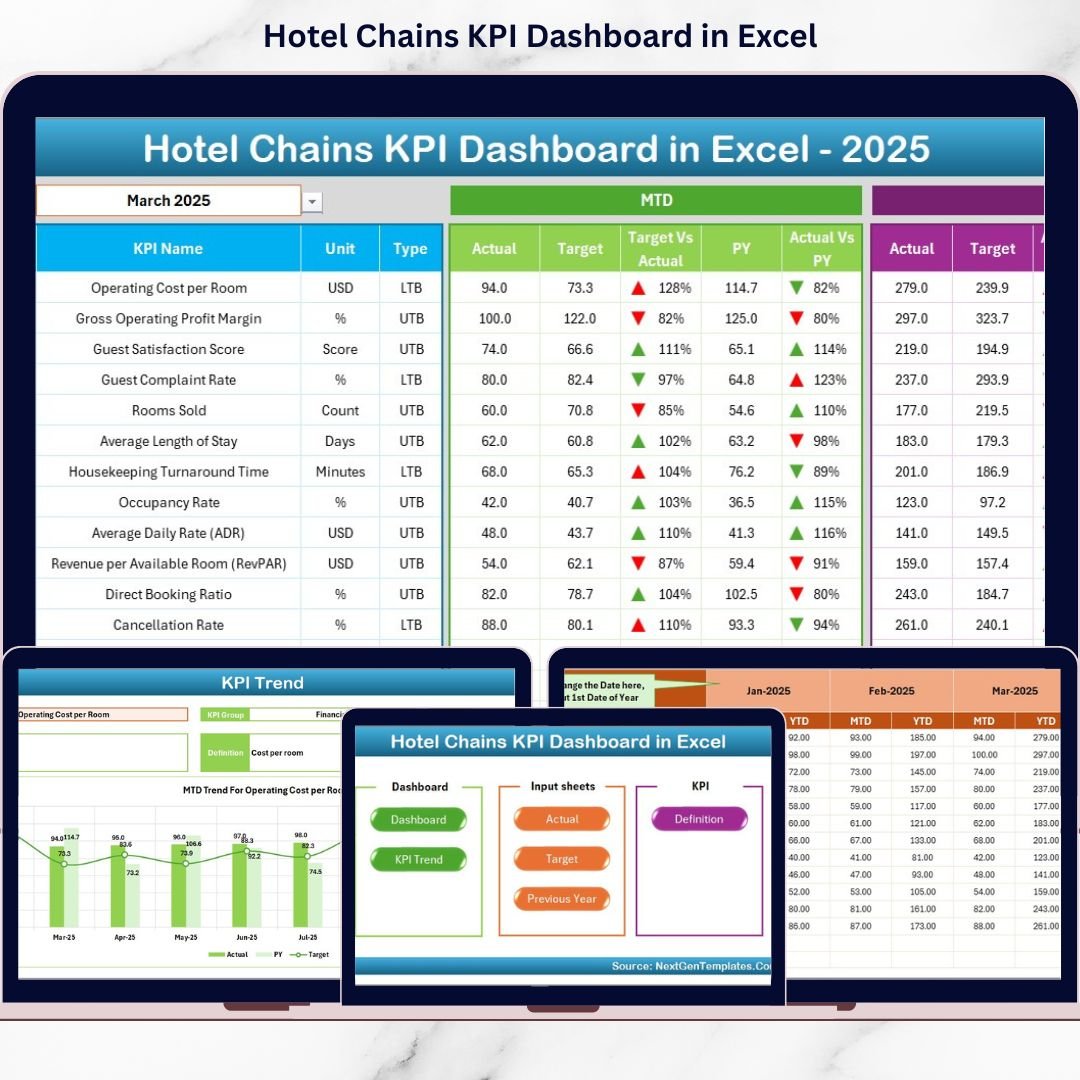
This ready-to-use, professionally designed Excel dashboard helps hotel chains track, analyze, and compare key performance indicators in one centralized file—without complex BI tools or heavy reporting effort.
Designed specifically for hotel groups, this dashboard converts raw data into clear insights that support smarter and faster decisions.
🔑 Key Features of Hotel Chains KPI Dashboard in Excel
📊 Centralized KPI Tracking
Track all critical hotel KPIs in one structured Excel dashboard instead of managing multiple spreadsheets.
📈 MTD & YTD Performance Analysis
Monitor Month-to-Date and Year-to-Date results to understand short-term performance and long-term trends.
🎯 Target vs Actual Comparison
Instantly compare Actual performance against Targets with visual indicators and trend arrows.
🔁 Previous Year (PY) Comparison
Analyze year-over-year growth using Previous Year data for better benchmarking and planning.
🚦 Visual Indicators & Conditional Formatting
Spot underperformance instantly using up/down arrows, color signals, and trend visuals.
🧩 Fully Excel-Based & Easy to Use
No macros, no BI tools, and no advanced technical skills required—just Microsoft Excel.
📦 What’s Inside the Hotel Chains KPI Dashboard in Excel
This dashboard includes 7 well-structured worksheets, each designed for a specific purpose:
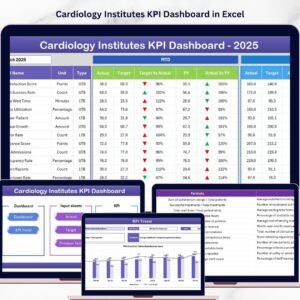
🏠 Home Sheet
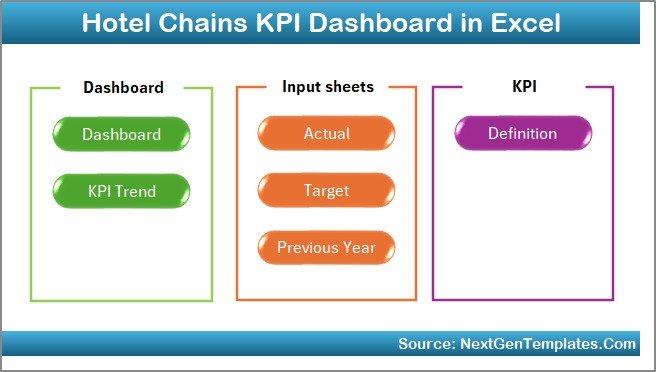
A clean index page with navigation buttons for quick access to all dashboard sections.
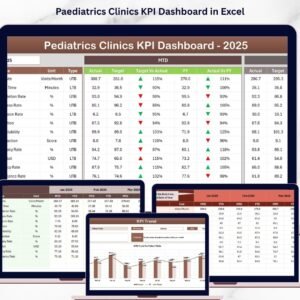
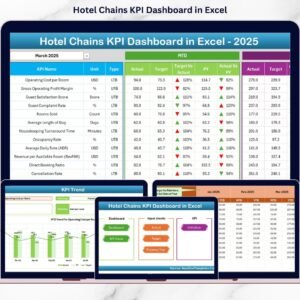
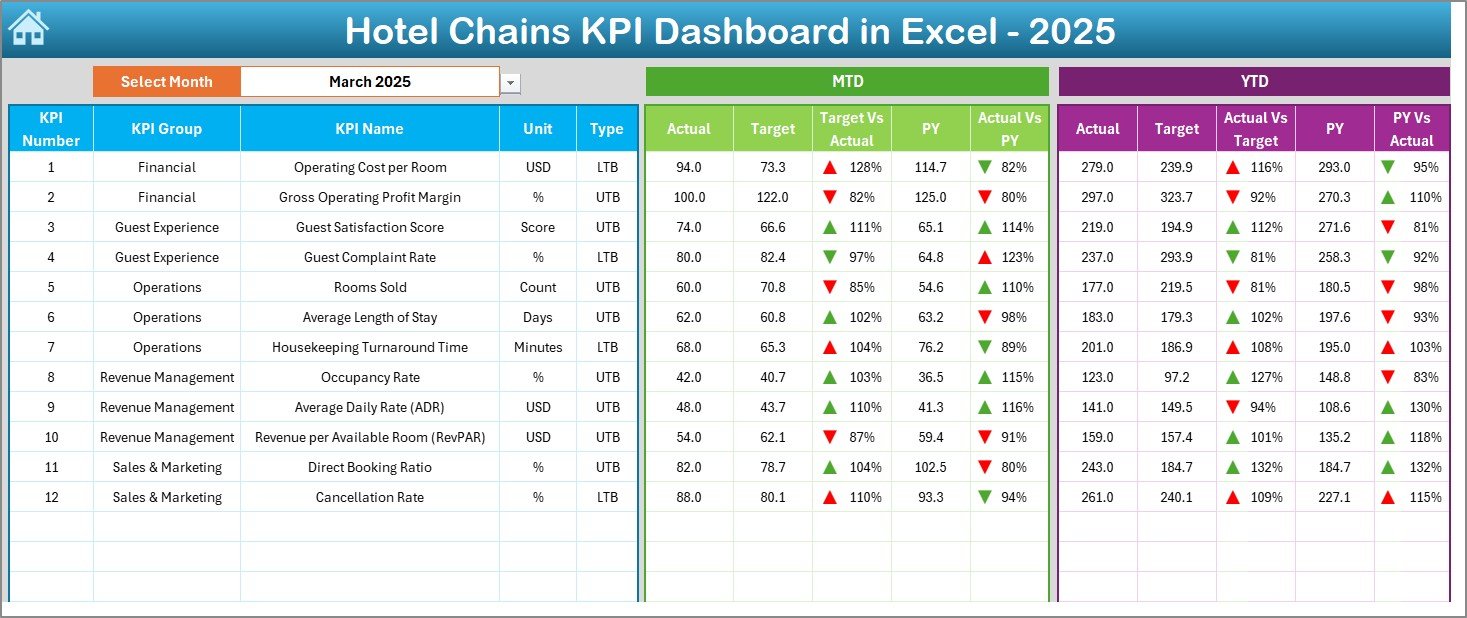
📊 Dashboard Sheet
The main performance view showing all KPIs with MTD, YTD, Target, and PY comparisons. Includes a month selector for dynamic analysis.
📉 KPI Trend Sheet
Analyze detailed KPI trends with interactive charts for Actual, Target, and Previous Year data.
✍️ Actual Numbers Input Sheet
Enter real performance data in a structured format without breaking formulas.
🎯 Target Sheet
Define monthly and yearly targets for each KPI to drive accountability and performance improvement.
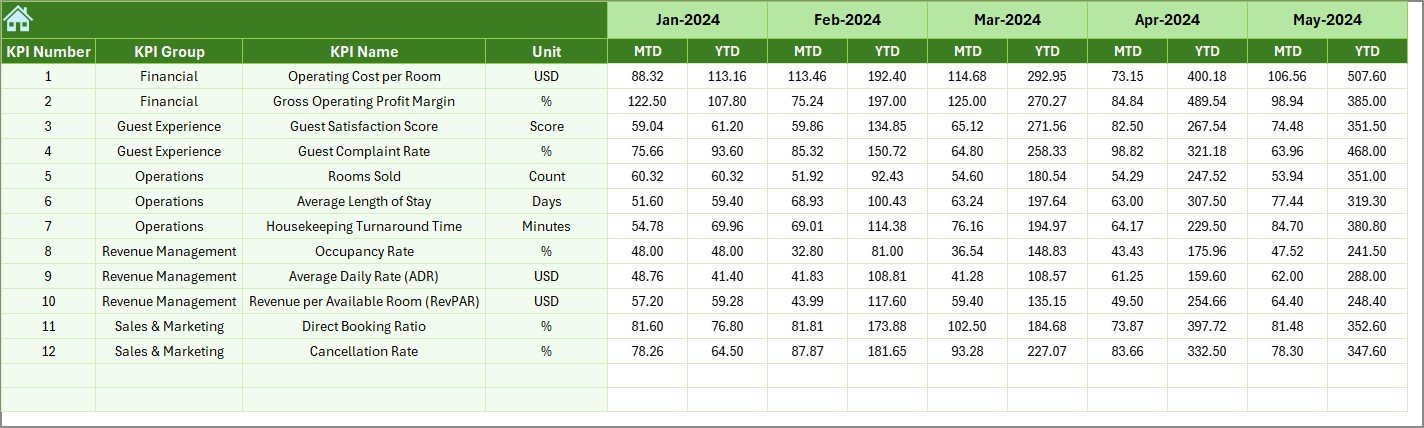
📅 Previous Year Numbers Sheet
Store last year’s data to measure growth, seasonality, and performance shifts.
📘 KPI Definition Sheet
Clearly define KPI names, units, formulas, and definitions to maintain consistency across teams.
🛠️ How to Use the Hotel Chains KPI Dashboard in Excel
Using the dashboard is simple and business-friendly:
1️⃣ Enter KPI definitions in the KPI Definition Sheet
2️⃣ Update Actual performance data in the Actual Numbers Sheet
3️⃣ Set targets in the Target Sheet
4️⃣ Add last year’s data in the Previous Year Sheet
5️⃣ Select the month from the dropdown on the Dashboard Sheet
6️⃣ Instantly view updated KPIs, comparisons, and trends
Within minutes, your dashboard transforms raw numbers into clear insights.
👥 Who Can Benefit from This Hotel Chains KPI Dashboard in Excel
🏨 Hotel Chain Owners & Executives
📊 Hotel Operations Managers
💼 Finance & Revenue Management Teams
🧠 Strategy & Planning Teams
🏢 Multi-Property Hotel Groups
📈 Hospitality Consultants & Analysts
Whether you manage a small hotel chain or a growing hospitality group, this dashboard gives you clarity, control, and confidence.
Click here to read the Detailed blog post
Visit our YouTube channel to learn step-by-step video tutorials