In the fast-moving world of hospitality, every decision counts. From room occupancy to guest satisfaction, tracking performance manually can be overwhelming. That’s why we’ve created this ready-to-use Excel KPI dashboard, designed exclusively for hoteliers, resort owners, and hospitality professionals who want to analyze their KPIs visually, efficiently, and accurately — without the need for complex software! 💡
This professional Excel template consolidates your key metrics — revenue, occupancy, guest feedback, food & beverage performance, and more — into one interactive file. With automated calculations, monthly and yearly comparisons, and trend visualization, this dashboard transforms raw data into actionable insights that help you make smarter decisions and maximize profits.
✨ Key Features of the Hospitality & Resorts KPI Dashboard in Excel
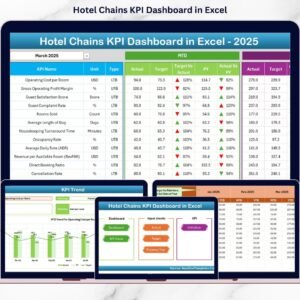
🏨 All-in-One Dashboard: Get a centralized view of your hotel or resort’s performance with just one file.
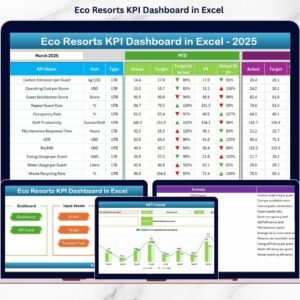
📅 Month Selector: Choose a month from the drop-down and watch all charts, tables, and metrics update instantly.
📊 MTD & YTD Analysis: Compare Month-to-Date and Year-to-Date data with your targets and previous year’s results.
📈 Dynamic Trend Tracking: Identify growth patterns, seasonal changes, and performance dips through visual trend charts.
🎯 Target vs Actual Insights: Instantly see where you’re exceeding expectations or falling behind, using green and red arrows.
🔒 Automated Calculations: No manual formulas! The dashboard updates all visuals automatically when you enter data.
🧾 KPI Definition Sheet: Clearly define every KPI with name, group, unit, formula, and whether it’s UTB (Upper-the-Better) or LTB (Lower-the-Better).
📤 Presentation-Ready: Export your charts directly into PowerPoint or PDF for professional reporting.

📦 What’s Inside the Hospitality & Resorts KPI Dashboard in Excel
This interactive Excel file includes seven powerful worksheets designed for end-to-end performance tracking:
1️⃣ Summary Page – Quick navigation hub with six buttons to jump between all key sections.
2️⃣ Dashboard Sheet – Your main control center, displaying MTD, YTD, Target, and Previous Year comparisons.
3️⃣ Trend Sheet – Visual monthly trend analysis for every KPI to spot performance fluctuations.
4️⃣ Actual Numbers Sheet – Input your real operational data for each KPI (MTD/YTD).
5️⃣ Target Sheet – Define monthly performance goals to measure progress accurately.
6️⃣ Previous Year Sheet – Store historical data for year-over-year (YoY) comparison.
7️⃣ KPI Definition Sheet – Your reference dictionary of all KPIs for clarity and consistency.
Each tab works together seamlessly, ensuring that when you update your data, your visuals adjust automatically.
⚙️ How to Use the Hospitality & Resorts KPI Dashboard in Excel
Using this dashboard is incredibly simple — even for beginners!
🧩 Step 1: Enter or customize your KPI definitions (like Occupancy %, Revenue Per Room, NPS Score, etc.).
🧮 Step 2: Input your MTD and YTD data in the Actual Numbers Sheet.
🎯 Step 3: Set your monthly and yearly targets.
📆 Step 4: Add last year’s data to track progress and growth.
📊 Step 5: Review the Dashboard Sheet for instant performance insights.
📈 Step 6: Open the Trend Sheet to identify seasonal patterns or improvement areas.
That’s it — your fully automated dashboard is ready to deliver real-time, data-driven decisions! 💼
👥 Who Can Benefit from This Hospitality & Resorts KPI Dashboard
🏨 Hotel Managers: Monitor daily, monthly, and yearly operations efficiently.
🌴 Resort Owners: Gain financial and service insights to boost revenue.
💼 Hospitality Consultants: Present client results with professional-grade visuals.
📈 Finance Teams: Track cost efficiency, RevPAR, and occupancy metrics.
👩💻 Data Analysts: Simplify KPI reporting with pre-built charts and tables.
🎓 Students & Researchers: Learn how hospitality KPIs drive decision-making.
Whether you manage a boutique resort or a chain of hotels, this dashboard will become your most trusted performance companion.
🔗 Click here to read the Detailed Blog Post
Watch the step-by-step video tutorial:









Reviews
There are no reviews yet.