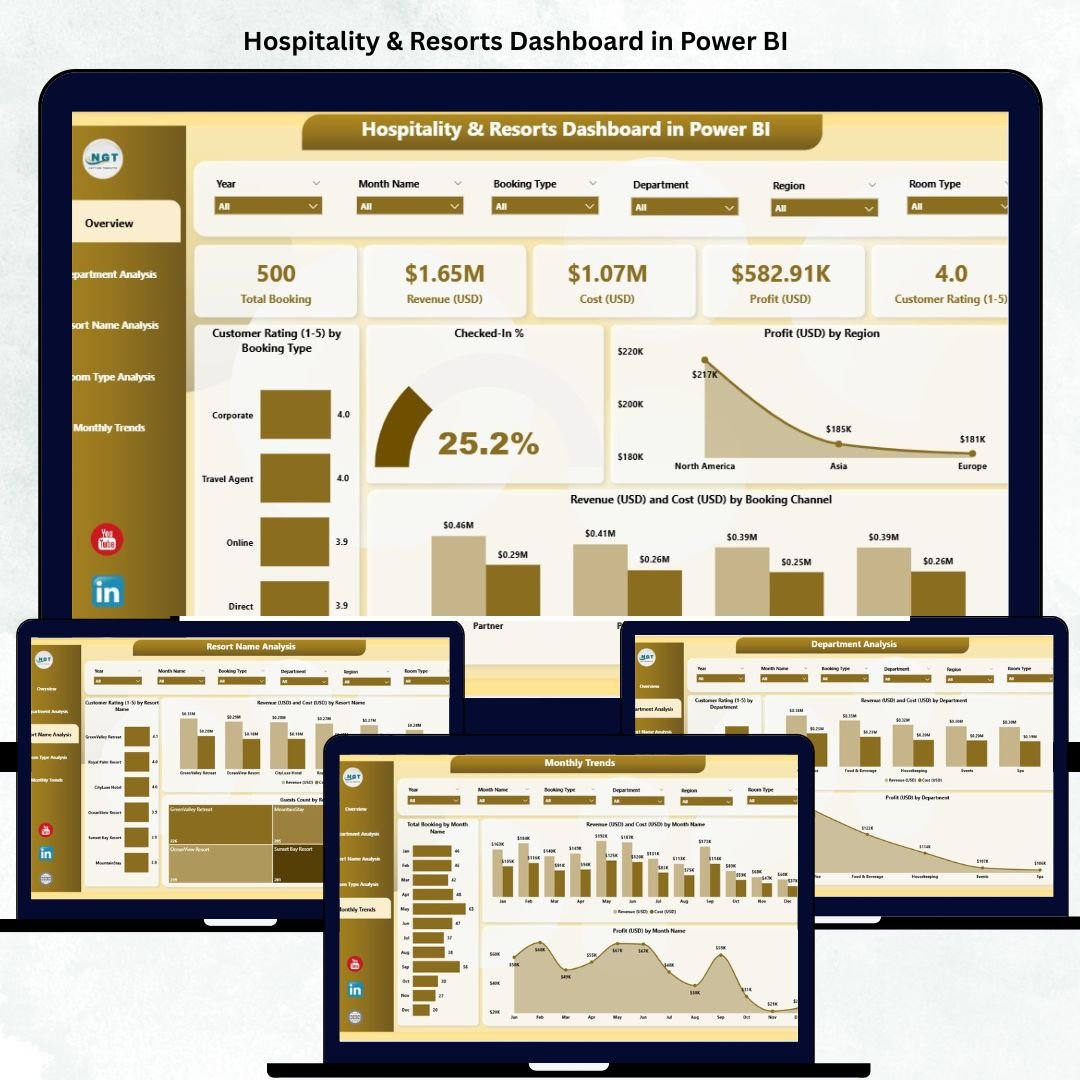
In today’s data-driven hospitality world, every guest interaction and booking holds valuable insight. Managing multiple resorts, tracking profitability, and enhancing customer satisfaction require more than spreadsheets — they demand clarity, speed, and precision. That’s where the Hospitality & Resorts Dashboard in Power BI comes in — your all-in-one analytical solution for visualizing performance, improving guest experiences, and maximizing revenue. 🌴📊
Built entirely in Microsoft Power BI, this interactive dashboard transforms scattered operational data into actionable insights. Whether you manage boutique hotels or global resort chains, you’ll gain a panoramic view of your business — from revenue and occupancy rates to profitability and guest ratings — all in real time.
🌟 Key Features of the Hospitality & Resorts Dashboard in Power BI
🏠 Overview Page – Command Center of Operations
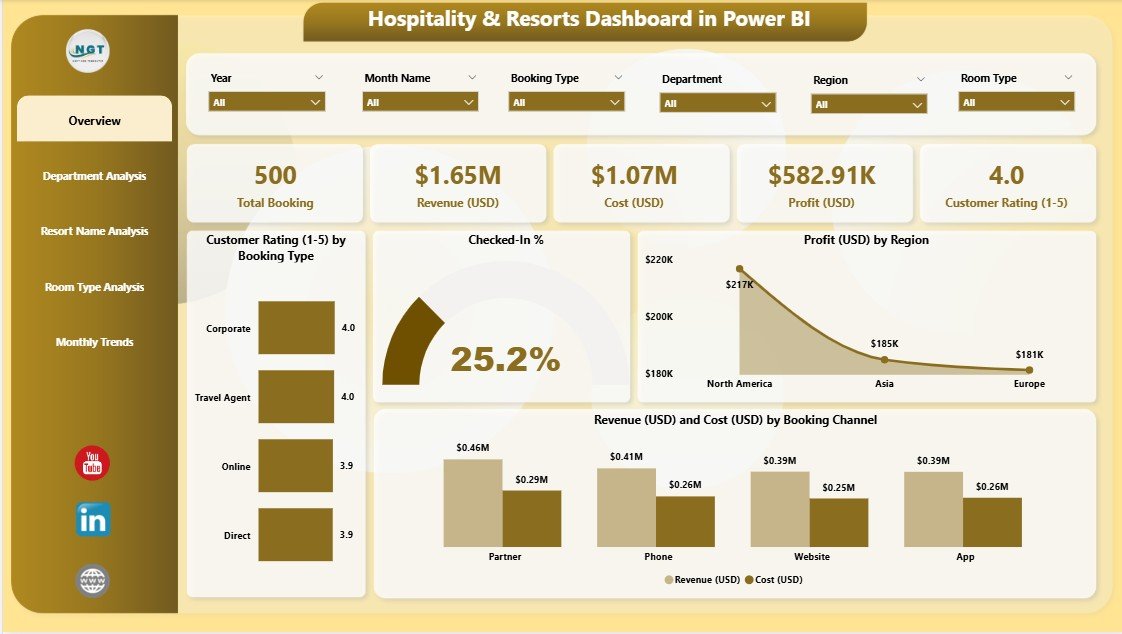
See your entire hospitality performance at a glance with interactive visuals and filters.
-
KPI Cards: Total Bookings, Total Revenue, Profit, Cost, and Customer Rating.
-
Dynamic Charts:
-
📈 Customer Rating (1–10) by Booking Type – Understand satisfaction trends.
-
💼 Checked-In % – Monitor operational efficiency.
-
💰 Profit (USD) by Region – Spot high-performing geographies.
-
📊 Revenue (USD) vs Cost (USD) by Booking Channel – Identify the most profitable booking sources.
-
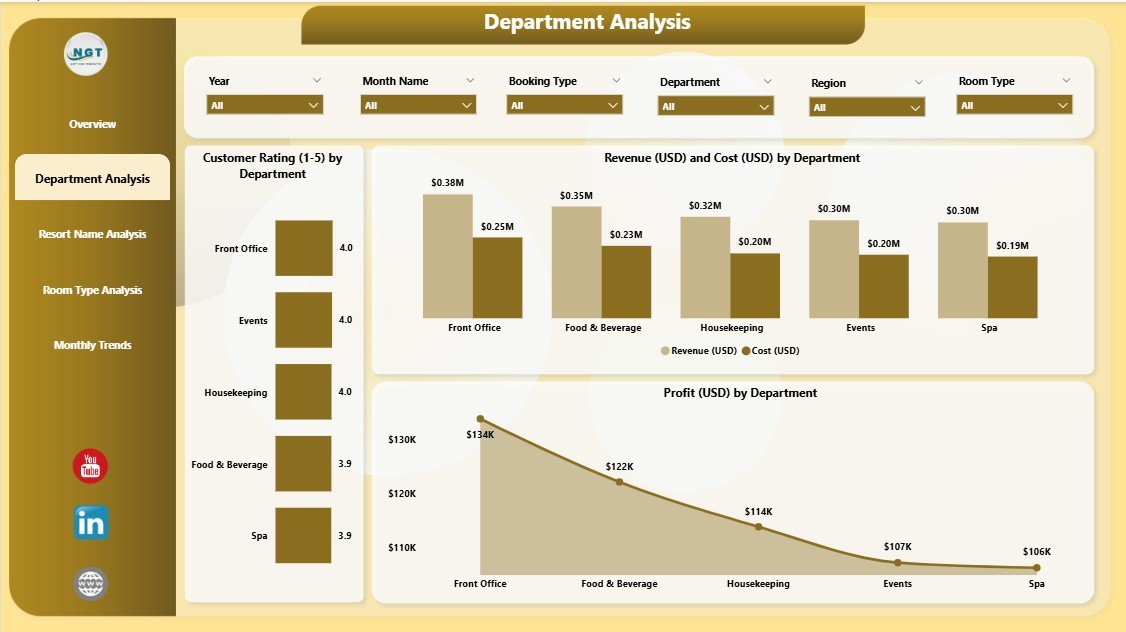
🧭 Department Analysis Page
Evaluate how each department impacts profitability and guest satisfaction.
-
Profit (USD) vs Customer Rating by Department.
-
Profit (USD) by Region & Department.
-
Cost (USD) by Booking Department.
This helps you detect bottlenecks and balance performance across teams.
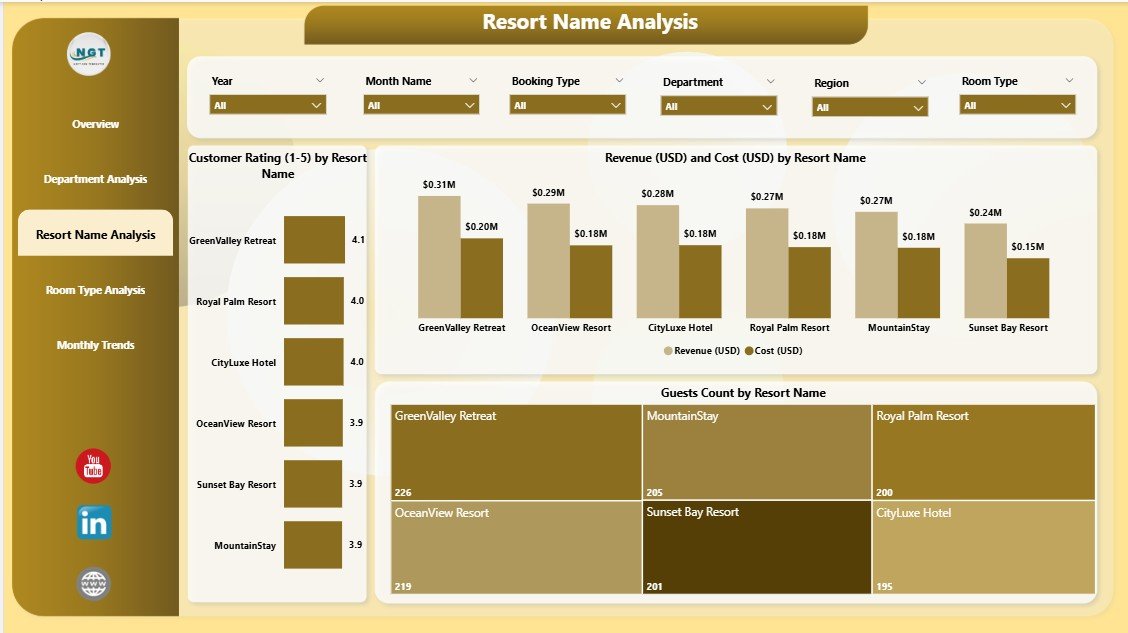
🏖️ Resort Name Analysis Page
Perfect for multi-location management. Compare revenue, cost, and satisfaction across properties.
-
Customer Rating by Resort Name.
-
Profit by Region and Resort.
-
Revenue vs Cost by Resort.
Easily identify your best-performing resorts and replicate successful strategies.
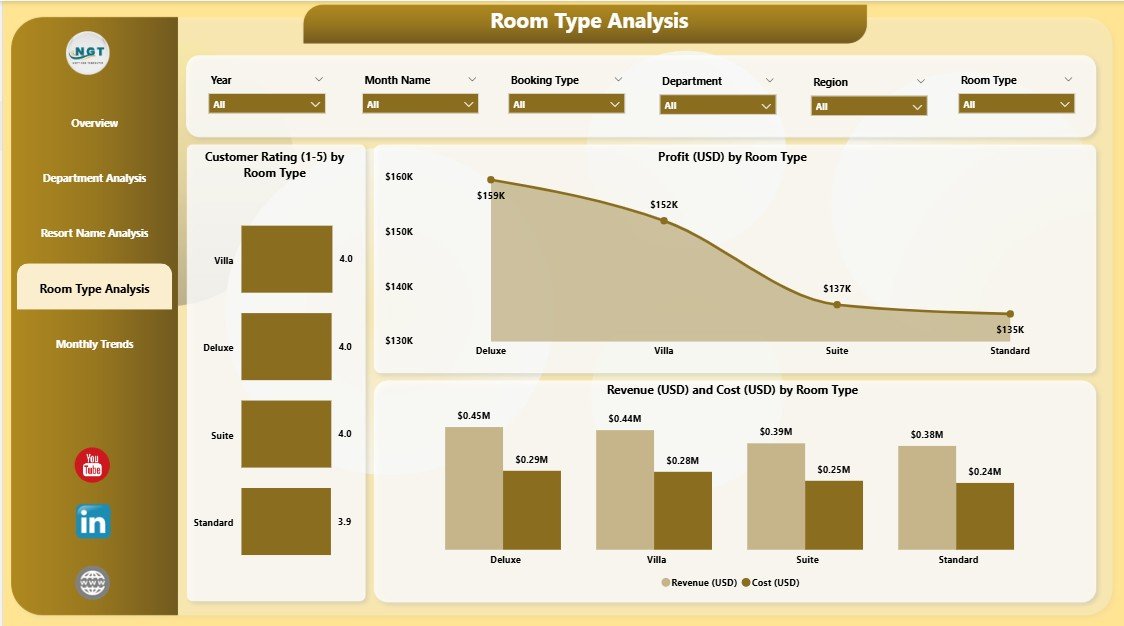
🛏️ Room Type Analysis Page
Discover which room types drive the most revenue and satisfaction.
-
Customer Rating (1–10) by Room Type.
-
Profit by Room Type & Resort Name.
-
Revenue vs Cost by Room Type.
Great for optimizing pricing, marketing, and package offerings.
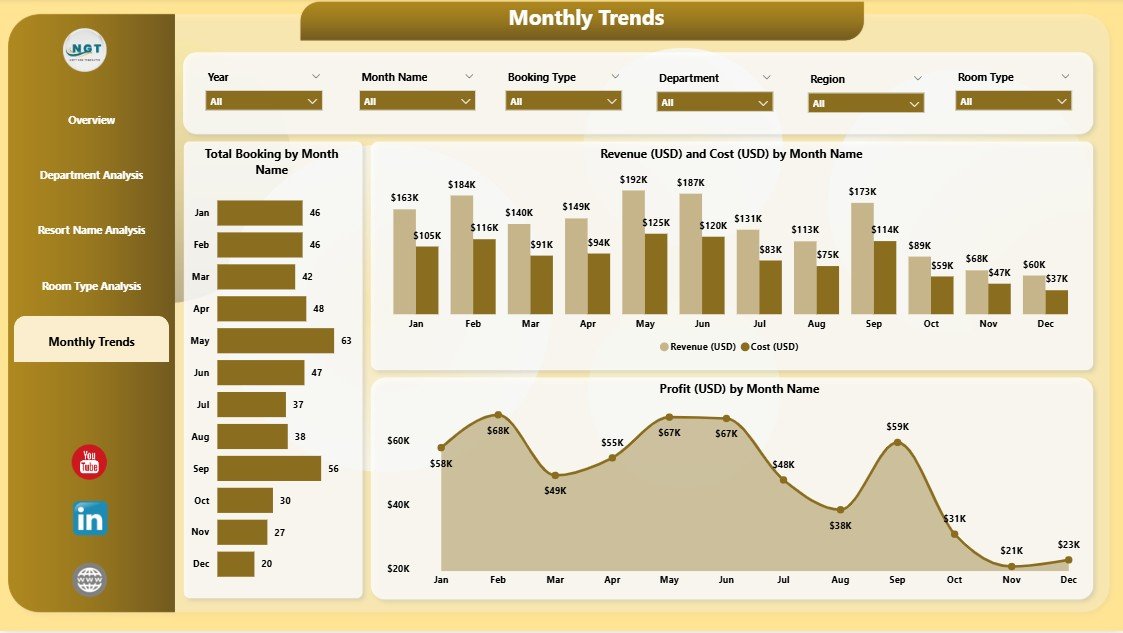
📆 Monthly Trends Page
Uncover seasonal patterns and demand cycles.
-
Total Bookings by Month.
-
Profit by Month and Resort.
-
Revenue vs Cost by Month.
Perfect for forecasting, promotions, and long-term strategy planning.
📦 What’s Inside the Dashboard
✅ 5 Interactive Pages: Overview, Department, Resort, Room Type, and Monthly Trends.
✅ Dynamic Slicers: Filter by Region, Resort, Booking Channel, or Month.
✅ Auto-Updating KPIs: Visual metrics refresh as soon as data changes.
✅ Comparative Insights: Analyze profitability, cost, and satisfaction side-by-side.
✅ Drill-Down Analysis: Click into visuals for deeper insight into specific departments or resorts.
✅ Professional Layout: Elegant, clean, and built for presentations.
🧭 How to Use the Hospitality & Resorts Dashboard in Power BI
1️⃣ Open the Power BI file and connect your Excel or PMS data source.
2️⃣ Refresh the visuals to automatically populate charts and KPIs.
3️⃣ Navigate between pages using tabs to view analysis by department, resort, or month.
4️⃣ Apply slicers and filters for targeted insights.
5️⃣ Export reports or publish to Power BI Service for real-time sharing with teams.
No coding or technical background required — everything is prebuilt and automated! ⚡
👥 Who Can Benefit from This Dashboard
🏨 Hotel & Resort Managers: Monitor occupancy, profits, and guest satisfaction in one place.
💰 Finance Teams: Track costs and profit margins by region or booking type.
📈 Marketing Managers: Identify top-performing channels and campaigns.
🧳 Operations Executives: Ensure departments meet service and efficiency goals.
📊 Executives & Owners: Gain a high-level view of overall business health.
Whether you’re overseeing one property or a chain of luxury resorts, this Power BI dashboard gives you the data clarity you need to lead with confidence.
🌍 Why Choose This Power BI Dashboard
✔️ Real-Time Insights – Get instant visibility into bookings, profit, and customer ratings.
✔️ Data Consolidation – Combine data from multiple properties into one visual platform.
✔️ Customization-Ready – Modify KPIs, visuals, and themes to fit your brand.
✔️ Improved Forecasting – Anticipate seasonal trends with Monthly Trends analysis.
✔️ Enhanced Guest Experience – Use data to fine-tune service quality and satisfaction.
✔️ Team Collaboration – Share dashboards across departments for unified decisions.
Transform your hospitality data into strategy with the Hospitality & Resorts Dashboard in Power BI — your key to smarter operations, happier guests, and higher profitability. 🌴📊
### Click here to read the Detailed blog post
Visit our YouTube channel to learn step-by-step video tutorials


Reviews
There are no reviews yet.